Potential Impact of the Gulf Oil Spill on Tourism pptx
Bạn đang xem bản rút gọn của tài liệu. Xem và tải ngay bản đầy đủ của tài liệu tại đây (2.5 MB, 27 trang )
Potential Impact of the
Gulf Oil Spill on Tourism
A report prepared for the
U.S. Travel Association
Contents
1
Introduction....................................................................................... 2
1.1
1.2
Summary of Findings ............................................................................... 2
Overview .................................................................................................. 3
2
What Is At Stake? ............................................................................. 4
3
Understanding the Impacts So Far ................................................. 6
3.1 Decline in Gulf shore interest ................................................................... 6
3.2 Declining Traveler Intentions: TNS Survey ............................................... 7
3.3 Declining Traveler Intentions: Louisiana
Survey ............................................................................................................... 8
4
What is the Outlook for Recovery?................................................. 9
4.1 Has the flow of new oil been permanently
halted?............................................................................................................... 9
4.2 Where will the oil flow? ............................................................................. 9
4.3 How long will cleanup take? ................................................................... 10
4.4 How will travelers react?......................................................................... 10
5
Case Studies and Potential Impacts ............................................. 11
5.1
5.2
5.3
6
Estimates of Impact........................................................................ 21
6.1
6.2
7
Duration of tourism impacts.................................................................... 11
Duration and Scale of Impacts ............................................................... 14
Description of Key Case Studies ............................................................ 15
5.3.1 Ixtoc Oil Spill................................................................................... 15
5.3.2 Other oil spills / HABs..................................................................... 15
5.3.3 Hurricane Katrina ........................................................................... 15
5.3.4 Other hurricanes............................................................................. 16
5.3.5 Exxon Valdez ................................................................................. 16
5.3.6 SARS / H1N1 ................................................................................. 17
5.3.7 Asian Tsunami................................................................................ 20
5.3.8 Terrorism........................................................................................ 20
Summary of Impacts .............................................................................. 21
Methodology........................................................................................... 22
Mitigating Losses ........................................................................... 24
Potential Impact of the Gulf Oil Spill on Tourism
Prepared for the U.S. Travel Association
1 Introduction
1.1
Summary of Findings
Tourism is one of the top economic drivers of the Gulf region.
Visitors to Congressional Districts along the Gulf coast spent in
excess of $34 billion in 2008, sustaining 400,000 jobs.
Current indicators show double-digit declines in plans to travel
to the region.
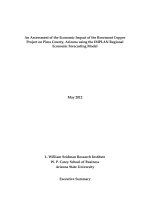
The potential impact of the Deepwater Horizon oil spill could
cost the U.S. coastal economies $22.7 billion over a period of
three years.
A review of disasters affecting tourism destinations reveals that
the impact endures beyond the resolution of the crisis itself due
to brand damage and ongoing traveler misperceptions.
The potential economic impacts of the crisis could be cut by
one-third ($7.5 billion) with the establishment of a $500 million
emergency marketing fund to counter misperceptions and
encourage travel to the affected regions.
Oil Spill Impacts on Tourism Revenue
Oil Spill Impacts on Tourism Revenue
US$, mns
% business as usual
16,000
2010
14,000
2011
2012
2013
0%
15,000
Low Impact
-5%
13,000
-10%
12,000
High Impact
11,000
-15%
10,000
Low impact scenario
9,000
8,000
2010
-20%
2011
Source: Tourism Economics
2012
2013
High impact scenario
-25%
Source: Tourism Economics
2
Potential Impact of the Gulf Oil Spill on Tourism
Prepared for the U.S. Travel Association
1.2
Overview
The Deepwater Horizon oil spill in the Gulf of Mexico is the largest offshore spill
in U.S. history. Hundreds of millions of gallons have spilled since the explosion
of the rig on April 20, 2010. The resulting oil slick covers at least 2,500 square
miles. Large underwater plumes of oil not visible at the surface have also been
reported. Estimates of the total spill range from 100 million to 184 million gallons
of oil.
The spill has already had a massive impact on the
environment and is severely affecting the
economies of the region.
This study seeks to understand the current and
potential damage to the tourism industry in the
region over a likely prolonged period of impact.
To do this, we look at a range of indicators of how
the disaster is already affecting traveler behavior.
To assess the potential longer term impacts, we
assessed the duration and magnitude of impacts
of a broad range of historic crises around the
world as inputs into a risk-weighted scenario
model.
Comparative Oil Spills
Million Gallons
Exxon Valdez,
March 1989,
Alaska
Ixtoc, January
1979, Mexico
Low Estimate
High Estimate
Deepwater
Horizon, AprilJuly 2010, Gulf
of Mexico
-
50
100
150
200
3
Potential Impact of the Gulf Oil Spill on Tourism
Prepared for the U.S. Travel Association
2 What Is At Stake?
Tourism is one of the top economic drivers of
the Gulf region. Visitors to the Gulf Coast
Congressional Districts spent more than $34
billion in 2008. The largest share of this
spending is received by Florida with more than
$20 billion in visitor spending, followed by
Texas with $7.2 billion and Louisiana with $3.6
billion.
This spending sustains nearly 400,000 jobs
within the Gulf Coast Congressional Districts.
Visitor Spending in Gulf
Aggregate of Gulf Congressional Districts, $ millions
Texas, 7,192
Alabama,
1,362
Mississippi,
1,988
Florida,
20,013
Louisiana,
3,567
Source: U.S. Travel Association
Leisure and Hospitality Employment
As a generator of employment, tourism is
more important to the Gulf economies than to
the rest of the country. Leisure and hospitality
employment represent 15 percent of total
private employment for the counties along the
Gulf shore compared with 12 percent for the
entire country. In Mississippi, 22 percent of
private employment on the coast is in the
leisure and hospitality sector.
Share (%) of all private employment
25
22
20
15
15
14
13
15
15
LA
FL
12
10
US
Total
Gulf
County
Total
Source: BLS
AL
TX
MS
Counties on Gulf Shore
Gulf Shore Tourism Employment
The 18 congressional districts touching the
Gulf Coast represent a significant share of
each state’s total tourism economy. In
Louisiana, nearly 40 percent of the state’s
tourism employment exists along the Gulf
Coast. A full 25 percent of tourism
employment in the five affected states is on
the Gulf.
Share of State Tourism Employment
40%
30%
20%
10%
0%
Texas
Alabama
Florida
Mississippi
Louisiana
Source: U.S. Travel Association
4
Potential Impact of the Gulf Oil Spill on Tourism
Prepared for the U.S. Travel Association
The visitor economy is a diverse
composite of sectors. When destinations
are affected by a disaster, the impacts
are felt by a broad spectrum of
hospitality, transport, recreation, and
retail sectors.
Visitor Spending
$ million
25,000
Mississippi
Louisiana
Florida
Alabama
20,000
15,000
10,000
5,000
Retail
Recreation
Foodservice
Lodging
Personal
auto
Transport
services
0
Source: U.S. Travel Association
Homes for Seasonal or Recreational Use
In addition, the real estate sector and
rental income are highly tied to the
tourism industry. More than 459,000
homes along the Gulf are for seasonal or
recreational use, representing 7 percent
of all homes in the congressional districts
along the shore.
The current crisis puts into jeopardy not
only rental income and the ancillary
spending of guests, but also real estate
values.
Gulf Coast Congresional Districts
350,000
300,000
250,000
200,000
150,000
100,000
50,000
Mississippi
Louisiana
Alabama
Texas
Florida
Source: U.S. Census
5
Potential Impact of the Gulf Oil Spill on Tourism
Prepared for the U.S. Travel Association
3 Understanding the Impacts So Far
The high profile of the oil spill has led to incredibly widespread economic
impacts. Although the losses have been concentrated where oil has come
ashore, tourists have shifted away from the entire region in significant numbers.
Though hard figures are not yet available, several surveys and indicators help
provide a range of the impacts which are being, or will be, experienced.
The available research tells us a few things about the crisis for the tourism
sector in these early days. First, travel intentions are down significantly for the
Gulf. Second, misperceptions abound regarding which areas are affected. And
third, travelers believe the impacts of the disaster will be felt for a long time.
3.1
Decline in Gulf shore interest
With nearly 47 million monthly visitors, TripAdvisor® is the world’s largest travel
website featuring consumer reviews for destinations, hotels, B&Bs, inns and
restaurants, offering tools to search everything from flights to vacation rental
properties. The company has provided two revealing snapshots of the decline in
searches for Gulf shore destinations.
The chart below shows the percentage drop in the share of TripAdvisor U.S.
page views for various destinations for the 20 days leading up to May 20 and to
July 18 compared to the same 20-day period one year earlier. The effect of the
oil spill on interest in the region is striking and in most cases has only increased
over time.
This decline in searches represents a leading indicator of booking as fewer
travelers are planning trips to the region. Consumers searched 52 percent less
for Pensacola, Fla. in July, 65 percent less for Gulf Shores, Ala., and 48 percent
less for Destin, Fla.
Share of TripAdvisor U.S. Page Views
% change on same 20-day period one year ago
Gulf Shores
Pensacola
Destin
Panama City Beach
Fort Myers Beach
Clearwater
Key Largo
Biloxi
Fort Lauderdale
Outer Banks
Myrtle Beach
Miami
Hilton Head
Daytona Beach
West Palm Beach
20 days until…
18-Jul
20-May
-65% -55% -45% -35% -25% -15% -5%
5%
15%
Source: TripAdvisor
6
Potential Impact of the Gulf Oil Spill on Tourism
Prepared for the U.S. Travel Association
TripAdvisor Page Views
% Change in Share of U.S.
Twenty days until…
West Palm Beach
Daytona Beach
Hilton Head
Miami
Myrtle Beach
Outer Banks
Fort Lauderdale
Biloxi
Key Largo
Clearwater
Fort Myers Beach
Panama City Beach
Destin
Pensacola
Gulf Shores
20-May
14%
1%
-4%
16%
1%
-11%
5%
-24%
-24%
-20%
-20%
-18%
-9%
-41%
-19%
20-Jun
17%
-4%
0%
1%
3%
-8%
-1%
-16%
-28%
-26%
-31%
-31%
-25%
-52%
-47%
18-Jul
9%
3%
1%
-2%
-2%
-4%
-5%
-14%
-14%
-17%
-29%
-30%
-48%
-52%
-65%
Source: TripAdvisor
A more detailed look at the data in the above table shows that the impact may
already be extending beyond where oil has come to shore. For example, the
Outer Banks has been consistently negative since the crisis began, as has much
of the Florida Gulf coast, even though oil has only been spotted in the state’s
panhandle region. Also, it is noteworthy that the east coast of Florida has
experienced increases in interest, possibly as an alternate destination.
3.2
Declining Traveler Intentions: TNS Survey
TNS is a leading provider of market research and conducted a representative
survey of U.S. households regarding their travel intentions and how they have
changed. The survey was conducted in June and found that 10 percent of those
already intending to travel to the Gulf region had changed their plans due to the
oil spill. Another 22 percent had decided not to go for unspecified reasons,
leaving only 68 percent of would-be travelers to the region holding onto their
plans.
This figure is substantial in two regards. First, it represents the average for the
entire Gulf shore region though large parts have been untouched by oil. Clearly
some regions are bearing the greater brunt of these cancellations. Second,
these are changed plans only and therefore do not include any losses of trips
that would have been planned and booked on short notice apart from the oil
spill.
The TNS survey also asked which destinations were chosen as substitutes
when Gulf trip plans were changed. Remarkably, North Carolina, Massachusetts
and Maine were among the top alternative destinations indicating a high
aversion even to proximity to the Gulf region.
7
Potential Impact of the Gulf Oil Spill on Tourism
Prepared for the U.S. Travel Association
3.3
Declining Traveler Intentions: Louisiana Tourism Survey
The Louisiana Office of Tourism commissioned two successive surveys which
were fielded by MDRG. The first was a national survey conducted from May 1921. The second was a regional survey of key visitor source markets conducted
June 18-21.
The May survey found that 26 percent of those who had plans to visit the state
of Louisiana had postponed or canceled their trip. The June survey, which
focused on relatively nearby visitor markets in Texas, Mississippi and Florida,
found that 17 percent had postponed or canceled their planned vacation to
Louisiana.
Equally serious is the perception that this disaster will affect Louisiana for years
to come. Nearly 80 percent of national respondents believed the disaster would
impact the state for at least two years with nearly 40 percent stating that the
impact will extend five years or longer. Regional respondents had an even
bleaker view of the future with 88 percent indicating an impact of at least two
years and nearly 50 percent expecting an impact lasting at least five years.
Perception of Effect on Louisiana
Share of respondents
50%
National
Regional
40%
41%
39%
31%
30%
21%
20%
11%
10%
10%
17% 18%
8%
4%
10+
years
5-10
years
2-5 years
1-2 years
Less
than 1
year
0%
Source: Louisiana Office of Tourism
Significant misperceptions were also identified by these surveys. For example,
only 14 percent of national respondents realized that Louisiana oyster beds have
not been contaminated with oil and only 45 percent of respondents believed that
seafood at Louisiana restaurants is safe.
8
Potential Impact of the Gulf Oil Spill on Tourism
Prepared for the U.S. Travel Association
4 What is the Outlook for Recovery?
Estimating the eventual impact of the spill on the tourism economies of the Gulf
faces several uncertainties. In order to begin to assess the duration and extent of
the impact, ranges must be established for these variables. We note four critical
uncertainties below as well as the most likely outcome for each.
4.1
Has the flow of new oil been permanently halted?
At the time of writing, a cap has successfully stopped the flow of oil for three
days. This is clearly encouraging, but the risk of additional oil flowing into the
Gulf remains.
4.2
Where will the oil flow?
Somewhere between 100 million and 184 million gallons of crude has spilled.
Projections indicate it could show up as far west as Corpus Christi, Texas, or as
far north as North Carolina's Outer Banks. The most widely accepted forecasts
are being conducted by The National Oceanic and Atmospheric Administration
(NOAA) which has used computer models to estimate the likelihood of various
oil flow scenarios:
The coastlines from the Mississippi River Delta to the western
panhandle of Florida: 81-100 percent oil probability
Texas: low probability (less than 1 percent in the south to 40
percent near the Louisiana border)
9
Potential Impact of the Gulf Oil Spill on Tourism
Prepared for the U.S. Travel Association
Florida Keys, Miami and Fort Lauderdale: 61-80 percent due to
the potential influence of the Loop Current
East coast of Florida and other Eastern Seaboard: 20 percent or
less with impacts less likely north of North Carolina as the Gulf
Stream moves away from the mainland
4.3
How long will cleanup take?
Here, estimates vary widely. The U.S. Coast Guard has talked about a multiyear process. The existence of oil plumes that have been found deep in the
water column add uncertainty to any estimates of the time required for recovery.
The comparably sized Ixtoc Oil Spill (140 million gallons) off Mexico’s coast in
1979 suggests that affected beaches could return to pre-spill conditions within
about three years.
However, tar balls and patties could wash ashore for longer. Some of the
mangrove swamps in the Yucatan Peninsula, an ecosystem similar to the one
found off the Louisiana Gulf coast, are currently 80 percent recovered from that
spill, and tar can still be found in some areas.
4.4
How will travelers react?
This is the true wild card. Leisure travelers have ultimate discretion in their
choice of destination and may avoid regions which have only slight
contamination or perhaps even the risk of oil. This can affect a destination for
much longer than the disaster itself and may be the most significant factor in
determining the eventual impact on the affected tourism economies. The next
section of this report addresses this issue in more detail.
10
Potential Impact of the Gulf Oil Spill on Tourism
Prepared for the U.S. Travel Association
5 Case Studies and Potential Impacts
In order to understand the potential role of traveler behavior, we have assessed
a range of disaster case studies to determine the range and duration of impacts.
From these, we can then draw conclusions on the possible outcomes for the
current oil spill.
5.1
Duration of tourism impacts
A number of comparable crises have been considered to determine a range of
possible direct impacts on tourism in the affected areas. The duration and scale
of the previous crises have been considered at a national or state level since
data and case studies are more readily available. The impacts will clearly be
higher for specific coastal areas.
Duration is calculated as the combined length of time that there was physical
disruption to tourism services in addition to the time period for which perceptions
were affected. This is measured as the time between the start of each event and
the time that visits and spending return to business as usual estimates.
The scale of the current oil spill as well as the potential tourism disruption has no
exact precedent. While earlier oil spills have been environmental disasters, the
immense scale of the current oil slick implies that the potential damage is larger.
And the proximity to unique fishing activity and tourism hotspots also places the
event apart from previous events.
A variety of events have been examined in terms of duration and scale to
determine the expected range of impacts on tourism activity:
•
Previous oil spills
•
Harmful Algal Blooms (HABs)
•
Hurricanes
•
SARS / H1N1
•
Asian Tsunami
•
Terrorist attacks
All of these events share some common characteristics in that they are either
natural disasters or unpredictable events and that they have influenced
perceptions of destinations even after the initial physical disruption is over. The
following charts document the tourism impact duration of a wide range of events
in terms of the months required to attain prior visitor spending peaks. The
average ranges are based on a single standard deviation of the recorded
durations.
11
Potential Impact of the Gulf Oil Spill on Tourism
Prepared for the U.S. Travel Association
Duration of Oil Spill Tourism Impacts
Months after initial disruption for visitor spending to return to baseline
Exxon Valdez
Ixtoc
Amoco Cadiz
Erika
Prestige
Average Range
12-28 months
Average (range)
0
10
20
30
40
50
Source : Tourism Economics
Duration of Hurricanes Tourism Impacts
Months after initial disruption for visitor spending to return to baseline
Katrina
Keith
Ivan (Cayman)
Ivan (Grenada)
Iwa
Luis
Average Range
10-27 months
Hugo
Average (range)
0
10
20
30
40
50
Source : Tourism Economics
Duration of Pandemic Tourism Impacts
Months after initial disruption for visitor spending to return to baseline
Hong Kong
(SARS)
Singapore (SARS)
Canada (SARS)
Mexico (H1N1)
Average Range
9-12 months
Average (range)
0
10
20
30
40
50
Source : Tourism Economics
12
Potential Impact of the Gulf Oil Spill on Tourism
Prepared for the U.S. Travel Association
Duration of Asian Tsunami Tourism Impacts
Months after initial disruption for visitor spending to return to baseline
Thailand
Indonesia
Sri Lanka
Maldives
Average Range
11-12 months
Average (range)
0
10
20
30
40
50
Source : Tourism Economics
Duration of Terrorism Tourism Impacts
Months after initial disruption for visitor spending to return to baseline
Bali 2003
Bali 2005
London
New York
Madrid
Sharm El Sheikh
Average Range
10-22 months
Average (range)
0
10
20
30
40
50
Source : Tourism Economics
Tourism Disruption after Crises
Months after initial disruption for visitor spending to return to baseline
(typical range and average duration by type of event)
The far left and far
right markers
represent the range
of impact duration.
The middle marker
represents the
average of all
observed timeframes.
Oil Spills
Hurricanes
Pandemics
Asian Tsunami
Terrorism
Combined
Average
0
5
Source : Tourism Economics
10
15
20
25
30
35
13
Potential Impact of the Gulf Oil Spill on Tourism
Prepared for the U.S. Travel Association
5.2
Duration and Scale of Impacts
The following chart illustrates that there is a clear relationship between the
length of the disruption and the overall scale of the tourism impact. In addition,
we see that some relatively short-lived events can also have very large effects
on tourism for that period. This is used as an input into calculating the range of
possible impacts.
The analysis shows a broad range of impacts which provides a context for the
current disaster. Some hurricanes have reported only a single-season impact
while Katrina stands out in terms of its duration and scale of impact.
The left axis shows
the peak percentage
loss in tourism
spending. The bottom
axis shows the
duration for spending
to return to predisaster levels.
Event Duration & Scale
Peak impact (% year before event)
80%
Tsunami
SARS
Hurricanes
Oil Spills / HABs
Terrorism
Gulf Oil Spill - RANGE
70%
60%
Katrina
50%
40%
The dotted box
represents the
potential range of
impacts, both in
magnitude and
duration, of the
current crisis.
30%
20%
10%
0%
0
10
20
30
Duration (months)
40
50
The dotted-line box represents the estimated range of impacts in terms of
duration and scale for the current oil spill. This is based on current estimates of
the length of time of cleanup as well as traveler uncertainty created by
misperceptions. On this basis, the Deepwater Horizon oil spill impact could
reasonably extend to three years beyond the initial spill.
14
Potential Impact of the Gulf Oil Spill on Tourism
Prepared for the U.S. Travel Association
5.3
5.3.1
Description of Key Case Studies
Ixtoc Oil Spill
In 1979, an oil rig exploded off the coast of the Yucatan in
Mexico. The Ixtoc well poured 140 million gallons of oil into the
Gulf of Mexico. Massive slicks reached the northern Mexican
Gulf coast and Texas, where it would eventually coat almost 170
miles of U.S. beaches. The beaches were largely clear within
three years. However, it was five years before all tar mats on
Texas beaches disappeared.
The Deepwater Horizon spill is closer to and, therefore, affecting
Louisiana marshlands that are more sensitive than the sparsely
populated Texan and Mexican coastlines that Ixtoc reached.
While beaches are relatively easy to clean, getting the oil out of
the delta's fragile marshlands is much more difficult, according
to scientists.
5.3.2
Other oil spills / Harmful Algal Blooms
Previous oil spills have involved huge cleanup operations and
disruption to ocean activities such as fishing with some clear
implications for tourism. However the potential disruption to
numerous tourism destinations and activities is a unique feature
of the current spill. It is likely that tourism disruption will be
higher than suggested by previous spills.
Harmful Algal Blooms (HABs) also present similar disruptions to
coastal tourism activity. Previous effects have affected fishing
activities more than broader coastal tourism activities.
5.3.3
Hurricane Katrina
On August 29, 2005, Katrina's storm surge caused 53 different
levee breaches in greater New Orleans, submerging 80 percent
of the city. The storm surge also devastated the coasts of
Mississippi and Alabama, making Katrina the most destructive
and costliest natural disaster in the history of the United States
with total damage of more than $100 billion.
In 2004, New Orleans received 10.1 million visitors. The city
hosted 7.6 million in 2008, the last year of available figures, and
remains roughly 25 percent below its pre-Katrina peak. Visitor
spending in New Orleans finally recovered fully in 2008 with
$5.1 billion compared to $4.9 billion in 2004, marking a threeyear process to reach prior peak spending levels.
15
Potential Impact of the Gulf Oil Spill on Tourism
Prepared for the U.S. Travel Association
The impact on the meetings sector endures to this day. After
Katrina, 4.6 million cumulative room nights were canceled,
extending out to 2025.
New Orleans Tourism Recovery
Katrina Impact on New Orleans Meetings
Million Visitors
8
$4
6
$3
4
$0
2015
2014
2013
2012
2011
2010
-400,000
-600,000
Total Cancelled Room
Nights = 4.6 million
$1
0
-200,000
$2
2
2009
0
$5
Billion Spend
10
2008
Spending (right side)
2007
$6
2005
Number of Visitors (left side)
12
2006
Room nights cancelled by scheduled date of meeting
-800,000
-1,000,000
2002
2003
2004
2005
Source: UniversitySource :Orleans
of New
5.3.4
2006
2007
2008
-1,200,000
Source: New Orleans CVB
Other hurricanes
Hurricanes have been considered that have significantly
disrupted tourism infrastructure across Central America and the
Caribbean measured at the country level. These tend to be
short-lived events, with disruption of less than a full year but with
very high short-term impacts.
Hurricanes are expected annually to some degree, although the
affected locations are unknown and short-term impact is
comparable. However, the legacy of the impact does not tend to
persist beyond the physical rebuilding.
An obvious exception to general analysis here is Hurricane
Katrina and its impact on Mississippi and Louisiana.
5.3.5
Exxon Valdez
In 1989, the Exxon Valdez spill dumped nearly 11 million gallons
of oil into Prince William Sound, and it spread down the Alaska
coast, ultimately oiling 1,200 miles of shoreline.
Recreation and tourism in the spill area dramatically declined in
1989 in Prince William Sound, Cook Inlet and the Kenai
Peninsula. Injuries to natural resources led resource managers
to limit access to hunting and fishing areas, and users such as
kayakers were prevented from enjoying those beaches that
harbored visible oil. Recreation was also affected by changes in
human use in response to the spill, because areas that were
16
Potential Impact of the Gulf Oil Spill on Tourism
Prepared for the U.S. Travel Association
unaffected become more heavily used as activity was displaced
from the oiled areas.
More than 40 percent of businesses in the affected region
reported significant or complete losses and visitor center
inquiries fell 55 percent in the year after the spill. $19 million in
visitor spending was lost in one season.
Of particular note, 27 percent of businesses in parts of Alaska
with no oil reported moderate or significant losses
A 2001 National Oceanic and Atmospheric Administration
(NOAA) study surveyed 96 sites along 8,000 miles of coastline.
The survey indicates a total area of approximately 20 acres of
shoreline in Prince William Sound is still contaminated with oil.
Oil was found at 58 percent of the 91 sites assessed.
5.3.6
SARS / H1N1
The experience of SARS in 2003, followed by the Asia-wide
avian flu outbreak, reminded the world of the active threat of
serious global pandemics. None of the outbreaks to date
(including swine flu in 2009) have caused global devastation on
a level with true historic pandemics but there have been some
significant impacts on local economies, not least from sharp falls
in tourism arrivals to areas with a high perceived risk. In most
observed cases these sharp falls have been short-lived, but it
has taken on average a full year for activity to return to business
as usual levels.
Recorded SARS cases in 2003 were predominantly located in
East Asia with adverse affects to travel across the region as
confidence was hit. The important travel hubs of Singapore and
Hong Kong were significantly affected. Travel spending in Hong
Kong fell by 60 percent on a year-over-year basis in mid-2003,
but a return to more normal travel patterns was evident within a
year.
The number of reported cases in Singapore was much lower
than other countries, but its position as a regional travel hub
meant that it was hit by low confidence in travel. Inbound
revenues fell by 40 percent year-over-year in mid-2003 and it
took more than a year for a return to baseline trends.
Outside of Asia, a large number of reported cases in Toronto
affected travel to Canada. Total inbound travel spending fell by
more than 15 percent compared with the previous year. This
can also be explained by a general blow to travel confidence
from key Asian origin markets and highlights the importance of
destination perceptions in travel decisions.
17
Potential Impact of the Gulf Oil Spill on Tourism
Prepared for the U.S. Travel Association
The swine flu (H1N1) outbreak in 2009 was not as virulent as
was feared and did not significantly disrupt global activity.
However, the high number of initial cases in Mexico adversely
affected tourism perceptions of the country. Tourism arrivals and
revenue fell sharply in mid-2009 and remain low in early 2010,
but almost back to levels experienced before the outbreak.
The following charts show the losses in tourism spending by
country on account of SARS and H1N1 (for Mexico). The upper
line represents the pre-pandemic forecast. The lower boundary
shows actual revenues.
18
Potential Impact of the Gulf Oil Spill on Tourism
Prepared for the U.S. Travel Association
Hong Kong Inbound Tourism Revenue
Singapore Inbound Tourism Revenue
HK$, mns
S$, mns
75,000
9,500
70,000
9,000
65,000
8,500
60,000
8,000
55,000
12 month sum
7,500
50,000
7,000
45,000
12 month sum
6,500
40,000
2001
2002
2003
6,000
2001
2004
Source : Tourism Economics / IMF BofP
2002
2003
2004
Source : Tourism Economics / IMF BofP
Indonesia Inbound Tourism Revenue
Mexico Inbound Tourism Revenue
Rupiah, bns
US$ mn
60,000
14,000
13,500
55,000
13,000
50,000
12,500
45,000
12,000
40,000
12 month sum
11,000
35,000
30,000
2004
12 month sum
11,500
10,500
2005
2006
2007
2008
Source : Tourism Economics / IMF BofP
10,000
2008 - Q1
2009 - Q1
2010 - Q1
Source : Tourism Economics / IMF BofP
Thailand Inbound Tourism Revenue
Canada Inbound Tourism Revenue
C$, mns
Baht, mns
17,500
600,000
17,000
550,000
16,500
500,000
16,000
450,000
15,500
400,000
12 month sum
15,000
350,000
14,500
300,000
14,000
250,000
12 month sum
13,500
2001
2002
2003
Source : Tourism Economics / IMF BofP
2004
200,000
2004
2005
2006
2007
Source : Tourism Economics / IMF BofP
19
Potential Impact of the Gulf Oil Spill on Tourism
Prepared for the U.S. Travel Association
5.3.7
Asian Tsunami
The Asian Tsunami of 2004 devastated coastal communities
and resorts across Asia and rebuilding is ongoing in some
cases, even though the actual event was brief. It still took at
least a year in most cases to rebuild visitor confidence in
destinations to return to business as usual.
5.3.8
Terrorism
The duration and scale of terrorism on tourism is largely
dependent on the scale and unexpectedness of the incident. If
there are already question marks regarding the safety of a
destination then the effect will be lower than if a destination has
previously been considered safe.
For example, the 2005 Bali bombing caused less disruption than
the 2003 incident, although comparison is complicated by the
effect of the Tsunami in 2004 on Bali and Indonesia in general.
Overall tourism event studies provides good examples of how
the impact of an event can persist for many months and even
years by altering tourists’ perceptions of destinations.
Indonesia Inbound Tourism Revenue
Spain Inbound Tourism Revenue
Rupiah, bns
Euro, mns
60,000
39,000
55,000
38,000
37,000
50,000
36,000
45,000
35,000
40,000
12 month sum
34,000
35,000
33,000
30,000
25,000
20,000
2001
12 month sum
32,000
31,000
2002
2003
Source : Tourism Economics / IMF BofP
2004
2005
30,000
2001
2002
2003
2004
2005
Source : Tourism Economics / IMF BofP
20
Potential Impact of the Gulf Oil Spill on Tourism
Prepared for the U.S. Travel Association
6 Estimates of Impact
6.1
Summary of Impacts
Case studies provide historic benchmarks for both the duration and scale of the
impact. The below table lays out the results of a model of potential impacts
under two scenarios. The low impact scenario is based on the lower range of
NOAA oil flow probabilities for each potentially affected region, observable
impacts to date and lower boundaries of historic disaster impacts.
The model behind the high impact scenario is based on the high range of NOAA
oil flow probabilities for each potentially affected region, observable impacts to
date and upper boundaries of historic disaster impacts. Due to the scale of the
current oil spill it is more likely that the disruption to tourism in the region will be
towards the upper end of the historic range of impacts as reviewed in the
previous section.
The disruption to visitor patterns is expected to last a minimum of 15 months.
This implies a minimum impact scenario that tourism flows to the region return to
“normal” levels by late 2011 and would entail an aggregate cost of $7.6 billion in
lost tourism revenues.
Total Impact on Gulf Region
Low Impact
Months
High Impact
15
36
Impact on Tourism Revenues
US$ Bn
% 1 year
outlook*
% 3 year
outlook**
US$ Bn
% 1 year
outlook*
% 3 year
outlook**
Total Region
$7.6
12%
4%
$22.7
25%
8%
Florida
Lousiana
Missisippi
Alabama
Texas
$6.3
$0.7
$0.4
$0.3
$0.0
13%
17%
19%
19%
0%
5%
6%
7%
7%
0%
$18.6
$2.0
$1.2
$0.8
$0.1
27%
37%
41%
41%
1%
14%
18%
20%
20%
0%
* potential lost revenues in the first 12 months relative to business as usual for coast economies
** potential lost revenues over the next 36 months relative to business as usual for coast economies
However, there is a clear risk that impacts may be greater than this and that the
crisis will adversely impact tourism arrivals for up to 36 months. In this high
impact outlook, tourism flows to the region would not return to “normal” until
early 2013, involving lost revenues of almost $22.7 billion.
The expected losses fall heavily on Florida due to the larger area at risk on both
the Gulf and Atlantic coasts. However, the coastal areas of Louisiana,
Mississippi and Alabama are more directly exposed to the disaster and the
21
Potential Impact of the Gulf Oil Spill on Tourism
Prepared for the U.S. Travel Association
proportional effects are expected to be larger. The impacts for Texas are
minimal in both scenarios due to the likely direction of oil flows.
In comparing these two scenarios, not only would tourism be affected for a
longer period in the high impact scenario, but the initial impacts are also
expected to be larger. This fits the usual profile of tourism impacts seen in
previous extended crises. A large initial response is observed, driven by both the
supply and demand side. This tends to be followed by a partial recovery as
supply is restored but perceptions and demand still take time to return to normal
levels.
For example, visits to New Orleans fell sharply in the year following Katrina with
a large drop in the number of available hotels and rooms. A little more than a
year later, more than 80 percent of capacity had been restored but room
demand lagged.
In the case of the Gulf Oil Spill, comparable impacts for 2010 are expected to be
roughly twice as large under the high impact scenario as under the low impact
scenario.
Oil Spill Impacts on Tourism Revenue
Oil Spill Impacts on Tourism Revenue
US$, mns
% business as usual
16,000
2010
2011
2012
2013
0%
15,000
Low Impact
14,000
-5%
13,000
-10%
12,000
High Impact
11,000
-15%
10,000
Low impact scenario
9,000
-20%
8,000
2010
2011
Source: Tourism Economics
6.2
2012
2013
High impact scenario
-25%
Source: Tourism Economics
Methodology
Potential high and low tourism losses were identified from case studies and have
been applied to Gulf Coast tourism revenues. Since these estimated impacts are
derived from comparable case studies they are net impacts and include any
offset from relief workers, government officials and media. It should be noted
that the spending and activity patterns of these visitors are much more limited
than leisure travelers.
A range of impacts for the Gulf Coast as a whole has been estimated according
to the range of impacts in case studies. The expected duration of the crisis was
estimated within the range of 15 to 36 months. However, the range of overall
impacts is not purely due to different durations. Case studies also indicate a
22
Potential Impact of the Gulf Oil Spill on Tourism
Prepared for the U.S. Travel Association
range of proportional responses in tourism revenues, relative to pre-crisis levels.
This informs the range of estimates of the peak one-year response to the crisis.
Specific ranges of impacts can be determined by adjusting the overall potential
loss by the relative risk of oil reaching shores using the probabilities derived from
NOAA ocean current and wind probabilities. Accordingly, the coastline between
the Mississippi River Delta and the western panhandle of Florida are expected to
experience the greatest proportional losses in tourism revenues in both low and
high scenarios.
Potential losses are applied to tourism revenues for Gulf Coast congressional
districts grouped by state, as described in Section 2. The exception is Florida
since the full extent of its coastline is at risk to a relatively high degree.
This methodology has the important implication that Texas is expected to be
largely unaffected despite having a large Gulf coastline. NOAA sees a minimal
risk to the bulk of Texas shore. Less than 2 percent of its Gulf revenues are at
risk in the worst case scenario.
23
Potential Impact of the Gulf Oil Spill on Tourism
Prepared for the U.S. Travel Association
7 Mitigating Losses
The difference between the low and high boundaries of the impact over a three
year period is $15 billion. This poses the question, “What can be done to move
the impact toward the lower boundary?”
The range of potential impacts depends largely on the uncertainties described in
Section 4. Namely:
Has the flow of new oil been permanently halted?
Where will the oil flow?
How long will cleanup take?
How will travelers react?
Of the four major uncertainties, the last one is the easiest to influence. As noted
in many of the case studies and even in the current crisis, perceptions are
critical to the recovery. In many instances, the impact of misperceptions on
travel and tourism is greater than the effects of reactions to the real disaster.
Current data from surveys and TripAdvisor show that this is happening already
with vacationers avoiding the entire region, partly for lack of information.
Therefore, a critical part of the recovery strategy should include a robust
communications and marketing plan for the entire region to both inform and
motivate travel to the broadly affected region.
This is the key lever available to the travel and tourism industry to move the total
impact toward the lower boundary of total impact over the next three years.
Separate research by Oxford has determined a range of tourism marketing ROI
for various destination campaigns over the past decade. This analysis showed
that some of the most effective campaigns were conducted after a crisis. This
was observed in campaigns both for Canada after SARS and for Alaska after the
Exxon Valdez spill. After eliminating outliers on both the low and high end, we
found tourism marketing campaigns to yield a return of $5 to $64 in visitor
spending for every dollar spent on marketing.
The industry has called for a dedicated emergency marketing
fund of $500 million as a means of reducing the medium and
longer term impacts of the oil spill. If we assume an average
ROI of 15:1 (which is conservative in light of a documented
ROI of 20:1 for post-SARS campaigns in 2004), the $500
million in marketing would generate $7.5 billion in tourism
spending in the regions affected by the oil spill.
Another way to describe this scenario is that $500 million in
marketing spending could relieve half of the $15 billion
uncertainty between the lower and upper boundaries of
potential impact. This would effectively cut the total impact on
the travel and tourism economy by a third in comparison to
the high impact scenario.
Expected Event Impacts
$ Million, Three‐Year Cumulative
Tourism Industry Loss
Low Impact
High Impact
Difference
$
$
$
7,621
22,737
15,115
Suggested Marketing
Assumed ROI (Visitor spend
per dollar marketing)
$
500
Visitor Spend Benefit
% of High-Low Difference
% of High Impact Scenario
$
15:1
7,500
50%
33%
24