THE ATLAS OF ECONOMIC COMPLEXITY MAPPING PATHS TO PROSPERITY doc
Bạn đang xem bản rút gọn của tài liệu. Xem và tải ngay bản đầy đủ của tài liệu tại đây (7.7 MB, 91 trang )
the atlas of
ECONOMIC COMPLEXIT Y
Hausmann, Hidalgo et al.
M A P P I N G P A T H S T O P R O S P E R I T Ythe atlas of
ECONOMIC COMPLEXIT Y
Hausmann, Hidalgo et al.
M A P P I N G P A T H S T O P R O S P E R I T Y
T H E ATL A S OF E C O NOM I C CO M P LEX I T Y
M A P P I N G P A T H S T O P R O S P E R I T Y
A U TH O RS :
Ricardo Hausmann
|
César A. Hidalgo
|
Sebastián Bustos
|
Michele Coscia
Sarah Chung
|
Juan Jimenez
|
Alexander Simoes
|
Muhammed A. Yıldırım
A CK N OW LE D GM EN TS
The research on which this Atlas is based began around 2006 with the idea of the
product space. In the original paper published in Science in 2007, we collaborated
with Albert-Laszlo Barabasi and Bailey Klinger. The view of economic development of
countries as a process of discovering which products a country can master, a process
we called self-discovery, came from joint work with Dani Rodrik and later also with
Jason Hwang. We explored different implications of the basic approach in papers
with Dany Bahar, Bailey Klinger, Robert Lawrence, Francisco Rodriguez, Dani Rodrik,
Charles Sabel, Rodrigo Wagner and Andrés Zahler. Throughout, we received signicant
feedback and advice from Lant Pritchett, Andrés Velasco and Adrian Wood.
We want to thank the dedicated team that runs Harvard’s Center for International
Development (CID) for helping bring the Atlas to life: Marcela Escobari, Jennifer Gala,
Irene Gandara Jones, Aimee Fox, Adriana Hoyos, Andrea Carranza, Anne Morriss and
Catalina Prieto. We are also indebted to the NeCSys team at the MIT Media Lab and to
Sandy Sener. We thank the leadership at Harvard Kennedy School and the MIT Media
Lab who were early enthusiasts of our work.
The editorial design of this book was produced by DRAFT. We would like to especially
acknowledge the contributions of Francisca Barros and Beltrán García.
ISBN-10: 0615546625
ISBN-13: 9780615546629
|
Ricardo Hausmann
|
César A. Hidalgo
|
Sebastián Bustos
|
Michele Coscia
|
|
Sarah Chung
|
Juan Jimenez
|
Alexander Simoes
|
Muhammed A. Yıldırım
|
the atlas of
ECONOMIC COMPLEXIT Y
M A P P I N G P A T H S T O P R O S P E R I T Y
ver the past two centuries, mankind has
accomplished what used to be unthink-
able. When we look back at our long list of
achievements, it is easy to focus on the most
audacious of them, such as our conquest of
the skies and the moon. Our lives, however,
have been made easier and more prosper-
ous by a large number of more modest, yet
crucially important feats. Think of electric
bulbs, telephones, cars, personal computers, antibiotics, TVs,
refrigerators, watches and water heaters. Think of the many
innovations that benet us despite our minimal awareness
of them, such as advances in port management, electric
power distribution, agrochemicals and water purication.
This progress was possible because we got smarter. During
the past two centuries, the amount of productive knowledge
we hold expanded dramatically. This was not, however, an
individual phenomenon. It was a collective phenomenon. As
individuals we are not much more capable than our ances-
tors, but as societies we have developed the ability to make
all that we have mentioned – and much, much more.
Modern societies can amass large amounts of produc-
tive knowledge because they distribute bits and pieces of it
among its many members. But to make use of it, this knowl-
edge has to be put back together through organizations and
markets. Thus, individual specialization begets diversity at
the national and global level. Our most prosperous modern
societies are wiser, not because their citizens are individu-
ally brilliant, but because these societies hold a diversity of
knowhow and because they are able to recombine it to create
a larger variety of smarter and better products.
O
P R E F A C E
most part, it is not available in books or on the Internet.
It is embedded in brains and human networks. It is tacit
and hard to transmit and acquire. It comes from years of
experience more than from years of schooling. Productive
knowledge, therefore, cannot be learned easily like a song
or a poem. It requires structural changes. Just like learning
a language requires changes in the structure of the brain,
developing a new industry requires changes in the patterns
of interaction inside an organization or society.
Expanding the amount of productive knowledge available
in a country involves enlarging the set of activities that the
country is able to do. This process, however, is tricky. Indus-
tries cannot exist if the requisite productive knowledge is
absent, yet accumulating bits of productive knowledge will
make little sense in places where the industries that require
it are not present. This “chicken and egg” problem slows
down the accumulation of productive knowledge. It also
creates important path dependencies. It is easier for coun-
tries to move into industries that mostly reuse what they
already know, since these industries require adding modest
amounts of productive knowledge. By gradually adding new
knowledge to what they already know, countries economize
on the chicken and egg problem. That is why we nd em-
pirically that countries move from the products that they
already create to others that are “close by” in terms of the
productive knowledge that they require.
The Atlas of Economic Complexity attempts to measure the
amount of productive knowledge that each country holds. Our
measure of productive knowledge can account for the enor-
mous income differences between the nations of the world
and has the capacity to predict the rate at which countries
The social accumulation of productive knowledge has not
been a universal phenomenon. It has taken place in some
parts of the world, but not in others. Where it has hap-
pened, it has underpinned an incredible increase in living
standards. Where it has not, living standards resemble those
of centuries past. The enormous income gaps between rich
and poor nations are an expression of the vast differences in
productive knowledge amassed by different nations. These
differences are expressed in the diversity and sophistication
of the things that each of them makes, which we explore in
detail in this Atlas.
Just as nations differ in the amount of productive knowl-
edge they hold, so do products. The amount of knowledge
that is required to make a product can vary enormously
from one good to the next. Most modern products require
more knowledge than what a single person can hold. No-
body in this world, not even the saviest geek nor the most
knowledgeable entrepreneur knows how to make a com-
puter. He has to rely on others who know about battery
technology, liquid crystals, microprocessor design, software
development, metallurgy, milling, lean manufacturing and
human resource management, among many other skills.
That is why the average worker in a rich country works in
a rm that is much larger and more connected than rms
in poor countries. For a society to operate at a high level
of total productive knowledge, individuals must know dif-
ferent things. Diversity of productive knowledge, however, is
not enough. In order to put knowledge into productive use,
societies need to reassemble these distributed bits through
teams, organizations and markets.
Accumulating productive knowledge is difcult. For the
will grow. In fact, it is much more predictive than other well-
known development indicators, such as those that attempt to
measure competitiveness, governance and education.
A central contribution of this Atlas is the creation of a
map that captures the similarity of products in terms of
their knowledge requirements. This map provides paths
through which productive knowledge is more easily accu-
mulated. We call this map, or network, the product space,
and use it to locate each country, illustrating their current
productive capabilities and the products that lie nearby.
Ultimately, this Atlas views economic development as a
social learning process, but one that is rife with pitfalls and
dangers. Countries accumulate productive knowledge by
developing the capacity to make a larger variety of products
of increasing complexity. This process involves trial and er-
ror. It is a risky journey in search of the possible. Entrepre-
neurs, investors and policymakers play a fundamental role
in this economic exploration.
By providing rankings, we wish to clarify the scope of the
achievable, as revealed by the experience of others. By track-
ing progress, we offer feedback regarding current trends. By
providing maps, we do not pretend to tell potential explor-
ers where to go, but to pinpoint what is out there and what
routes may be shorter or more secure. We hope this will em-
power these explorers with valuable information that will
encourage them to take on the challenge and thus speed up
the process of economic development.
Director, Center for International Development at Harvard University,
Professor of the Practice of Economic Development, Harvard Kennedy School,
George Cowan Professor, Santa Fe Institute.
ABC Career Development Professor, MIT Media Lab,
Massachusetts Institute of Technology (MIT),
Faculty Associate, Center for International Development at Harvard University.
R i caR d o Ha u s man n c é saR a . Hi d a lgo
We thank the many individuals who, early on, understood the potential impact of research on
economic growth, and shared our team’s vision. The generosity of these supporters made this work feasible
and now makes it available to individuals, organizations and governments throughout the world.
T H e a u T HoR s wa n T To a ckn o w led g e THe g ene R o us s u p poR T of:
|
Alejandro Santo Domingo
|
MPower Foundation
|
Standard Bank
|
Anonymous Donor
|
What Do We Mean by Economic Complexity?
How Do We Measure Economic Complexity?
Why Is Economic Complexity Important?
How Is Complexity Different from Other Approaches?
How Does Economic Complexity Evolve?
How Can This Atlas Be Used?
Which Countries Are Included in This Atlas?
12
41
24
56
17
53
30
SECTION 1
SECTION 2
SECTION 3
SECTION 4
SECTION 5
SECTION 6
SECTION 7
What, WhY aND hoW?
PART 1
C O N T E N T S
How to Read the Country Pages
Albania
Zimbabwe
92
Economic Complexity Index
Expected Growth in Per Capita GDP to 2020
Expected GDP Growth to 2020
Change in Economic Complexity (1964-2008)
Expected Contribution to World GDP Growth to 2020
60
84
72
66
78
RANKING 1
RANKING 2
RANKING 3
RANKING 4
RANKING 5
96
·
·
·
350
CoMPleXItY RaNKINGs
PART 2
CoUNtRY PaGes
PART 3
What, WhY aND hoW?
PART 1
SECTION 1
MAPPING PATHS TO PROSPERITY | 15
hat are things made out of? One way
of describing the economic world
is to say that things are made with
machines, raw materials and labor.
Another way is to emphasize that
products are made with knowledge.
Consider toothpaste. Is toothpaste
just some paste in a tube? Or do
the paste and the tube allow us to
access knowledge about the properties of sodium uoride
on teeth and about how to achieve its synthesis? The true
value of a tube of toothpaste, in other words, is that it mani-
fests knowledge about the chemicals that facilitate brush-
ing, and that kill the germs that cause bad breath, cavities
and gum disease.
When we think of products in these terms, markets take
on a different meaning. Markets allow us to access the vast
amounts of knowledge that are scattered among the people
of the world. Toothpaste embeds our knowledge about the
chemicals that prevent tooth decay, just like cars embody
our knowledge of mechanical engineering, metallurgy, elec-
tronics and design. Computers package knowledge about in-
formation theory, electronics, plastics and graphics, whereas
apples embody thousands of years of plant domestication
as well as knowledge about logistics, refrigeration, pest con-
trol, food safety and the preservation of fresh produce.
Products are vehicles for knowledge, but embedding
knowledge in products requires people who possess a work-
ing understanding of that knowledge. Most of us can be ig-
norant about how to synthesize sodium uoride because
we can rely on the few people who know how to create this
W
atomic cocktail, and who together with their colleagues at
the toothpaste factory, can deposit it into a product that we
can use.
We owe to Adam Smith the idea that the division of labor
is the secret of the wealth of nations. In a modern reinter-
pretation of this idea, the division of labor is what allows
us to access a quantity of knowledge that none of us would
be able to hold individually. We rely on dentists, plumbers,
lawyers, meteorologists and car mechanics to sustain our
standard of living, because few of us know how to ll cavi-
ties, repair leaks, write contracts, predict the weather or x
our cars. Many of us, however, can get our cavities lled, our
cars repaired and our weather predicted. Markets and orga-
nizations allow the knowledge that is held by few to reach
many. In other words, they make us collectively wiser.
The amount of knowledge embedded in a society, how-
ever, does not depend mainly on how much knowledge each
individual holds. It depends, instead, on the diversity of
knowledge across individuals and on their ability to com-
bine this knowledge, and make use of it, through complex
webs of interaction. A hunter-gatherer in the Arctic must
know a lot of things to survive. Without the knowledge em-
bedded in an Inuit, most of us would die in the Arctic, as has
been demonstrated by the number of Westerners who have
tried and failed. Yet, the total amount of knowledge embed-
ded in a hunter-gatherer society is not very different from
that which is embedded in each one of its members. The se-
cret of modern societies is not that each person holds much
more productive knowledge than those in a more traditional
society. The secret to modernity is that we collectively use
large volumes of knowledge, while each one of us holds only
a few bits of it. Society functions because its members form
webs that allow them to specialize and share their knowl-
edge with others.
We can distinguish between two kinds of knowledge: ex-
plicit and tacit. Explicit knowledge can be transferred easily
by reading a text or listening to a conversation. Yesterday’s
sports results, tomorrow’s weather forecast or the size of the
moon can all be learned quickly by looking them up in a
newspaper or on the web. And yet, if all knowledge had this
characteristic, the world would be very different. Countries
would catch up very quickly to frontier technologies, and the
income differences across the world would be much smaller
than what we see today. The problem is that crucial parts of
knowledge are tacit and therefore hard to embed in people.
Learning how to x dental problems, speak a foreign lan-
guage, or run a farm requires a costly and time-consuming
effort. As a consequence, it does not make sense for all of us
to spend our lives learning how to do everything. Because it
is hard to transfer, tacit knowledge is what constrains the
process of growth and development. Ultimately, differences
in prosperity are related to the amount of tacit knowledge
that societies hold.
Because embedding tacit knowledge is a long and costly
process, we specialize. This is why people are trained for
specic occupations and why organizations become good at
specic functions. To x cavities you must be able to identi-
fy them, remove the decayed material and replace it. To play
baseball, you must know how to catch, eld and bat, but you
do not need to know how to give nancial advice or x cavi-
ties. On the other hand, to perform the function of baseball
player, knowing how to catch a ball is not enough (you must
also be able to eld and bat). In other words, in allocating
productive knowledge to individuals, it is important that
the chunks each person gets be internally coherent so that
he or she can perform a certain function. We refer to these
modularized chunks of embedded knowledge as capabili-
ties. Some of these capabilities have been modularized at
the level of individuals, while others have been grouped into
organizations and even into networks of organizations.
For example, consider what has happened with under-
graduate degrees, which in the US take four years of study.
This norm has remained constant for the last four centuries.
During the same period, however, knowledge has expanded
enormously. The university system did not respond to the
increase in knowledge by lengthening the time it takes to
get a college degree. Instead, it increased the diversity of
degrees. What used to be a degree in philosophy, split into
several branches, one being natural philosophy, which later
split into physics, chemistry and biology and later into other
disciplines such as ecology, earth sciences and psychology.
The Bureau of Labor Statistics’ Standard Occupation Clas-
sication for 2010 lists 840 different occupations, including
78 in healthcare, 16 in engineering, 35 kinds of scientists –
in coarse categories such as “economists”, “physicists” and
“chemists” – ve types of artists, and eight kinds of design-
ers. We can all imagine a much more nuanced classication
in our respective elds. For instance, we could distinguish
between economists that specialize in labor, trade, nance,
development, industrial organization, macro and econo-
metrics, among others. If we did this further disaggrega-
tion for all occupations, we would easily go into the tens
of thousands. The only way that society can hold all of the
knowledge we have is by distributing coherent pieces of it
among individuals. It is the way the world adapts to expand-
ing knowledge.
Most products, however, require more knowledge than
can be mastered by any individual. Hence, those products
require that individuals with different capabilities interact.
Assume that a person has the capacity to hold an amount of
tacit knowledge equal to one personbyte. How can you make
a product that requires 100 different personbytes? Obvious-
ly, it cannot be made by a micro-entrepreneur working on
her own. It has to be made either by an organization with at
least 100 individuals (with a different personbyte each), or
by a network of organizations that can aggregate these 100
personbytes of knowledge. How can a society hold a kilo-,
mega- or giga-personbyte? Only through a deep division of
labor, in which individuals become experts in small pieces
of the available knowledge and then aggregate their person-
bytes into peoplebytes through organizations and markets.
For example, to make a shirt you need to design it, pro-
cure the fabric, cut it, sew it, pack it, brand it, market it and
distribute it. In a rm that manufactures shirts, expertise
in each of these knowledge chunks will be held by differ-
ent people. And shirts require all of them. Moreover, you
need to nance the operation, hire the relevant people, co-
ordinate all the activities and negotiate everybody’s buy-in,
which in itself require different kinds of knowhow. We can
say that putting together this operation requires know-who
and know-where. Know-who can be thought of as knowl-
edge of who has the requisite chunks of knowledge, and
know-where as knowledge of where the people and orga-
nizations that have this knowledge are located. To make
shirts, you can import the fabric and access the knowledge
about looms and threading that is embedded in a piece of
cloth. Yet some of the knowledge required cannot be acce-
ssed through shipped inputs. The people with the relevant
knowledge must be near the place where shirts are made.
In fact, just as knowhow is modularized in people in the
form of individual capabilities, larger amounts of knowhow
are modularized in organizations, and networks of organi-
zations, as organizational or collective capabilities. For ex-
ample, to operate a garment plant you need power and wa-
ter. You need to be able to move raw materials in and ship
the nal product out. Workers need access to urban trans-
portation, day care centers and health facilities. To be able
to operate, the plant manager needs all of these services to
be locally available. This implies that others must be aggre-
18 | THE ATLAS OF ECONOMIC COMPLEXITY
gating the personbytes required to generate power, provide
clean water, and run a transportation system. The relevant
capabilities to perform all of these functions reside in orga-
nizations that are able to package the relevant knowledge
into transferable bundles. These are bundles of knowhow
that are more efciently organized separately and trans-
ferred as intermediate inputs. We can think of these bun-
dles as organizational capabilities the manufacturer needs.
Ultimately, the complexity of an economy is related to
the multiplicity of useful knowledge embedded in it. For
a complex society to exist, and to sustain itself, people who
know about design, marketing, nance, technology, human
resource management, operations and trade law must be
able to interact and combine their knowledge to make prod-
ucts. These same products cannot be made in societies that
are missing parts of this capability set. Economic complex-
ity, therefore, is expressed in the composition of a coun-
try’s productive output and reects the structures that
emerge to hold and combine knowledge.
Knowledge can only be accumulated, transferred and
preserved if it is embedded in networks of individuals and
organizations that put this knowledge into productive use.
Knowledge that is not used, however, is also not transferred,
and will disappear once the individuals and organization
How Do We Measure Economic Complexity?
that have it retire or die.
Said differently, countries do not simply make the prod-
ucts and services they need. They make the ones they can.
To do so, they need people and organizations that possess
relevant knowledge. Some goods, like medical imaging de-
vices or jet engines, embed large amounts of knowledge
and are the results of very large networks of people and or-
ganizations. By contrast, wood logs or coffee, embed much
less knowledge, and the networks required to support these
operations do not need to be as large. Complex economies
are those that can weave vast quantities of relevant knowl-
edge together, across large networks of people, to generate
a diverse mix of knowledge-intensive products. Simpler
economies, in contrast, have a narrow base of productive
knowledge and produce fewer and simpler products, which
require smaller webs of interaction. Because individuals
are limited in what they know, the only way societies can
expand their knowledge base is by facilitating the interac-
tion of individuals in increasingly complex webs of orga-
nizations and markets. Increased economic complexity is
necessary for a society to be able to hold and use a larger
amount of productive knowledge, and we can measure it
from the mix of products that countries are able to make.
How Do We Measure Economic Complexity?
SECTION 2
20 | THE ATLAS OF ECONOMIC COMPLEXITY
ow do we go from what a country makes to
what a country knows? If making a product
requires a particular type and mix of knowl-
edge, then the countries that make the
product reveal having the requisite knowl-
edge (see Technical Box 2.1). From this simple
observation, it is possible to extract a few
implications that can be used to construct
a measure of economic complexity. First,
countries whose residents and organizations possess more
knowledge have what it takes to produce a more diverse
set of products. In other words, the amount of embedded
knowledge that a country has is expressed in its productive
diversity, or the number of distinct products that it makes.
Second, products that demand large volumes of knowledge
are feasible only in the few places where all the requisite
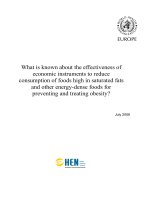
knowledge is available. We dene ubiquity as the number of
countries that make a product (Figure 2.1). Using this termi-
nology, we can observe that complex products –those that
contain many personbytes of knowledge–are less ubiqui-
tous. The ubiquity of a product, therefore, reveals informa-
tion about the volume of knowledge that is required for its
production. Hence, the amount of knowledge that a country
has is expressed in the diversity and ubiquity of the prod-
ucts that it makes.
A game of scrabble is a useful analogy. In scrabble, play-
ers use tiles containing single letters to make words. For in-
stance, a player can use the tiles R, A and C to construct the
word CAR or ARC. In this analogy, each product is repre-
sented by a word, and each capability, or module of embed-
ded knowledge, is represented by a letter. We assume that
each player has plenty of copies of the letters they have. Our
measure of economic complexity corresponds to estimating
what fraction of the alphabet a player possesses, knowing
only how many words he or she can make, and how many
other players can also make those same words.
Players who have more letters will be able to make more
H
words. So we can expect the diversity of words (products)
that a player (country) can make to be strongly related to the
number of letters (capabilities) that he (it) has. Long words
will tend to be rare, since they can only be put together by
players with many letters. Hence, the number of players
that can make a word tells us something about the variety
of letters each word requires: longer words tend to be less
ubiquitous, while shorter words tend to be more common.
Similarly, ubiquitous products are more likely to require few
capabilities, and less ubiquitous products are more likely to
require a large variety of capabilities.
Diversity and ubiquity are, respectively, crude approxi-
mations of the variety of capabilities available in a country
or required by a product. Both of these mappings are af-
fected by the existence of rare letters, such as Q and X. For
instance, players holding rare letters will be able to put to-
gether words that few other players can make, not because
they have many letters, but because the letters that they
have are rare. This is just like rare natural resources, such
as uranium or diamonds. Yet, we can see whether low ubiq-
uity originates in scarcity or complexity by looking at the
number of other words that the makers of rare words are
able to form. If these players can only make a few other
words, then it is likely that rarity explains the low ubiquity.
However, if the players that can make these rare words are,
in general, able to put together many other words, then it
is likely that the low ubiquity of the word reects the fact
that it requires a large number of letters and not just a few
rare ones.
Diversity can therefore be used to correct the informa-
tion carried by ubiquity, and ubiquity can be used to cor-
rect the information carried by diversity. We can take this
process a step further by correcting diversity using a mea-
sure of ubiquity that has already been corrected by diversity
and vice versa. In fact, we can do this an innite number
of times using mathematics. This process converges after a
few iterations and represents our quantitative measures of
MAPPING PATHS TO PROSPERITY | 21
Diversity (k
c,0
):
Diversity is related to the number of
products that a country is connected to.
This is equal to the number of links that
this country has in the network. In this
example, using a subset of the 2009 data,
the diversity of Netherlands is 5, that of
Argentina is 3, and that of Gana is 1.
Ubiquity (k
p,0
):
Ubiquity is is related to the number of
countries that a product is connected to.
This is equal to the number of links that
this product has in the network. In this
example, using a subset of the 2009 data,
the ubiquity of Cheese is 2, that of Fish is 3
and that of Medicaments is 1.
ARGENTINA (ARG)
GHANA (GHA)
X-RAY MACHINES
MEDICAMENTS
CREAMS AND POLISHES
CHEESE
FROZEN FISH
NETHERLANDS (NLD)
F I G UR E 2 .1 :
U B I QU IT Y :
Ubiquity is is related to the number of
countries that a product is connected to.
This is equal to the number of links that
this product has in the network. In this
example, using a subset of the 2009 data,
the ubiquity of Cheese is 2, that of Fish is
3 and that of Medicaments is 1.
D I V ER SI T Y :
Diversity is related to the number of
products that a country is connected
to. This is equal to the number of
links that this country has in the
network. In this example, using a
subset of the 2009 data, the diversity
of Netherlands is 5, that of Argentina
is 3, and that of Gana is 1.
Graphical explanation of diversity and ubiquity.
22 | THE ATLAS OF ECONOMIC COMPLEXITY
complexity. For countries, we refer to this as the Econom-
ic Complexity Index (ECI). The corresponding measure for
products gives us the Product Complexity Index. Technical
Box 2.2 presents the mathematical denition of these two
quantities and Ranking 1 lists countries sorted by their ECI.
Figure 2.2 shows a map of the world colored according to a
country’s ECI ranking.
Consider the case of Singapore and Pakistan. The popula-
tion of Pakistan is 34 times larger than that of Singapore. At
market prices their GDPs are similar since Singapore is 38
times richer than Pakistan in per capita terms. Under the
classication we use in this Atlas, they both export a simi-
lar number of different products, about 133. How can prod-
ucts tell us about the conspicuous differences in the level
of development that exist between these two countries?
Pakistan exports products that are on average exported by
28 other countries (placing Pakistan in the 60
th
percentile
of countries in terms of the average ubiquity of their prod-
ucts), while Singapore exports products that are exported
on average by 17 other countries (1
st
percentile). Moreover,
the products that Singapore exports are exported by highly
diversied countries, while those that Pakistan exports are
exported by poorly diversied countries. Our mathematical
approach exploits these second, third and higher order dif-
ferences to create measures that approximate the amount
of productive knowledge held in each of these countries. Ul-
timately, what countries make reveals what they know (see
Information Box 2.1).
Take medical imaging devices. These machines are made in
few places, but the countries that are able to make them, such
as the United States or Germany, also export a large number
of other products. We can infer that medical imaging devices
F I G UR E 2 .2 :
Rank
1
128
Map of the World colored according to ECI Ranking.
MAPPING PATHS TO PROSPERITY | 23
are complex because few countries make them, and those
that do tend to be diverse. By contrast, wood logs are exported
by most countries, indicating that many countries have the
knowledge required to export them. Now consider the case
of raw diamonds. These products are extracted in very few
places, making their ubiquity quite low. But is this a reection
of the high knowledge-intensity of raw diamonds? Of course
not. If raw diamonds were complex, the countries that would
extract diamonds should also be able to make many other
things. Since Sierra Leone and Botswana are not very diversi-
ed, this indicates that something other than large volumes
of knowledge is what makes diamonds rare (see Information
Box 2.2 on Product Complexity).
This Atlas relies on international trade data. We made
this choice because it is the only dataset available that has
a rich detailed cross-country information linking countries
to the products that they produce in a standardized clas-
sication. As such, it offers great advantages, but it does
have limitations. First, it includes data on exports, not pro-
duction. Countries may be able to make things that they do
not export. The fact that they do not export them, however,
suggests that they may not be very good at them. Coun-
tries may also export things they do not make. To circum-
vent this issue we require that countries export a fair share
of the products we connect them to (see Technical Box 2.1).
Second, because the data is collected by customs ofces, it
includes only goods and not services. This is an important
drawback, as services are becoming a rising share of inter-
national trade. Unfortunately, the statistical efforts of most
countries of the world have not kept up with this reality.
Finally, the data does not include information on non-trad-
able activities. These are an important part of the economic
eco-system that allows products and services to be made.
Our current research is focused on nding implementable
solutions to these limitations, and we hope we will be able
to present them in future versions of this Atlas.
I n f o r m a t I o n B o x 2 . 1 : a n a l t e r n a t I v e
w ay t o u n d e r s ta n d o u r m e a s u r e s
o f e c o n o m I c c o m p l e x I t y
Understanding the measures of economic complexity described in this At-
las can be sometimes challenging. Analogies, however, can help get our minds
around what the economic complexity index is able to capture.
Think of a particular country and consider a random product. Now, ask
yourself the following question: If this country cannot make this product, in
how many other countries can this product be made? If the answer is many
countries, then this country probably does not have a complex economy. On
the other hand, if few other countries are able to make a product that this
country cannot make, this would suggest that this is a complex economy.
Let us illustrate this with a few examples. According to our measures, Ja-
pan and Germany are the two countries with the highest levels of economic
complexity. Ask yourself the question: If a good cannot be produced in Japan
or Germany, where else can it be made? That list of countries is likely to be
a very short one, indicating that Japan and Germany are complex economies.
Now take an opposite example: if a product cannot be made in Mauritania or
Sudan, where else can it be made? For most products this is likely to be a long
list of countries, indicating that Sudan and Mauritania are among the world’s
least complex economies.
This analogy is useful to understand the difference between economic com-
plexity and the level of income per capita of a country. Two countries that have
high levels of economic complexity, but still low levels of per capita income are
China and Thailand. Ask yourself the question, if you cannot produce it in China
or Thailand, where else can you produce it? That list of countries will tend to be
relatively short. The comparison becomes starker if we restrict it to countries
with a similar level of per capita income, like Iran, Peru and Venezuela, countries
that do not make things that many other can.
At the opposite end of this comparison, there are countries with high levels
of per capita income but relatively low levels of economic complexity. Examples
of this are Qatar, Kuwait, Oman, Venezuela, Libya and Chile. These countries
are not rich because of the productive knowledge they hold but because of their
“geological luck”, given the large volumes of natural resources based wealth.
Ask yourself the question; if you cannot build it in Chile or Venezuela, where
else can you build it? The fact that there are many countries where it would be
possible to produce many things that are not being made in Chile or Venezuela,
including countries with a similar level of income such as Hungary or the Czech
Republic, indicates that the level of economic complexity of these countries is
low, despite their fairly high level of income.
In fact, as we show in this Atlas, the gap between a country’s complexity
and its level of per capita income is an important determinant of future growth:
countries tend to converge to the level of income that can be supported by the
knowhow that is embedded in their economy.
24 | THE ATLAS OF ECONOMIC COMPLEXITY
T E CHN I C AL B O X 2.1: M E A SUR I N G E CONOM I C COMPLEX I T Y :
If we define , as a matrix that is 1 if country produces product , and
otherwise, we can measure diversity and ubiquity simply by summing over the
rows or columns of that matrix. Formally, we define:
To generate a more accurate measure of the number of capabilities available
in a country, or required by a product, we need to correct the information that
diversity and ubiquity carry by using each one to correct the other. For coun-
tries, this requires us to calculate the average ubiquity of the products that it
exports, the average diversity of the countries that make those products and
so forth. For products, this requires us to calculate the average diversity of the
countries that make them and the average ubiquity of the other products that
these countries make. This can be expressed by the recursion:
We then insert (4) into (3) to obtain
and rewrite this as :
We note (7) is satisfied when
.This is the eigenvector of
which is associated with the largest eigenvalue. Since this eigenvector is
a vector of ones, it is not informative. We look, instead, for the eigenvector asso-
ciated with the second largest eigenvalue. This is the eigenvector that captures
the largest amount of variance in the system and is our measure of economic
complexity. Hence, we define the Economic Complexity Index (ECI) as:
where
where < > represents an average, stdev stands for the standard deviation and
Analogously, we define a Product Complexity Index (PCI). Because of the
symmetry of the problem, this can be done simply by exchanging the index of
countries (c) with that for products (p) in the definitions above. Hence, we de-
fine PCI as:
where
MAPPING PATHS TO PROSPERITY | 25
I n f o r m a t I o n B o x 2 . 2 : t h e w o r l d ’ s m o s t a n d l e a s t c o m p l e x p r o d u c t s
Table 2.2.1 and Table 2.2.2 show respectively the products that rank highest
and lowest in the complexity scale. The difference between the world’s most
and less complex products is stark. The most complex products are sophistica-
ted chemicals and machinery that tend to emerge from organizations where a
large number of high skilled individuals participate. The world’s least complex
products, on the other hand, are raw minerals or simple agricultural products.
The economic complexity of a country is connected intimately to the com-
plexity of the products that it exports. Ultimately, countries can only increase
their score in the Economic Complexity Index by becoming competitive in an
increasing number of complex industries.
T A B L E 2 . 2 . 1 : T O P 5 P R O D U C T S B Y C O M P L E X I T Y
Product Code (SITC4) Product Name Product Community Product Complexity Index
7284 Machines & appliances for specialized particular industries Machinery 2.27
8744 Instrument & appliances for physical or chemical analysis Chemicals & Health 2.21
7742 Appliances based on the use of X-rays or radiation Chemicals & Health 2.16
3345 Lubricating petrol oils & other heavy petrol oils Chemicals & Health 2.10
7367 Other machine tools for working metal or metal carbide Machinery 2.05
T A B L E 2 . 2 . 2 : B O T T O M 5 P R O D U C T S B Y C O M P L E X I T Y
Product Code (SITC4) Product Name Product Community Product Complexity Index
3330 Crude oil Oil -3.00
2876 Tin ores & concentrates Mining -2.63
2631 Cotton, not carded or combed Cotton, Rice, Soy & Others -2.63
3345 Cocoa beans Tropical Agriculture -2.61
7367 Sesame seeds Cotton, Rice, Soy & Others -2.58
We use this measure to construct a matrix that connects each country to
the products that it makes. The entries in the matrix are 1 if country
exports
product
with Revealed Comparative Advantage larger than 1, and o otherwise.
Formally we define this as the
matrix, where
is the matrix summarizing which country makes what, and is used to
construct the product space and our measures of economic complexity for
countries and products. In our research we have played around with cutoff
values other than 1 to construct the
matrix and found that our results are
robust to these changes.
Going forward, we smooth changes in export volumes induced by the price
fluctuation of commodities by using a modified definition of RCA in which the
denominator is averaged over the previous three years.
t e c h n I c a l B o x 2 . 2 : w h o m a k e s w h a t ?
When associating countries to products it is important to take into account
the size of the export volume of countries and that of the world trade of prod-
ucts. This is because, even for the same product, we expect the volume of ex-
ports of a large country like China, to be larger than the volume of exports of a
small country like Uruguay. By the same token, we expect the export volume of
products that represent a large fraction of world trade, such as cars or footwear,
to represent a larger share of a country’s exports than products that account for
a small fraction of world trade, like cotton seed oil or potato flour.
To make countries and products comparable we use Balassa’s definition of
Revealed Comparative Advantage or RCA. Balassa’s definition says that a coun-
try has Revealed Comparative Advantage in a product if it exports more than its
“fair” share, that is, a share that is equal to the share of total world trade that
the product represents. For example, in 2008, with exports of $42 billion, soy-
beans represented 0.35% of world trade. Of this total, Brazil exported nearly $11
billion, and since Brazil’s total exports for that year were $140 billion, soybeans
accounted for 7.8% of Brazil’s exports. This represents around 21 times Brazil’s
“fair share” of soybean exports (7.8% divided by 0.35%), so we can say that
Brazil has revealed comparative advantage in soybeans.
Formally, if
represents the exports of country in product , we can
express the Revealed Comparative Advantage that country
has in product as: