Association of Chicken Growth Hormones and Insulinlike Growth Factor Gene Polymorphisms with Growth Performance and Carcass Traits in Thai Broilers
Bạn đang xem bản rút gọn của tài liệu. Xem và tải ngay bản đầy đủ của tài liệu tại đây (1.95 MB, 11 trang )
See discussions, stats, and author profiles for this publication at: />
Association of cGH and IGF-I Gene Polymorphisms with Growth Performance
and Carcass Traits in Thai Broilers
Article in Asian Australasian Journal of Animal Sciences · September 2015
DOI: 10.5713/ajas.15.0028
CITATIONS
READS
11
370
3 authors, including:
Monchai Duangjinda
Khon Kaen University
94 PUBLICATIONS 576 CITATIONS
SEE PROFILE
Some of the authors of this publication are also working on these related projects:
Applying mathematical and quantitive models in pig supply chain management View project
Master bull project View project
All content following this page was uploaded by Monchai Duangjinda on 29 November 2015.
The user has requested enhancement of the downloaded file.
1686
Open Access
Asian Australas. J. Anim. Sci.
Vol. 28, No. 12 : 1686-1695 December 2015
/>
www.ajas.info
pISSN 1011-2367
eISSN 1976-5517
Association of Chicken Growth Hormones and Insulin-like Growth Factor Gene
Polymorphisms with Growth Performance and Carcass Traits in Thai Broilers
1
Nguyen Thi Lan Anh1, Sajee Kunhareang1,2, and Monchai Duangjinda1,2,*
Department of Animal Science, Faculty of Agriculture, Khon Kaen University, Khon Kaen 40002, Thailand
ABSTRACT: Molecular marker selection has been an acceptable tool in the acceleration of the genetic response of desired traits to
improve production performance in chickens. The crossbreds from commercial parent stock (PS) broilers with four Thai synthetic
breeds; Kaen Thong (KT), Khai Mook Esarn (KM), Soi Nin (SN), and Soi Pet (SP) were used to study the association among chicken
growth hormones (cGH) and the insulin-like growth factor (IGF-I) genes for growth and carcass traits; for the purpose of developing a
suitable terminal breeding program for Thai broilers. A total of 408 chickens of four Thai broiler lines were genotyped, using polymerase
chain reaction-restriction fragment length polymorphism methods. The cGH gene was significantly associated with body weight at
hatching; at 4, 6, 8, 10 weeks of age and with average daily gain (ADG); during 2 to 4, 4 to 6, 0 to 6, 0 to 8, and 0 to 10 weeks of age in
PS×KM chickens. For PS×KT populations, cGH gene showed significant association with body weight at hatching, and ADG; during 8
to 10 weeks of age. The single nucleotide polymorphism variant confirmed that allele G has positive effects for body weight and ADG.
Within carcass traits, cGH revealed a tentative association within the dressing percentage. For the IGF-I gene polymorphism, there were
significant associations with body weight at hatching; at 2, 4, and 6 weeks of age and ADG; during 0 to 2, 4 to 6, and 0 to 6 weeks of
age; in all of four Thai broiler populations. There were tentative associations of the IGF-I gene within the percentages of breast muscles
and wings. Thus, cGH gene may be used as a candidate gene, to improve growth traits of Thai broilers. (Key Words: cGH Gene, IGF-I
Gene, Polymerase Chain Reaction-Restriction Fragment Length Polymorphism, Marker Assisted Selection, Thai Broilers)
INTRODUCTION
commercial breed production. Promwatee et al. (2013)
demonstrated that body weights of Thai synthetic chickens
Poultry production is an important and diverse (50% native genetics) at 14 weeks of age, were between
component of agriculture all over the world. Today, more 1,532 to 1,561 g; which is significantly higher than the
attention has been given to indigenous animals in general, average body weight (1,280 g) of the typical 16 week Thai
and poultry in particular; due to their quality of meat and native chicken (Jaturasitha et al., 2008). Additionally, the
sustainable production (Kaya and Yıldız, 2008). Meat from market price of Thai native chickens is nearly two to three
Thai native chickens is preferred by more Thai consumers times higher than the commercial broiler (Wattanachant et
than commercial broilers (Theerachai et al., 2003), due to al., 2004). Nowadays, hybrid chickens (with less than 50%
their superior taste, meat texture, low fat and cholesterol, native genetics) are more desirable for open-housing
and high protein content (Promwatee and Duangjinda, commercial production, due to the lower cost of production
2010). However, the native chickens are inferior in (faster growth) and greater tolerance to heat stress. Cross
production due to their low growth rates, as compared with breeding of parent stock (PS) broiler sires with Thai
synthetic breeds, in order to achieve a terminal hybrid of
* Corresponding Author: Monchai Duangjinda. Tel: +66-4375% broiler and 25% Thai native chicken (referred to as the
202362, Fax: +66-43-202361, E-mail:
Thai broiler), is of interest to the modern trait market. The
2 Research and Development Network Center for Animal
Breeding (Native Chicken), Khon Kaen University, Khon Kaen products have a lower price, better taste, and better meat
texture; compared to commercial broilers. In this regard,
40002, Thailand.
Submitted Jan. 9, 2015; Revised Apr. 6, 2015; Accepted May 19, 2015
genetic improvements of parental lines for Thai broilers
Copyright © 2015 by Asian-Australasian Journal of Animal Sciences
This is an open-access article distributed under the terms of the Creative Commons Attribution Non-Commercial License ( />which permits unrestricted non-commercial use, distribution, and reproduction in any medium, provided the original work is properly cited.
Anh et al. (2015) Asian Australas. J. Anim. Sci. 28:1686-1695
must be studied to meet the demands of consumers.
Growth performance and carcass traits are very
significant economic traits in broiler production, and are
controlled by sets of complex genes. Growth is a
complicated procedure, regulated by a wide variety of
neuroendocrine pathways (Zhang et al., 2008). For this
reason, it is very difficult to make rapid progress using
conventional methods of genetic selection within breeds
(Zhang et al., 2008). Recent advances in molecular
technology have provided new opportunities to evaluate
genetic variability at the DNA level (Kaya and Yildiz, 2008).
Therefore, the candidate gene approach has become a
powerful technique for genetic improvement in the chicken
breeding program. Applying a candidate gene may result in
higher efficiency in detecting the desired traits necessary to
improve production performance. The chicken growth
hormone (cGH) and insulin-like growth factor-I (IGF-I)
genes are among the most promising candidate genes for
growth performance and carcass quality traits in chickens.
The cGH is a 22-kDa protein, containing 191 amino
acid residues (Hrabia et al., 2008). In poultry, cGH consists
of 4,101 base pairs, having five exons and four introns
(Kansaku et al., 2008). Known as a polypeptide, hormone
produced, and secreted by pituitary gland; cGH affects a
variety of physiological functions in growth performance
(Byatt et al., 1993; Apa et al., 1994). In the works of various
authors, it was found that cGH gene is one of the most
important genes affecting chicken performance traits, and
plays a critical role in both growth and metabolism rates
(Feng et al., 1997; Vasilatos-Younken et al., 2000).
IGF-I is known as one of the more predominant
hormones necessary to support normal growth in chickens
(Scanes, 2009; Boschiero et al., 2013). Furthermore, IGF-I
is also involved in growth hormone secretion and regulation
(Piper and Porter, 1997; Spencer et al., 1997; Rousseau and
Dufour, 2007). In previous studies, the chicken IGF-I has
been revealed to involve as many as 70 amino acids
(Ballard et al., 1990). IGF-I is a complex system of peptide
hormones that bind to the insulin-like growth factor I
receptor (IGFIR), in order to activate their intrinsic tyrosine
kinase domain activities (Denley et al., 2005). Additionally,
the effect of IGF-I was observed on the protein synthesis of
chicken embryo myoblast, cultured in a serum free medium
(Kita and Okumura, 2000). Zhou et al. (2005) and Amills et
al. (2003) reported that polymorphism of the IGF-I gene in
the promoter and 5’- untranslated region (5’- UTR) was
directly associated with chicken growth rate. There were
dramatically higher IGF-I concentrations in the high growth
rate line chickens, than those in the low growth rate line
chickens (Beccavin et al., 2001).
To develop a suitable terminal breeding program it is
necessary to study the relationship of cGH and IGF-I genes
for use as candidate genes in Thai broilers. The purpose of
1687
the present study was to examine the association of cGH
and IGF-I genes within the growth performance, and
carcass traits in Thai broilers.
MATERIALS AND METHODS
Chicken populations
Four Thai broiler hybrids were established by crossing
sires from a broiler breeder line (PS) with dams from four
Thai synthetic chicken lines; namely, the Kaen Thong (KT),
Khai Mook Esarn (KM), Soi Nin (SN), and Soi Pet (SP;
Promwatee et al., 2013). A total of 408 individuals from the
four Thai broiler lines were studied: PS×KT (n = 101),
PS×KM (n = 104), PS×SN (n = 104), and PS×SP (n = 99).
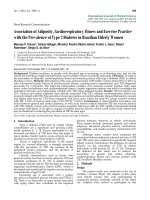
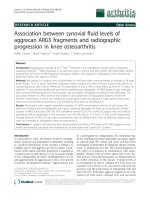
Phenotypic characteristics of all chicken lines are shown in
Figure 1. All of four different colors of Thai synthetic dam
lines are shown while only the white color of Thai broiler
lines are shown due to the dominance of white color from
PS broiler sire. The sample of Thai broiler chickens were
supplied by the Research and Development Network Center
for Animal Breeding, Khon Kaen University, Khon Kaen,
Thailand. All chickens were fed ad libitum within the
commercial broiler diet.
Measurement of growth and carcass traits
Body weight (BW) of 408 chickens was recorded
individually at hatching; and at 2, 4, 6, 8, and 10 weeks of
age (BW 0, BW 2, BW 4, BW 6, BW 8, and BW10). The
average daily gain (ADG) was calculated at two week
intervals: 0 to 2 weeks of age (ADG 0-2), 2 to 4 weeks of
age (ADG 2-4), 4 to6 weeks of age (ADG 4-6), 6 to 8
weeks of age (ADG 6-8), 8 to 10 weeks of age (ADG 8-10);
as well as 0 to 6 weeks of age (ADG 0-6), 0 to 8 weeks of
age (ADG 0-8), and 0 to 10 weeks of age (ADG 0-10).
Description of data is described in Table 1 and 2. The
formula of ADG was calculated using the equation below:
ADG (g/chick/d )
Final body weight (g) - Initial body weight (g)
Total day of growth period (d)
A total of 32 chickens were slaughtered at 10 weeks of
age (8 chickens per line with 4 chickens per sex). All
chickens were chosen as a representative sample based on
average body weight and sex for each line. Carcass traits
included live weight, dressing percentage, and the
percentages of the measured breasts, drumsticks, wings, and
thighs.
Genotyping with polymerase chain reaction-restriction
fragment length polymorphism
Genomic DNA was extracted from the blood of 408
1688
Anh et al. (2015) Asian Australas. J. Anim. Sci. 28:1686-1695
(A)
(C)
(E)
(B)
(D)
(F)
Figure 1. Phenotype characteristics of chickens in the mating program to produce Thai broiler. (A) Kaen Thong. (B) Khai Mook Esarn.
(C) Soi Nin. (D) Soi Pet dam line. (E) Thai broiler male. (F) Thai broiler female.
chickens. One mL of each individual blood sample was
stored in a micro tube containing 100 µL of 0.5M
ethylenediaminetetraacetic acid, as an anti-coagulant.
Genomic DNA was isolated by using Guanidine
Hydrochloride/Silica gel protocol (Goodwin et al., 2007).
The polymerase chain reaction (PCR) was performed in
a 10 µL mixture containing 1 µL genomic DNA (50 ng), 1
µL 10× PCR buffer, 1 µL 2.5 µM of primers for each
candidate gene, 1 µL 1 mM of dNTP (Thermo scientific,
Waltham, MA, USA), 0.8 µL 25 mM MgCl2, and 0.1 µL 5U
Taq DNA polymerase (RBC Bioscience, New Taipei,
Taiwan). The primer characteristics of IGF-I (Zhou et al.,
2005) and cGH (Nie et al., 2005) are shown in Table 3.
PCR amplification was conducted under the following
conditions: 95°C for five minutes, followed by 30 to 35
cycles at 95°C for 45 s, 58°C to 68°C for 30 to 45 s, and
72°C for 30 to 45 s; followed by a final extension at 72°C
for five minutes.
Polymorphisms were detected by using the polymerase
chain reaction-restriction fragment length polymorphism
technique. The PCR products were digested in a total
volume of 20µL of solution; containing 3µL of PCR
product, 1 to 2 U of restriction enzymes, buffer, and H2O.
The sample was then incubated at 37°C overnight.
Restriction patterns were visualized by 2% agarose gel
electrophoresis, and stained in GelStar (GelStarInc, New
York, NY, USA). Agarose gels were visualized and
photographed under Gel Documentation System standards
(SYNGENE, Madison, WI, USA).
Statistical analysis
Genotypic and allelic frequencies were calculated at
each locus, as described by previous authors (Falconer and
Mackay, 2001). Genotypes having a frequency lower than
2% were discarded from the analysis. The association of
candidate genes and traits were analyzed with pooled data
Anh et al. (2015) Asian Australas. J. Anim. Sci. 28:1686-1695
Table 1. Descriptive statistics of data used in gene association study in PS×KT and PS×KM populations
Male
Female
Breed/trait
Mean
SD
Min
Max
Mean
SD
Min
PS×KT
n = 53
n = 48
BWa (g)
0
36.02
4.17
25
45
36.19
4.35
28
2
206.60
50.04
120
310
220.42
45.85
130
4
721.51
105.75
460
950
683.54
97.90
420
6
1,287.55
238.29
820
1670
1,185.00
152.59
820
8
1,830.19
309.58
1,220
2,410
1,615.63
224.57
1,180
10
2,488.20
356.26
1,820
3,270
2,078.72
260.27
1,300
ADGb (g/d)
0-2
12.18
3.61
5.64
19.64
13.16
3.32
6.86
2-4
36.78
4.77
22.86
45.71
33.08
4.38
20.71
4-6
40.43
12.13
12.14
58.57
35.82
6.77
12.14
6-8
38.76
14.92
6.43
59.29
30.76
10.84
7.86
8-10
46.46
11.41
15.00
65.00
33.18
7.95
8.57
0-6
29.80
5.69
18.69
39.02
27.35
3.62
18.71
0-8
32.04
5.52
21.16
42.41
28.20
4.00
20.38
0-10
35.03
5.08
25.50
46.16
29.18
3.71
18.01
PS×KM
n = 50
n = 54
BW (g)
0
36.68
2.93
29
43
37.02
3.85
30
2
251.20
38.58
150
330
249.44
39.64
90
4
799.00
93.62
490
960
718.52
78.61
320
6
1,576.40
179.00
1,000
2,000
1,343.89
108.41
900
8
2,147.60
260.76
1,310
2,660
1,778.52
146.22
1,450
10
2,677.69
288.48
1,730
3,220
2,217.92
203.61
1,780
ADG (g/d)
0-2
15.32
2.77
8.07
20.86
15.17
2.85
3.79
2-4
39.13
5.43
13.57
47.86
33.51
3.50
16.43
4-6
55.53
7.16
36.43
75.71
44.67
4.40
34.29
6-8
40.80
11.99
5.00
63.57
31.04
9.02
2.14
8-10
39.91
10.46
15.71
60.71
31.48
10.69
5.71
0-6
36.66
4.27
22.88
46.81
31.12
2.58
20.55
0-8
37.70
4.65
22.70
46.89
31.10
2.60
25.27
0-10
37.73
4.11
24.16
45.51
31.16
2.90
24.86
1689
Max
46
310
870
1,460
1,300
2,560
19.57
42.86
51.43
44.29
48.57
33.90
35.13
36.10
46
330
890
1,600
2,040
3,000
20.29
40.00
58.57
46.43
87.86
37.00
35.77
42.37
PS, broiler breeder sire; KT, Kaen Thong; KM, Khai Mook Esarn dam line; SD, standard deviation; BW, body weight (at hatching, 2, 4, 6, 8, and 10
weeks of age); ADG, average daily gain (during 0 to 2, 2 to 4, 4 to 6, 6 to 8, 8 to 10, 0 to 6, 0 to 8, and 0 to 10 weeks of age).
of four hybrids and adjusted line effect as fixed effect using
the model below:
following model:
yijk = μ+Gi+Sj+Hk+eijk
yijkl = μ+Gi+Sj+Hk+Cl+Cl×Gi+eijkl
Where yijk is trait observation (BW and ADG), μ is
overall population mean, Gi is the fixed effect of the
genotype, Sj is the fixed effect of the sex, Hk is the fixed
effect of the hatching, Cl is different hybrid cross effect,
Cl×Gi is interaction effect between studied breed and gene,
and eijk is the residual random error.
The association of candidate genes and traits were also
analyzed separately for each hybrid cross using the
Where yijk, μ, Gi, Sj, Hk, and eijk were described above.
For carcass traits, according to the small number of
samples, the association between candidate genes and traits
were analyzed with pooled data from all hybrid cross, using
the model as follow:
yijkl = μ+Gi+Sj+Hk+Cl+eijkl
Where yijkl is a trait observation (carcass percentage), μ,
1690
Anh et al. (2015) Asian Australas. J. Anim. Sci. 28:1686-1695
Table 2. Descriptive statistics of data used in gene association study in PS×SN and PS×SP populations
Male
Female
Breed/trait
Mean
SD
Min
Max
Mean
SD
Min
PS×SN
n = 50
n = 54
BWa (g)
0
33.90
2.87
27
40
34.15
3.39
27
2
230.61
43.18
140
310
236.67
38.85
120
4
721.40
79.02
540
870
673.15
64.16
530
6
1,406.20
151.92
1,100
1,720
1,246.48
106.19
1,020
8
2,024.60
190.08
1,510
2,410
1,748.52
159.02
1,400
10
2,544.90
217.18
2,000
3,120
2,131.35
239.84
1,440
ADGb (g/d)
0-2
14.05
3.13
7.79
19.86
14.47
2.82
5.71
2-4
35.23
3.09
27.14
42.14
31.18
2.77
25.71
4-6
48.91
7.07
32.86
60.71
40.95
4.49
32.14
6-8
44.17
7.57
25.00
56.43
35.86
5.91
22.14
8-10
37.04
10.45
16.43
60.71
27.43
9.52
2.86
0-6
32.67
3.62
25.38
40.14
28.87
2.53
23.40
0-8
35.55
3.40
26.36
42.45
30.61
2.84
24.46
0-10
35.87
3.11
28.10
44.10
29.96
3.42
20.14
PS×SP
n = 41
n = 58
BW (g)
0
35.32
3.30
29
42
34.41
2.97
28
2
221.71
41.35
150
310
218.62
38.95
150
4
722.68
105.38
510
930
656.72
68.48
450
6
1,375.85
213.18
750
1,730
1,187.59
129.09
840
8
1,875.12
300.51
790
2,390
1,631.21
169.55
1,340
10
2,491.84
314.71
1,500
3,050
2,076.43
199.33
1,800
ADG (g/d)
0-2
13.31
3.00
8.07
19.64
13.16
2.84
7.93
2-4
35.78
5.37
25.00
46.43
31.29
3.44
20.71
4-6
46.66
10.90
17.14
64.29
37.92
7.05
15.00
6-8
35.66
13.45
2.14
55.71
31.69
9.50
11.43
8-10
41.69
13.65
2.14
65.00
31.85
7.05
14.29
0-6
31.92
5.08
17.00
40.26
27.46
3.08
19.21
0-8
32.85
5.38
13.46
42.14
28.51
3.03
23.27
0-10
35.09
4.50
20.84
43.01
29.17
2.84
25.29
Max
41
310
780
1,450
2,110
2,700
19.86
36.43
51.43
49.29
56.43
33.76
37.09
38.01
41
310
830
1,480
2,180
2,690
19.50
40.00
50.00
59.29
50.00
34.48
38.36
37.89
PS, broiler breeder sire; SN, Soi Nin; SP, Soi Pet dam line; SD, standard deviation; BW, body weight (at hatching, 2, 4, 6, 8, and 10 weeks of age); ADG,
average daily gain (during 0 to 2, 2 to 4, 4 to 6, 6 to 8, 8 to 10, 0 to 6, 0 to 8, and 0 to 10 weeks of age).
Gi, Sj, Hk, Cl were described in previous model.
four Thai broiler lines, as listed in Table 4. For the cGH
gene, allele G is predominantly higher than allele A, in all
four chicken populations. However, the AA genotype was
RESULTS AND DISCUSSION
counted with a frequency of 0.05 in the observations of
Genotype and allele frequencies of cGH and IGF-I genes PS×KM, and PS×SN populations. The AA genotype
Genotype and allele frequencies of cGH and IGF-I showed the lowest frequency (0.01) in the PS×SP
genes were calculated after genotyping the populations of population compared with the three other lines. For the
Table 3. Details of single nucleotide polymorphism markers and primers
Gene
Primer (forward/reverse)
AT (°C)
cGH
5’-TCCCAGGCTGCGTTTTGTTACTC-3’
65
5’-ACGGGGGTGAGCCAGGACTG-3’
IGF-I
5’-TCAAGAGAAGCCCTTCAAGC-3’
60
5’-CATTGCGCAGGCTCTATCTG-3’
SNPs/site
PCRproduct (bp)
G>A/
429
1705 intron 3
A>C/
813
Promoter and 5’UTR
Enzyme
EcoRV
HinfI
AT, annealing temperature; SNP, single nucleotide polymorphism; PCR, polymerase chain reaction; cGH, chicken growth hormone gene; IGF-I, insulinlike growth factor-I gene.
Anh et al. (2015) Asian Australas. J. Anim. Sci. 28:1686-1695
1691
Table 4. Genotype and allele frequencies of cGH and IGF-I genes
in Thai broilers
Gene/breeds No. Genotype frequencies Allele frequencies
cGH
AA
AG
GG
A
G
PS×KM
104
0.05 0.30 0.65
0.20
0.80
PS×KT
101
0.16 0.46 0.39
0.30
0.61
PS×SN
104
0.05 0.48 0.47
0.29
0.71
PS×SP
99
0.01 0.52 0.47
0.27
0.73
IGF-I
AA
AC
CC
A
C
PS×KM
104
0.42 0.44 0.13
0.64
0.36
PS×KT
101
0.31 0.54 0.15
0.58
0.42
PS×SN
104
0.43 0.42 0.14
0.64
0.36
PS×SP
99
0.15 0.71 0.14
0.51
0.49
and 6 weeks of age; and ADG at 2 to 4 and 0 to 6 weeks of
age. Chicken with AG and GG genotypes showed higher
BW and ADG (p<0.05) compared to that of the AA
genotype. The analysis of the potential association between
the cGH gene polymorphism and growth performance traits
is summarized in Table 6. In the PS×KM hybrid, chickens
with AG and GG genotypes demonstrated higher BW and
ADG (p<0.01) compared to that of the AA genotype.
Significant associations of cGH were found with only BW
at hatching, and ADG 8-10 in PS×KT population (p<0.05).
The cGH genotype effects (p>0.05) were not found in other
hybrids (PS×SP and PS×SN).
Nie et al. (2005) reported that the single nucleotide
cGH, chicken growth hormone gene; IGF-I, insulin-like growth factor-I
polymorphism (SNP) within the same region (G1705A)
gene; PS, broiler breeder sire; KM, KhaiMookEsarn; KT, Kaen Thong;
maintained a significant association with almost all growth
SN, Soi Nin; SP, Soi Pet dam line.
traits, in an F2 reciprocal cross between the WRR and X
IGF-I gene, the CC genotype was observed in all Chinese chicken breeds. The allele A in the study by Nie et
populations with lower frequencies (0.13 to 0.15) compared al. (2005) showed a positive effect on growth traits.
However, our study concluded that allele G exhibited a
to that of the other genotypes.
generally positive effect on chicken growth and was
Association of cGH and IGF-I gene polymorphisms with completely dominant in all breeds (AG and GG having
similar effects). These results confirm those found in the
growth traits
The analysis of association between the cGH and IGF-I previous study of Thai native chickens (Chee), which
gene polymorphisms and growth performance traits across revealed that all growth traits, including body weight and
all of four Thai chicken lines is shown in Table 5. A ADG, from 0 to 16 weeks of age; were significantly higher
significant interaction between breed and gene was not in the GG genotypes (Promwatee and Duangjinda, 2010).
The results of this study indicate that the cGH gene is
found in almost all observed traits (p<0.05); except body
weight at 4 and ADG at 2 to 4 weeks of age (p<0.05). The associated with body weight and ADG in almost all
association of cGH gene was found in body weight trait at 4 recorded periods, within the PS×KM population. In this
Table 5. Least square means of cGH and IGF-I genes on growth traits in Thai broilers across all chicken populations
cGH
IGF-I
Growth traits
AA
AG
GG
AA
AC
CC
SEM
(n = 27)
(n = 178)
(n = 203)
(n =135)
(n = 215)
(n = 58)
BW (g)
0
37.1
36.4
35.8
0.5
36.7
36.0
36.1
2
204.8
213.2
213.8
5.4
219.8a
210.4b
208.6b
4
639.3b
696.0a
700.1a
12.5
704.4
691.0
696.1
b
a
a
6
1,161.0
1,268.3
1,268.9
23.2
1,276.2
1,265.3
1,239.6
8
1,689.7
1,782.2
1,788.2
35.0
1,794.7
1,782.5
1,785.5
10
2,194.4
2,296.4
2,325.9
42.4
2,298.4
2,304.6
2,303.0
ADG (g/d)
0-2
12.0
12.6
12.7
0.4
13.1a
12.5b
12.3b
B
A
A
2-4
31.1
34.5
34.7
0.6
34.6
34.4
34.8
4-6
37.3
40.9
40.6
1.1
40.8ab
41.0a
38.8b
6-8
37.8
36.7
37.1
1.7
37.0
36.9
39.0
8-10
35.5
36.6
37.7
1.6
36.0
36.7
37.4
0-6
26.8b
29.3a
29.4a
0.5
29.5
28.3
28.7
0-8
29.5
31.2
31.3
0.6
31.4
31.2
31.2
0-10
30.8
32.3
32.7
0.6
32.3
32.4
32.4
SEM
0.3
3.6
8.5
15.8
23.8
29.4
0.3
0.4
0.7
1.2
1.1
0.4
0.4
0.4
cGH, chicken growth hormone gene; IGF-I, insulin-like growth factor-I gene; SEM, standard error of the mean; BW, body weight (at hatching 2, 4, 6, 8,
and 10 weeks of age); ADG, average daily gain (during 0 to 2, 2 to 4, 4 to 6, 6 to 8, 8 to 10, 0 to 6, 0 to 8, and 0 to 10 weeks of age).
A, B
Means within a row without common superscript capital letters differ significantly (p<0.01).
a,b
Means within a row without common superscript lowercases differ significantly (p<0.05).
1692
Anh et al. (2015) Asian Australas. J. Anim. Sci. 28:1686-1695
Table 6. Least square means of cGH gene on growth performance in Thai broiler populations
Growth performance traits
Breed/genotype
BW (g)
ADG (g/d)
0
2
4
6
8
10
0-2
2-4
4-6
6-8
8-10
0-6
0-8
PS×KM
AA (n = 5)
38.4 228.0 626.8B 1,228.9B 1,689.8B 2,162.0b
13.5 28.5B 43.0B 32.9 32.7 28.3B 29.5b
A
A
A
a
AG (n = 31)
37.9 237.5 732.7 1,438.9 1,940.2 2,427.4
14.3 35.4A 50.4A 35.8 35.6 33.4A 34.0a
A
A
A
a
GG (n = 68)
38.2 237.6 752.2 1,453.1 1,987.3 2,472.8
14.2 36.8A 50.1A 38.2 35.7 33.7A 34.8a
SEM
0.8
9.9
21.5
36.8
54.9
71.0
0.7
1.1
1.5
2.8
3.2
0.9
1.0
PS×KT
AA (n = 16)
37.9a 209.4 674.9 1,170.0 1,723.0 2,258.4
12.2 33.3 35.4 39.3 38.2b 27.0 30.1
a
AG (n = 46)
37.3
203.4 689.4 1,182.5 1,670.6 2,201.8
11.9 34.7 35.2 34.8 37.8b 27.3 29.2
GG (n = 39)
34.9b 206.9 705.0 1,202.8 1,666.5 2,295.3
12.3 35.6 35.6 33.8 44.3a 27.8 29.1
SEM
0.7
7.8
18.4
34.0
52.9
61.7
0.5
0.9
1.7
2.5
2.0
0.8
0.9
PS×SN
AA (n = 5)
35.0 232.3 703.3 1,311.4 1,844.2 2,337.5
14.1 33.8 43.4 38.1 35.2 30.4 32.3
AG (n = 50)
33.7 229.6 701.0 1,320.5 1,899.1 2,366.5
14.0 33.8 44.3 41.3 33.3 30.6 33.3
GG (n = 49)
34.1 232.5 692.9 1,314.7 1,869.1 2,326.5
14.2 32.9 44.4 39.6 32.8 30.5 32.8
SEM
0.7
7.3
15.5
30.9
43.2
62.1
0.5
0.7
1.5
1.8
2.5
0.7
0.8
PS×SP
AG (n = 51)
35.0 216.9 701.5 1,264.2 1,762.6 2,287.9
13.0 34.6 40.2 35.6 37.3 29.3 30.9
GG (n = 47)
34.6 212.5 682.7 1,229.5 1,725.0 2,270.0
12.7 33.6 39.1 35.4 36.3 28.4 30.2
SEM
0.5
4.9
13.6
25.6
39.5
47.2
0.3
0.7
1.2
1.9
1.8
0.6
0.7
0-10
30.3b
34.1a
34.8a
1.0
31.7
30.9
32.3
0.9
32.9
33.3
32.8
0.9
32.2
31.9
0.70
BW, body weight (at hatching 2, 4, 6, 8, and 10 weeks of age); ADG, average daily gain (during 0 to 2, 2 to 4, 4 to 6, 6 to 8, 8 to 10, 0 to 6, 0 to 8, and 0
to 10 weeks of age); PS, broiler breeder sire; KM, Khai Mook Esarn; SEM, standard error of the mean; KT, Kaen Thong; SN, Soi Nin; SP, Soi Pet dam
line.
A, B
Means within a column without common superscript capital letters differ significantly (p<0.01).
a, b
Means within a column without common superscript lowercases differ significantly (p<0.05).
regard, the G1705A in intron 3 of cGH could have a direct
effect on chicken growth performance by mediating cGH
expression. Previous studies on other polymorphism in
introns of the cGH gene also pointed out the association
between chicken growth and carcass traits (Yan et al., 2003;
Mehdi and Reza, 2012; Mu’in and Lumatauw, 2013). Hence,
the cGH gene could be a potential marker for use in a
marker-assisted selection programs. Further study of the
associations between cGH and growth traits will be required
to obtain more accurate results.
For IGF-I gene when the data was analyzed across all
chicken populations (Table 5), the interaction between
breed and gene was significant only at ADG during 0 to 2
weeks of age (p<0.05). There were significant associations
of IGF-I gene with BW at 2 weeks of age; and with ADG at
0 to 2 and 4 to 6 weeks of age. Chickens with AA genotype
showed higher body weight and ADG; except ADG during
4 to 6 weeks, while the AC genotype showed a higher result.
The effects of polymorphism of the IGF-I gene on growth
traits in Thai broilers is presented in Table 7. It was found
that the IGF-I gene polymorphisms showed significant
associations with only early periods of chicken growth in
each of the four hybrid chickens (p<0.05). The IGF-I gene
was chosen as a candidate gene to examine the associations
of gene polymorphism in growth traits, within commercial
broilers (Zhou et al., 2005; Kaya and Yıldız, 2008),
synthetic breeds (Promwatee et al., 2013), and Thai native
chickens (Chee) (Promwatee and Duangjinda, 2010).
However, the association with the same region of IGF1SNP1 in two chicken strains of the Black Penedesenca
breed, showed only the association with ADG at 107d
within a single strain (Amills et al., 2003). The results of
this study indicate that the IGF-I gene had an effect on body
weight and ADG in the early ages of all four hybrid crosses.
However, the genotype effects were not clear. Therefore,
this gene was regarded as still unsuitable for use as a
marker for parental selection.
The SNP variation in terms of allele substation effect
against total genetic effect of cGH and IGF-I gene on
growth performance traits across all chicken populations
also was calculated and showed in Table 8. It was found
allele A of cGH has negative effects for BW at most of ages
from week 2 to 10. Chicken with AA had the lowest BW
compared to other genotypes. The allele substitution effects
are not clear for IGF-I.
Association of cGH and IGF-I gene polymorphisms with
carcass traits
The probability values of the main effects of the cGH
and IGF-I gene polymorphisms on chicken carcass traits are
1693
Anh et al. (2015) Asian Australas. J. Anim. Sci. 28:1686-1695
Table 7. Least square means of IGF-I gene on growth performance in Thai broiler populations
Growth performance traits
Breeds/
BW (g)
genotype
0
2
4
6
8
10
0-2
2-4
4-6
PS×KM
AA (n = 44)
38.5 247.2a 711.6 1,376.8 1,870.2 2,383.3
14.9a 33.2 47.5
ab
AC (n = 46)
37.6 235.8 705.3 1,362.2 1,869.8 2,341.1
14.2ab 33.5 46.9
b
CC (n = 14)
38.4 220.1 694.8 1,382.0 1,877.2 2,337.7
13.0b 33.9 49.1
SEM
0.7
8.9
19.4
33.3
49.6
64.7
0.6
1.0
1.4
PS×KT
AA (n = 31)
37.4 210.4 697.5 1,207.9ab 1,673.2 2,230.8
12.4 34.8 36.5ab
AC (n = 55)
36.6 206.2 692.7 1,227.5a 1,729.5 2,290.7
12.1 34.8 38.2a
CC (n = 15)
36.2 203.0 679.0 1,120.0b 1,657.4 2,234.0
11.9 34.0 31.5b
SEM
0.7
7.8
18.6
34.3
53.4
62.2
0.5
0.9
1.7
PS×SN
AA (n = 45)
35.5a 229.0ab 692.7ab 1,320.0 1,881.3 2,329.3
13.8ab 33.1 44.8
b
b
b
AC (n = 44)
34.0 222.9 682.0
307.0 1,839.8 2,322.9
13.5b 33.0 44.6
b
a
a
CC (n = 15)
33.4 242.6 722.5 1,319.5 1,891.3 2,378.3
14.9a 34.3 42.6
SEM
0.7
6.6
14.0
28.0
39.0
56.5
0.5
0.7
1.4
PS×SP
AA (n = 15)
34.5 255.8a 698.3 1,253.9 1,736.7 2,229.0
13.7a 39.7 34.5
ab
AC (n = 70)
35.2 213.6 683.5 1,257.0 1,733.2 2,279.2
12.7ab 41.0 34.0
b
CC (n = 14)
34.7 204.8 694.5 1,229.6 1,761.6 2,328.6
12.1b 38.2 38.0
SEM
0.6
6.2
17.3
32.5
50.1
53.3
0.4
1.6
2.5
ADG (g/d)
6-8
8-10
0-6
0-8
0-10
35.2
36.3
35.4
2.6
36.9
33.8
33.3
2.9
31.9
31.5
32.0
0.8
32.7
32.7
32.8
0.9
33.5
32.9
32.8
0.9
33.1
36.5
38.3
2.6
39.4
39.9
41.1
2.0
27.9ab
28.4a
25.8b
0.8
29.2
30.2
29.0
0.9
31.3
32.2
31.4
0.9
40.1
38.1
40.8
1.6
32.2
34.4
34.7
2.3
30.6
30.3
30.6
0.7
33.0
32.2
33.2
0.7
32.8
32.7
33.5
0.8
33.7
37.3
39.4
4.6
33.4
37.0
39.1
2.3
29.0
29.1
28.5
0.8
30.4
30.3
30.8
0.9
31.4
32.1
32.8
0.8
BW, body weight (at hatching 2, 4, 6, 8, and 10 weeks of age); ADG, average daily gain (during 0 to 2, 2 to 4, 4 to 6, 6 to 8, 8 to 10, 0 to 6, 0 to 8, and 0
to 10 weeks of age); PS, broiler breeder sire; KM, Khai Mook Esarn; SEM, standard error of the mean; KT, Kaen Thong; SN, Soi Nin; SP, Soi Pet dam
line.
a,b
Means within a column without common superscript lowercases differ significantly (p<0.05).
Table 8. The single nucleotide polymorphism variation in terms of allele substitution effect against total genetic effect of cGH and IGF-I
genes on growth traits across all chicken populations
Growth traits
BW (g)
0
2
4
6
8
10
ADG (g/d)
0-2
2-4
4-6
6-8
8-10
0-6
0-8
0-10
AA
(n = 27)
cGH
AG
(n = 178)
GG
(n = 203)
AA
(n = 135)
IGF-I
AC
(n = 215)
CC
(n = 58)
0.27
–24.73
–72.93
–124.51
–109.69
–117.46
0.01
14.45
45.62
81.15
66.18
62.17
–0.28
10.29
27.31
43.37
43.52
55.30
–0.39
11.44
8.41
8.31
4.62
–41.29
0.37
–1.37
–10.25
7.11
–21.48
–4.22
0.02
–10.06
1.83
–15.41
16.86
45.52
–1.79
–3.42
–3.68
1.06
–0.36
–2.97
–1.97
–1.68
1.03
2.21
2.54
–1.07
0.67
1.93
1.18
0.89
0.75
1.21
1.15
0.01
–0.32
1.04
0.78
0.79
0.85
–0.21
–0.01
–0.26
–3.03
0.20
0.09
–0.58
–0.12
–0.64
1.24
–2.04
0.49
0.16
–0.39
–0.06
–0.72
0.85
–1.23
2.31
2.54
–0.37
0.30
0.65
cGH, chicken growth hormone gene; IGF-I, insulin-like growth factor-I gene.
BW, body weight (at hatching 2, 4, 6, 8, and 10 weeks of age); ADG, average daily gain (during 0 to 2, 2 to 4, 4 to 6, 6 to 8, 8 to 10, 0 to 6, 0 to 8, and 0
to10 weeks of age).
1694
Anh et al. (2015) Asian Australas. J. Anim. Sci. 28:1686-1695
Table 9. Least square means of cGH and IGF-I genes on carcass traits in Thai broilers
Carcass traits (%)
Gene/genotype
Dressing percentage
Breast muscle
Wing
cGH
AA (n = 2)
70.9
30.0
12.8
AG (n = 11)
69.3
30.2
12.4
GG (n = 19)
70.7
31.1
12.1
SEM
1.0
0.8
0.4
IGF-I
AA (n = 8)
70.4
31.4
12.2
AC (n = 21)
70.6
30.9
12.1
CC (n = 3)
70.0
29.1
13.1
SEM
1.0
0.8
0.4
Drumstick
Thigh
16.1
15.9
15.4
0.5
16.5
17.0
16.8
0.6
15.5
15.7
16.2
0.5
16.7
17.1
16.4
0.6
Dressing percentage: the percentage of carcass weight without visceral organ, head, neck, and shanks, calculated on live weight. The percentage of breast
muscle, wing, drumstick, and thigh calculated on carcass weight without visceral organs, head, neck, and shanks.
cGH, chicken growth hormone gene; SEM, standard error of the mean; IGF-I, insulin-like growth factor-I gene.
shown in Table 9. There was only tentative association
within the four Thai broilers between the cGH and dressing
percentage. A previous study revealed that the AA
homozygote significantly differed from the GG homozygote
in varied carcass traits in a F2 reciprocal cross between the
WRR and X Chinese chicken breeds (Nie et al., 2005).
Similarly, in IGF-I gene polymorphism, there was no
significant association with any carcass traits. Nevertheless,
tentative associations with the breast and wing percentages
were found (p<0.15). Previous study of the same mutation
of IGF-I in Thai synthetic chicken lines reported that a
significant association of IGF-I was found in only dressing
and pectoralis major weight percentages in a single line
(Promwatee et al., 2013). Otherwise, the same region of
IGF-I within our study revealed that there were significant
associations with all observed carcass traits, in F2 Leghorn
and Fayoumi cross chickens; at eight weeks of age (Zhou et
al., 2005). The opposite effect seen in our study may be the
result of chicken samples having been selected at different
ages and of different genetic backgrounds.
CONFLICT OF INTEREST
We certify that there is no conflict of interest with any
financial organization regarding the material discussed in
the manuscript.
ACKNOWLEDGMENTS
The authors gratefully acknowledge the Research and
Development Network Center for Animal Breeding (Native
Chicken), Khon Kaen University for help in managing
chickens and collecting data. The authors are most grateful
to Department of Animal breeding and Genetics, Institute of
Animal Science for Southern, Vietnam and the Vietnam
Ministry of Education and Training, and Vietnam Ministry
of Agriculture and Rural Development for granting the Ms.
C. scholarship and for the research funding. The authors
wish to acknowledge Animal Genomic Laboratory, Faculty
of Agriculture for providing research facilities. This work
was also supported by Higher Education Research
Promotion and National Research University Project of
Thailand, and the Office of the Higher Education
CONCLUSION
Commission, through the Food and Functional Food
This study found some significant effects of cGH and Research Cluster of Khon Kaen University.
IGF-I SNP associated with chicken growth traits. However,
REFERENCES
the effects, though significant, could not generally be used
across breeds. The selected cGH genotypes AG or GG,
Amills, M., N. Jimenez, D. Villalba, M. Tor, E. Molina, D. Cubilo,
suggest breeding KM female with male PS chickens, in
C. Marcos, A. Francesch, A. Sanchez, and J. Estany. 2003.
order to create the PS×KM hybrid, produces a better growth
Identification of three single nucleotide polymorphisms in the
performance and has a greater potential to develop into Thai
chicken insulin-like growth factor 1 and 2 genes and their
broilers. The IGF-I gene polymorphisms did not suggest a
associations with growth and feeding traits. Poult. Sci.
82:1485-1493.
similar potential, as the genotype effects were unclear. In
Apa,
R., A. Lanzone, F. Miceli, M. Mastrandrea, A. Caruso, S.
summary, the cGH gene polymorphisms may be used as
Mancuso, and R. Canipari. 1994. Growth hormone induces in
genetic markers for improving growth traits in breeding
vitro maturation of follicle-and cumulus-enclosed rat oocytes.
programs for commercial hybrid chickens.
Mol. Cell. Endocrinol. 106:207-212.
Ballard, F. J., R. J. Johnson, P. C. Owens, G. L. Francis, F. M.
Anh et al. (2015) Asian Australas. J. Anim. Sci. 28:1686-1695
Upton, J. P. McMurtry, and J. C. Wallace. 1990. Chicken
insulin-like growth factor-I: Amino acid sequence,
radioimmunoassay, and plasma levels between strains and
during growth. Gen. Comp. Endocrinol. 79:459-468.
Beccavin, C., B. Chevalier, L. Cogburn, J. Simon, and M. Duclos.
2001. Insulin-like growth factors and body growth in chickens
divergently selected for high or low growth rate. J. Endocrinol.
168:297-306.
Boschiero, C., E. C. Jorge, K. Ninov, K. Nones, M. F. do Rosário,
L. L. Coutinho, M. C. Ledur, D. W. Burt, and A. S. A. Moura.
2013. Association of IGF1 and KDM5A polymorphisms with
performance, fatness and carcass traits in chickens. J. Appl.
Genet. 54:103-112.
Byatt, J. C., N. R. Staten, W. J. Salsgiver, J. G. Kostelc, and R. J.
Collier. 1993. Stimulation of food intake and weight gain in
mature female rats by bovine prolactin and bovine growth
hormone. Am. J. Physiol. 264:E986-E992.
Denley, A., L. J. Cosgrove, G. W. Booker, J. C. Wallace, and B. E.
Forbes. 2005. Molecular interactions of the IGF system.
Cytokine Growth Factor Rev. 16:421-439.
Falconer, D. S. and T. F. C. Mackay. 2001. Introducción a la
genética cuantitativa. Editorial Acribia, Zaragoza, Spain.
Feng, X. P., U. Kuhnlein, S. E. Aggrey, J. S. Gavora, and D.
Zadworny. 1997. Trait association of genetic markers in the
growth hormone and the growth hormone receptor gene in a
White Leghorn strain. Poult. Sci. 76:1770-1775.
Goodwin, W., A. Linacre, and S. Hadi. 2007. An introduction to
forensic genetics. John Wiley & Sons, Chichester, England.
Hrabia, A., H. E. Paczoska-Eliasiewicz, L. R. Berghman, S.
Harvey, and J. Rząsa. 2008. Expression and localization of
growth hormone and its receptors in the chicken ovary during
sexual maturation. Cell Tissue Res. 332:317-328.
Jaturasitha, S., T. Srikanchai, M. Kreuzer, and M. Wicke. 2008.
Differences in carcass and meat characteristics between
chicken indigenous to northern Thailand (Black-boned and
Thai native) and imported extensive breeds (Bresse and Rhode
Island Red). Poult. Sci. 87:160-169.
Kansaku, N., G. Hiyama, T. Sasanami, and D. Zadworny. 2008.
Prolactin and growth hormone in birds: Protein structure, gene
structure and genetic variation. J. Poult. Sci. 45:1-6.
Kaya, M. and M. A. Yıldız. 2008. Genetic diversity among
Turkish native chickens, Denizli and Gerze, estimated by
microsatellite markers. Biochem. Genet. 46:480-491.
Kita, K. and J. Okumura. 2001. Chicken insulin-like growth
factor-I stimulates protein synthesis of chicken embryo
myoblasts cultured in serum-free medium. Asian Australas. J.
Anim. Sci. 14:17-20.
Mehdi, A. and F. A. Reza. 2012. Single nucleotide Polymorphisms
in intron 1 of growth hormone gene and it’s association with
economic important traits in Iranian Fars native fowl. Ann.
Biol. Res. 3:4028-4032.
View publication stats
1695
Mu’in, M. and S. Lumatauw. 2013. Identification of MspI
polymorphism in the forth intron of chicken growth hormone
gene and their associations with growth traits in Indonesia
native chickens. Anim. Prod. 15:1-7.
Nie, Q., B. Sun, D. Zhang, C. Luo, N. A. Ishag, M. Lei, G. Yang,
and X. Zhang. 2005. High diversity of the chicken growth
hormone gene and effects on growth and carcass traits. J.
Hered. 96:698-703.
Piper, M. M. and T. E. Porter. 1997. Responsiveness of chicken
embryonic somatotropes to somatostatin (SRIF) and IGF-I. J.
Endocrinol. 154:303-310.
Promwatee, N., B. Laopaiboon, T. Vongpralub, Y. Phasuk, S.
Kunhareang, W. Boonkum, and M. Duangjinda. 2013. Insulinlike growth factor I gene polymorphism associated with
growth and carcass traits in Thai synthetic chickens. Genet.
Mol. Res. 12:4332-4341.
Rousseau, K. and S. Dufour. 2007. Comparative aspects of GH
and
metabolic
regulation
in
lower
vertebrates.
Neuroendocrinology 86:165-174.
Scanes, C. G. 2009. Perspectives on the endocrinology of poultry
growth and metabolism. Gen. Comp. Endocrinol. 163:24-32.
Spencer, G. S., J. Buyse, E. Decuypere, and G. Rahimi. 1997.
Physiological inhibition of growth hormone secretion by both
insulin‐like growth factors‐I and‐II in chickens. Br. Poult. Sci.
38:429-431.
Vasilatos-Younken, R., Y. Zhou, X. Wang, J. P. McMurtry, R. W.
Rosebrough, E. Decuypere, N. Buys, V. M. Darras, S. Van Der
Geyten, and F. Tomas. 2000. Altered chicken thyroid hormone
metabolism with chronic GH enhancement in vivo:
consequences for skeletal muscle growth. J. Endocrinol.
166:609-620.
Wattanachant, S., S. Benjakul, and D. A. Ledward. 2004.
Composition, color, and texture of Thai indigenous and broiler
chicken muscles. Poult. Sci. 83:123-128.
Yan, B., X. Deng, Q. Fei, X. Hu, C. Wu, and N. Li. 2003.
Association between single nucleotide polymorphisms of the
chicken growth hormone gene and chicken growth and carcass
traits. Sci. Bull. Sin. 48:1304-1307.
Zhang, C., W. Zhang, H. Luo, W. Yue, M. Gao, and Z. Jia. 2008. A
new single nucleotide polymorphism in the IGF-I gene and its
association with growth traits in the Nanjiang Huang goat.
Asian Australas. J. Anim. Sci. 21:1073-1079.
Zhou, H., A. D. Mitchell, J. P. McMurtry, C. M. Ashwell, and S. J.
Lamont. 2005. Insulin-like growth factor-I gene polymorphism
associations with growth, body composition, skeleton integrity,
and metabolic traits in chickens. Poult. Sci. 84:212-219.