Polymorphism of GrowthCorrelated Genes Associated with Fatness and Muscle Fiber Traits in Chickens
Bạn đang xem bản rút gọn của tài liệu. Xem và tải ngay bản đầy đủ của tài liệu tại đây (232.28 KB, 8 trang )
Polymorphism of Growth-Correlated Genes Associated
with Fatness and Muscle Fiber Traits in Chickens
M. Lei, C. Luo, X. Peng, M. Fang, Q. Nie, D. Zhang, G. Yang, and X. Zhang1
Department of Animal Genetics, Breeding and Reproduction, College of Animal Science,
South China Agricultural University, Guangzhou 510642, Guangdong, China
insulin-like factor-I (IGF-I) gene was significantly linked
with the transversal area of the leg muscle fiber and transversal area of the breast muscle fiber. There was significant linkage between the insulin (INS) gene and 2 traits
of the transversal area of transversal area of the leg muscle
fiber and transversal area of the breast muscle fiber. Association of 30 SNP and one 6-bp indel from 8 genes of
somatotropic axis with chicken fatness and muscle fiber
traits was analyzed in the present study. The GH, GHSR,
and leptin receptor genes were significantly related to
chicken fatness. The INS and IGF-I genes were linked with
muscle fiber density. Therefore, the genes of somatotropic
axis not only affected chicken growth and body composition but also were associated with fatness and muscle
fiber traits.
Key words: fatness, muscle fiber trait, linkage disequilibrium, single nucleotide polymorphism, linkage analysis
2007 Poultry Science 86:835–842
al., 2006). Compared with linkage analyses, candidate
approaches were less widely used.
The genes of somatotropic axis play a central role in
the regulation of growth and development (Mao et al.,
1997; Buyse and Decuypere, 1999; Vasilatos-Younken et
al., 2000). Previous studies showed that variation of these
genes affected gene expression at the transcription and
translation levels (Lo et al., 2003; Wyszynska-Koko et al.,
2006). Variation in the genes of somatotropic axis could
function as candidates for the evaluation of their effects on
chicken growth and development traits. Previous studies
have shown that some single nucleotide polymorphisms
(SNP) of the somatotropic axis genes indeed affected
growth traits significantly (Feng et al., 1997; Kuhnlein et
al., 1997; Amills et al., 2003; Lei et al., 2005; Nie et al.,
2005b; Fang et al., 2006; Qiu et al., 2006). On the other
hand, recent studies have shown that there was significant
association of growth and body composition with meat
quality characteristics (Le Bihan-Duval et al., 2001; Zerehdaran et al., 2004), especially fat deposition and muscle
fiber density and sizes (Bruns et al., 2004; Scheuermann
et al., 2004). In human, mutations in prepoghrelin/ghrelin
gene were associated with obesity (Ukkola et al., 2001).
However, few studies on association of growth-correlated
genes with meat quality have been reported in chickens.
INTRODUCTION
Meat quality is a complex structural and functional
process that depends on species, genetic background,
metabolic status of the antemortem animal, the protein
complement of the muscle, and environmental factors.
Meat quality relies on several important characteristics,
including appearance, color, taste, fat content, texture,
and tenderness. Fatness and muscle fiber traits are the
major components of meat quality. The QTL mapping for
meat quality such as fatness and muscle fiber traits was
widely studied in the past decade (Ovilo et al., 2002; Nii
et al., 2005; Stearns et al., 2005). In chickens, several studies on meat quality QTL mapping were completed with
linkage analyses using microsatellite DNA (Jennen et al.,
2004, 2005; Abasht et al., 2006; Lagarrigue et al., 2006).
Not only linkage analyses with markers were used in
studies on meat quality, but also candidate approaches
were applied (Amills et al., 2005; Guyonnet-Dupe´rat et
©2007 Poultry Science Association Inc.
Received December 4, 2006.
Accepted January 16, 2007.
1
Corresponding author:
835
Downloaded from at National Chung Hsing University Library on April 10, 2014
ABSTRACT Thirty single nucleotide polymorphisms
(SNP) and one 6-bp insertion-deletion (indel) from 8
genes of somatotropic axis were used to study the association with chicken fatness and muscle fibers. The allele
frequency difference between Xinghua and White Plymouth Rock chickens was observed, and their effects on
fatness and muscle fiber traits were also evaluated by
linkage analyses. The G143831A (G+1705A) SNP of the
growth hormone (GH) gene was related to fat width,
and the G144762A (G+119A) SNP of the GH gene was
significantly associated with abdominal fat pad weight,
abdominal fat pad ratio, and crude fatty content of the
breast muscle. The 6-bp indel of the growth hormone
secretagogue receptor (GHSR) gene was significantly
linked with the fat traits. The C51978309T SNP of the
27
Z
9
1
7
5
8
26
GH
GHR
GHSR
IGF-I
IGFBP-2
INS
LEPR
TSH-β
G143831A
G143978A
G142167T
G145086A
A144762G
G6622190A
C6622516T
A6626579G
G18790036A
T18791236C
18792785 to 1879075913
C18793056T
C18793131T
C51978309T
C51983354T
C51978771T
C52028084T
G23967395T
T23966786A
C23966654T
T23966559G
G23966484A
G11303145A
C11304264T
T11306685C
C11306451T
T28573025C
A28573100G
C2541870G
C2543216T
A2543276T
Location2
(nt)
5′-tcccaggctgcgttttgttactc-3′; 5′-acgggggtgagccaggactg-3′
5′-gccctggcagccctgttaacc-3′; 5′-caccccaccatcgtatcccatc-3′
5′-cccaacagtgccacgattccatg-3′; 5′-tgcgcaggtggatgtcgaacttg-3′
5′-atccccaggcaaacatcctc-3; 5′-cctcgacatccagctcacat-3′
5′-atccccaggcaaacatcctc-3; 5′-cctcgacatccagctcacat-3′
5′-cccttccattatgcattttatc-3; 5′-gggggtacactctagtcacttg-3′
5′-gcaacatcagaatcgctttt-3; 5′-tcccatcgtacttgaatatcc-3′
5′-gaacccaggctctcaacagtg-3; 5′-tggaggttgaggtttatctgtc-3′
5′-gtcgcctgcgtcctcctctt-3; 5′-acgggcaggaaaaagaagatg-3′
5′-cccacaaagttagctgcagac-3; 5′-cacctctccatctggctcat-3′
5′-aggtggaaaaactgcaaaaag-3; 5′-aggcaccccataacttttcag-3′
5′-tggttgaaaagagagaatgct-3; 5′-ccacacgtctccttttatattc-3′
5′-tggttgaaaagagagaatgct-3; 5′-ccacacgtctccttttatattc-3′
5′-ctgggctacttgagttactacat-3; 5′-cacggaaaataagggaatg-3′
5′-ctgggctacttgagttactacat-3; 5′-cacggaaaataagggaatg-3′
5′-gccacccgaaagttaaccagaat-3; 5′-tccattgcggctctatct-3′
5′-tgaaagggtctggccaaaaca-3; 5′-gggaagagtgaaaatggcagagg-3′
5′-tttggttgagtcctaggcttg-3; 5′-aggcgtactacactgcagag-3′
5′-accggtctgagagcatccttg-3; 5′-gggaaaaagggtgtgcaaaag-3′
5′-gggcatttatatctgaggaacac-3; 5′-ggcaaagagcaacccaacac-3′
5′-tttgttgtcgtggcttttttcag-3; 5′-gcttgtcacagttggggaag-3′
5′-tttgttgtcgtggcttttttcag-3; 5′-gcttgtcacagttggggaag-3′
5′-cgtgtctcctttgcttcctac-3; 5′-tggagctttctgtgacaattc-3′
5′-tgttctgcatttggcccatac-3; 5′-gcagaatgtcagctttttgtcc-3′
5′-ctccatgtggcttccctgta-3; 5′-ggcttcttggctagttgcagt-3′
5′-ggtatctgaaaagcgggtctc-3; 5′-aatgctttgaaggtgcgatag-3′
5′-atgctgcttgattcttcctcct-3; 5′-ccctaggcaaatggtaatgaac-3′
5′-atgctgcttgattcttcctcct-3; 5′-ccctaggcaaatggtaatgaac-3′
5′-cccttcttcatgatgtctctcc-3; 5′-ggtccttagttccatctgtgc-3′
5′-gagcacggtgagcattactgg-3; 5′-ggaggtacatttctgccacgt-3′
5′-gagcacggtgagcattactgg-3; 5′-ggaggtacatttctgccacgt-3′
Primer
60
60
59
58
57
58
58
56
61
60
58
58
57
58
59
60
59
64
64
60
55
56
58
59
60
61
56
58
60
61
59
Annealing
temperature (°C)
Downloaded from at National Chung Hsing University Library on April 10, 2014
PCR-RFLP
PCR-RFLP
PCR-RFLP
PCR-RFLP
PCR-RFLP
PCR-RFLP
PCR-RFLP
PCR-RFLP
PCR-RFLP
PCR-RFLP
PCR-RFLP
PCR-RFLP
PCR-RFLP
PCR-RFLP
PCR-RFLP
PCR-RFLP
PCR-RFLP
PCR-SSCP
PCR-SSCP
PCR-RFLP
PCR-RFLP
PCR-RFLP
PCR-RFLP
PCR-RFLP
PCR-RFLP
PCR-RFLP
PCR-RFLP
PCR-RFLP
PCR-RFLP
PCR-RFLP
PCR-RFLP
Genotyping
method
Eco72 I
Bsh136 I
Pvu I
Nde I
Msp I
Msp I
Msp I
Bsh136 I
Bsh136 I
Csp6 I
Hin6 I
Msp I
Eco RV
Pag I
Bsh136 I
Msp I
Msp I
Eco72 I
Bsu R
Eco105 I
Msp I
Hin6 I
Csp6 I
Bsp119 I
Hin6 I
Tas I
Bsp119 I
Hinf I
Mph1103
Enzyme
1
GH = growth hormone gene; GHR = growth hormone receptor gene; GHSR = growth hormone secretagogue receptor gene, IGF-I = insulin-like growth factor-I gene; IGFBP-2 = insulin-like
growth factor binding protein-2 gene; INS = insulin gene; LEPR = leptin receptor gene; TSH-β = thyroid-stimulating hormone beta subunit gene; and SSCP = single strand conformational polymorphism.
2
Location on chromosome where gene is found ( (2004).
3
There was one insertion-deletion GGTACA for 18792785 to 187907591 in the chicken GHSR gene.
Chromosome
Gene
Table 1. Details of single nucleotide polymorphism markers, genes, and primers1
836
LEI ET AL.
837
GROWTH-CORRELATED GENES AND CHICKEN FATNESS
Table 2. Single nucleotide polymorphism allele frequencies and the chi-square test
Loci
Allele
XH2
WRR3
F-value
GH
G142167T
G143831A
G143978A
A144762G
G145086A
G6622190A
C6622516T
A6626579G
G18790036A
T18791236C
18792785 to 1879075914
C18793056T
C18793131T
C51978309T
C51983354T
C51978771T
C52028084T
G23967395T
T23966786A
C23966654T
T23966559G
G23966484A
G11303145 A
C11304264T
T11306685C
C11306451T
T28573025C
A28573100G
C2541870G
C2543216T
A2543276T
G
G
G
A
G
G
C
A
G
T
I
C
C
C
C
C
C
G
T
C
T
G
G
C
T
C
T
A
C
C
A
0.53
0.67
0.79
1.00
0.74
1.00
1
0.38
0.93
0.75
0.74
0.92
0.76
0.50
0.88
0.96
0.50
0.74
1.00
0.31
1.00
0.65
1.00
0.65
0.82
0.57
0.58
0.46
0.78
0.79
0.77
0.78
1.00
0.85
0.64
0.57
1.00
1
0.94
1.00
0.53
0.65
0.79
0.60
0.50
0.46
0.78
0.50
0.89
1.00
0.67
1.00
0.79
1.00
0.82
0.86
0.70
1.00
1.00
0.83
0.93
0.78
15.512**
36.000**
17.379**
7.433*
0.130
0.000
0
31.482**
5.373*
10.697**
1.070
4.810
5.560
0.000
32.112**
12.083**
0.000
5.230
0.000
20.355**
0.000
5.130
0.00
8.5895*
0.65
3.21
51.428**
38.297**
2.940
6.923**
16.639**
GHR
GHSR
IGF-I
IGFBP-2
INS
LEPR
TSH-β
1
GH = growth hormone; GHR = growth hormone receptor; GHSR = growth hormone secretagogue receptor;
IGF-I = insulin-like growth factor-I; IGFBP-2 = insulin-like growth factor binding protein-2; INS = insulin; LEPR =
leptin receptor; and TSH-β = thyroid-stimulating hormone beta subunit.
2
XH = Xinghua chickens.
3
WRR = White Plymouth Rock chickens.
4
There was one insertion-deletion GGTACA for 18792785 to 187907591 in the chicken GHSR gene.
*P < 0.05; **P < 0.01.
The purpose of the present study was to observe the
effect of the growth-correlated genes on fatness and muscle fiber traits in chickens. Thirty SNP and one 6-bp indel
were selected from 8 genes of the somatotropic axis, the
growth hormone (GH), growth hormone receptor (GHR),
growth hormone secretagogue receptor (GHSR), insulinlike growth factor-I (IGF-I), insulin-like growth factor
binding protein-2 (IGFBP-2), insulin (INS), leptin receptor (LEPR), and thyroid-stimulating hormone beta subunit (TSH-β). The linkage of the SNP with fatness and
muscle fiber traits was evaluated with linkage analyses
and linkage disequilibria in 2 unrelated populations.
MATERIALS AND METHODS
Chicken Populations and the Observation
of Chicken Fatness and Muscle Fiber Traits
A F2 resource population was constructed by crossing
the White Plymouth Rock chickens (WRR) with Xinghua
chickens (XH; Lei et al., 2005). Nine WRR males were
crossed to 9 XH females, and 6 WRR females were crossed
to 6 XH males, producing 17 F1 families and 454 F2 fullsib individuals (221 males and 233 females). The resource
population was from 6 hatches. Ten fatness and muscle
fiber traits [abdominal fat pad weight (AFW), abdominal
fat pad ratio (AFPR), fat thickness under skin (FTS), fat
width (FW), transversal area of the leg muscle fiber
(TALMF), transversal area of the breast muscle fiber
(TABMF), CP content of the breast muscle (CPCBM), CP
content of the leg muscle (CPCLM), crude fatty content
of the breast muscle (CFCBM), and crude fatty content of
the leg muscle (CFCLM)] were measured.
Two unrelated populations, consisting of 36 XH individuals and 36 WRR individuals, respectively, were sampled for a genetic diversity investigation in the present
study. The XH and WRR were parents of the F2 resource
population, both from Guangdong Wens Foodstuff Corporation Ltd. (Guangdong, China). The XH was a Chinese
native breed with slow growth rate, and WRR was a
breed with fast growth rate. There were significant differences in fatness and muscle traits between the XH and
WRR chickens.
SNP Markers from the 8 Growth-Correlated
Genes and Genotyping
Thirty SNP and one 6-bp indel from the 8 growthcorrelated genes (Table 1) were selected to genotype the
Downloaded from at National Chung Hsing University Library on April 10, 2014
Gene1
838
LEI ET AL.
Table 3. Linkage analyses of 30 single nucleotide polymorphisms and one 6-bp insertion-deletion with chicken fatness and muscle fiber traits
Loci
AFW2
AFPR
FTS
FW
TALMF
TABMF
CPCBM
CPCLM
CFCBM
CFCLM
GH
G142167T
G143831A
G143978A
G145086A
A144762G
G6622190A
A6626579G
G18790036A
T18791236C
18792785 to 1879075913
C18793056T
C18793131T
C51978309T
C51983354T
C51978771T
C52028084T
G23967395T
T23966786A
C23966654T
T23966559G
G23966484A
G11303145A
C11304264T
T11306685C
C11306451T
T28573025C
A28573100G
C2541870G
C2543216T
A2543276T
0.209
0.277
0.789
0.002**
0.524
0.105
0.496
0.275
0.932
0.034*
0.835
0.42
0.354
0.561
0.501
0.91
0.812
0.873
0.33
0.832
0.787
0.672
0.729
0.748
0.707
0.027*
0.137
0.26
0.71
0.513
0.227
0.371
0.71
0.005**
0.318
0.121
0.712
0.189
0.886
0.017*
0.729
0.491
0.521
0.618
0.397
0.814
0.775
0.853
0.323
0.731
0.545
0.536
0.695
0.829
0.532
0.197
0.164
0.235
0.661
0.59
0.023*
0.093
0.783
0.622
0.948
0.861
0.020*
0.801
0.48
0.032*
0.609
0.427
0.521
0.812
0.865
0.781
0.267
0.697
0.448
0.21
0.038*
0.438
0.642
0.315
0.531
0.402
0.618
0.277
0.494
0.589
0.807
0.000**
0.148
0.378
0.67
0.003
0.652
0.000**
0.662
0.482
0.826
0.253
0.7
0.52
0.326
0.751
0.077
0.752
0.437
0.875
0.864
0.524
0.729
0.002**
0.668
0.007**
0.11
0.776
0.326
0.612
0.669
0.898
0.000**
0.068
0.000**
0.322
0.007**
0.853
0.725
0.027*
0.796
0.013*
0.000**
0.249
0.859
0.308
0.74
0.902
0.693
0.808
0.673
0.002**
0.804
0.782
0.835
0.306
0.614
0.832
0.501
0.934
0.574
0.778
0.297
0.788
0.045*
0.458
0.000**
0.058
0.866
0.285
0.44
0.729
0.011*
0.796
0.85
0.758
0.755
0.443
0.068
0.755
0.446
0.016*
0.587
0.881
0.943
0.651
0.669
0.745
0.614
0.895
0.443
0.82
0.594
0.043*
0.085
0.725
0.024*
0.114
0.759
0.773
0.74
0.133
0.698
0.69
0.935
0.396
0.489
0.827
0.71
0.133
0.023*
0.507
0.428
0.851
0.951
0.784
0.778
0.467
0.089
0.549
0.55
0.33
0.547
0.585
0.569
0.994
0.468
0.566
0.951
0.848
0.725
0.717
0.591
0.303
0.707
0.000**
0.623
0.644
0.825
0.033*
0.007**
0.268
0.909
0.834
0.836
0.853
0.531
0.609
0.929
0.725
0.447
0.226
0.757
0.531
0.632
0.504
0.833
0.279
0.603
0.376
0.126
0.125
0.459
0.013*
0.689
0.67
0.457
0.734
0.791
0.757
0.744
0.634
0.786
0.835
0.614
0.461
0.434
0.759
0.236
0.076
0.343
0.205
0.010**
0.32
0.446
0.375
0.000**
0.609
0.308
0.000**
0.763
0.219
0.197
0.94
0.481
0.001**
0.917
0.377
0.935
0.194
0.237
0.581
0.609
0.000**
0.043*
0.582
0.796
0.437
0.515
0.379
GHR
GHSR
IGF-I
IGFBP-2
INS
LEPR
TSH-β
1
GH = growth hormone; GHR = growth hormone receptor; GHSR = growth hormone secretagogue receptor; IGF-I = insulin-like growth factorI; IGFBP-2 = insulin-like growth factor binding protein-2; INS = insulin; LEPR = leptin receptor; and TSH-β = thyroid-stimulating hormone beta
subunit.
2
AFW = abdominal fat pad weight (g); AFPR = abdominal fat pad ratio; FTS = fat thickness under skin (mm); FW fat width = (mm); TALMF =
transversal area of the leg muscle fiber; TABMF = transversal area of the breast muscle fiber; CPCBM = CP content of the breast muscle; CPCLM =
CP content of the leg muscle; CFCBM = crude fatty content of the breast muscle; and CFCLM = crude fatty content of the leg muscle.
3
There was one insertion-deletion GGTACA for 18792785 to 187907591 in the chicken GHSR gene.
*P < 0.05; **P < 0.01.
454 F2, 31 F1, and 30 parental chickens by RFLP and single
strand conformational polymorphism (SSCP).
The PCR was performed in a final volume of 25 L
containing 1 L of genomic DNA (2.5 ng/L), 0.25 L
of each primer (25 M), 0.5 L of deoxynucleotide triphosphates (10 M) mixture, 1.5 L of MgCl2 (25 mM),
0.2 L of DNA polymerase (5 U/L; Takara, Tokyo, Japan), and 2.5 L of 10 × reaction buffer on an ABI 2700
(Applied Biosystems, Foster City, CA) Thermal Cycle
with the following profile: initial denaturation at 94°C for
4 min, 35 cycles of 94°C for 30 s, Y°C for 30 s, 72°C for
30 s, and a final elongation at 72°C for 5 min where Y
refers to a different annealing temperature for each
primer (Table 1). Eight-microliter PCR products were digested with 3.0 U of enzyme at 37°C overnight. Restriction
patterns were visualized in a 2 to 4% agarose gel electrophoresis stained with ethidium bromide. The A23966559T
and G23966484A SNP were genotyped with SSCP by a
12% polyacrylamide gel electrophoresis.
Statistical Analyses
The difference of allele frequencies between the 2 unrelated chicken populations was tested using SAS 8.1 FREQ
(SAS Institute Inc., Cary, NC). The linkage disequilibria
D′ value between each pair of SNP and the haplotype
structure of SNP within each gene were estimated by
Haploview (Daly et al., 2001). Linkage analyses of single
SNP with chicken fatness and muscle fiber traits were
performed with SAGE/SIBPAL package ( (SAGE, 2006).
RESULTS
Allele Frequency in the
Unrelated Populations
Allele frequencies of 30 SNP and one 6-bp indel in
the 2 populations are shown in Table 2. Allele A of the
G18790036A SNP of the GHSR gene, allele A of the
G143831A SNP of the GH gene, allele C of the T28573025C
SNP, and allele G of the A28573100G SNP of the LEPR
gene were all absent in WRR chickens. In the XH and
WRR chickens, allele A of the G11303145A SNP of the
INS gene, allele A of the G6622190A SNP and allele T of
the C6622516T SNP of the GHR gene, and allele A of the
T23966786A SNP and allele G of the T23966559G SNP of
the IGFBP-2 gene were not found.
There was a significant difference for allele frequencies
of C11304264T of the INS gene between the XH and WRR
Downloaded from at National Chung Hsing University Library on April 10, 2014
Gene1
GROWTH-CORRELATED GENES AND CHICKEN FATNESS
839
chickens, but there was no difference for the 18792785 to
187907591 indel, and the C18793056T and C18793131T
SNP of the GHSR gene. Highly significant differences
were found for the C2543216T and A2543276T SNP of
the TSH-β gene and the A6626579G SNP of the GHR gene.
No significant difference was observed in the G143978A
SNP of the GH gene, and C51978309T SNP and the
C52028084T SNP of the IGF-I gene (P > 0.05). A highly
significant difference was found in the C23966654T SNP
of the IGFBP-2 gene (P < 0.01).
Linkage Disequilibria of the SNP
in the 8 Growth-Correlated Genes
Linkage Analyses
Results from the 2-point linkage analyses are shown in
Table 3. There were significant associations of the
G11303145A SNP of the INS gene with TALMF and
TABMF. Positive additive genetic effects were observed
at a highly significant level for the TALMF, and highly
significant negative additive genetic effects were observed for TABMF (Table 4). The A6626579G SNP of the
GHR gene was highly significantly associated with the
fatness and muscle fiber traits (P < 0.01). The G145086A
SNP of the GH gene was related to fatness traits such as
AFW and AFPR. The C51978309T of the IGF-I gene was
related to chicken TALMF and TABMF. The 6-bp indel of
the GHSR gene was significantly associated with fatness
traits such as AFW, AFPR, FTS, and CFCLM. There were
highly significant positive additive effects for the fatness
traits and CFCLM.
DISCUSSION
In the present study, 30 SNP and one 6-bp indel selected
from the 283 SNP in 12 genes of somatotropic axis (Nie
et al., 2005a) were associated with some fatness and muscle fiber traits. Analyses of variance revealed highly sig-
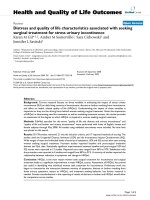
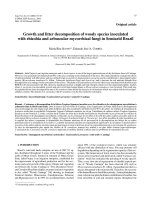
Figure 1. Haplotype structures of the chicken growth hormone (GH)
and insulin-like growth factor binding protein-2 (IGFBP-2) gene, as
estimated by using the Haploview soft package. |D| values × 100 are
shown in the boxes, with empty boxes being 100 (or |D| = 1). A. Haplotype structure of the GH gene. The G143831A SNP deviated from HardyWeinberg equilibrium in White Plymouth Rock (WRR) chickens, but
not in the Xinghua (XH) chickens. B. Haplotype structure of the IGFBP2 gene. The G23966484A SNP was located in different block in the XH
and WRR chickens.
nificant additive genetic effects. In 14 of the 30 SNP and
one 6-bp indel, there were significant differences for allele
frequencies between the XH and WRR chickens. Such
differences suggested that the 14 SNP could be associated
with chicken fatness and muscle fiber traits. Among the
14 SNP, 8 were linked significantly with one or more
chicken fatness and muscle fiber traits. The G142167T and
G143831A SNP of the GH gene and the G18790036A SNP
of the GHSR gene were associated with 1 trait, such as
FTS, FW, and FW, and the C51983354T SNP of the IGFI gene were related with CFCBM. The remaining 4 SNP
Downloaded from at National Chung Hsing University Library on April 10, 2014
To further define the haplotype structures of the 8
growth-correlated genes and multiloci association of each
gene, haplotype blocks were analyzed between the XH
and WRR chickens using the Haploview program. Only
2 SNP were genotyped so that haplotype blocks and
multiloci association were not analyzed for the GHR and
LEPR genes. According to the 4-gamete testing, different
haplotype blocks appeared between the XH and WRR
chickens excluding SNP deviation from Hardy-Weinberg
equilibrium separately within each population, but only
the GH and IGFBP-2 genes were interesting. For the
IGFBP-2 gene, there was 1 main block in the XH chickens,
which showed that no recombination was observed in
the C23966654T and G23967395T SNP (D′ = 1), and a
different block appeared in WRR chickens, which showed
that the G23966484A, C23966654T, and G23967395T SNP
were linked (Figure 1). For the IGF-I gene, the G143831A
deviated from Hardy-Weinberg equilibrium in the WRR
chickens, but not in the XH chickens.
840
LEI ET AL.
Table 4. Gene effects on chicken fatness and muscle fiber traits
A6626579G of GHR2
Trait1
AFW
AFPR
FTS
FW
TALMF
TABMF
CPCBM
CPCLM
CFCBM
CFCLM
Additive
effect ± SE4
−2.20
0.13
0.19
−0.97
−234.10
4,521.60
−0.59
0.16
−0.02
−1.03
±
±
±
±
±
±
±
±
±
±
0.177
0.013
0.015
0.033
75.664
96.305
0.016
0.009
0.006
0.019
18792785 to 187907591 indel3 of GHSR
Dominance
effect ± SE5
8.20
1.56
1.32
−1.69
−481.45
259.60
−0.78
−0.51
0.70
0.58
±
±
±
±
±
±
±
±
±
±
0.026
0.003
0.002
0.004
20.45
22.086
0.004
0.01
0.003
0.007
Additive
effect ± SE
29.70
2.11
4.76
7.66
632.70
−497.50
−0.19
0.18
0.81
3.28
±
±
±
±
±
±
±
±
±
±
0.187
0.013
0.025
0.041
71.354
71.236
0.011
0.01
0.01
0.035
Dominance
effect ± SE
−4.15
−0.29
−1.58
4.82
−495.75
3,368.45
0.71
0.16
0.03
0.50
±
±
±
±
±
±
±
±
±
±
0.018
0.001
0.002
0.005
11.683
15.401
0.002
0.003
0.001
0.002
G11303145A of the INS
Additive
effect ± SE
−5.30
−0.18
−0.98
−5.79
3,498.90
−2,869.40
−0.27
1.36
0.81
2.36
±
±
±
±
±
±
±
±
±
±
1.017
0.071
0.117
0.444
577.448
764.012
0.065
0.175
0.098
0.191
Additive
effect ± SE
10.75
0.18
−0.05
−5.61
1,992.20
3,465.80
0.05
0.09
−0.56
−2.01
±
±
±
±
±
±
±
±
±
±
0.057
0.004
0.005
0.019
41.03
40.698
0.007
0.007
0.006
0.019
were associated with 2 or more traits. The G143978A SNP
of the GH gene was related with TALMF and CFCLM,
and the T28573025C SNP of the LEPR gene was associated
with AFW and FW. The G145086A SNP of the GH gene
was related with AFW, AFPR, and CPCBM. The
A6626579G SNP of the GH gene was associated with FTS,
TALMF, TABMF, CPCBM, and CFCLM. Considering
some associations might be false positives, allele frequency differences partially supported the accuracy of
the association analysis.
It is known that the genes of the growth axis played
crucial roles in the regulation of the growth, development,
and differentiation. There was an important association
of the meat quality and growth and body composition
(Le Bihan-Duval et al., 1998). Therefore, the genes of the
growth axis probably affect the meat quality traits of
the animals. The G143831A (G+1705A) SNP of the GH
gene was significantly associated with growth traits (Nie
et al., 2005b) but was only related with fat width. The
G144762A (G+119A) SNP of the GH gene was significantly related to AFW, AFPR, and CPCBM in the present
study, which showed that there was a positive genetic
correlation with BW and meat quality traits (Le BihanDuval et al., 2001; Nie et al., 2005b). The C51978309T SNP
of the IGF-I gene was linked with TALMF and TABMF,
and the correlation (r) of TALMF and TABMF was 0.65.
As an important candidate gene that affected the chicken
muscle cell development and reproduction, the IGF-I gene
was associated with BW, breast weight, and breast yield
(Amills et al., 2003). Myofiber numbers and myofiber densities were related to BW, breast weight, and breast yield
(Scheuermann et al., 2003, 2004), which suggested that
the C51978309T SNP of the IGF-I gene could affect the
chicken muscle fiber growth. There were different haplotype structures for the IGFBP-2 gene in the XH and WRR
chickens, which showed the G23966484A (G+738A) SNP
of the IGFBP-2 gene was important. In the present study,
the G23966484A SNP of the IGFBP-2 gene was associated
with CPCBM and CPCLM. This SNP, located in the exon
2, possible affected the expression of the IGFBP-2 gene
at the transcription and translation levels (Lo et al., 2003;
Wyszynska-Koko et al., 2006). These results were consistent with previous results that suggested a potential association of the G23966484A SNP of the IGFBP-2 gene with
growth and carcass traits (Besnard et al., 2001; Lei et al.,
2005). In the present study, the T28573025C SNP of the
LEPR gene was significantly associated with AFW and
FW. Schenkel et al. (2005) found that there was important
association of SNP within the leptin gene with fatness
(fat yield and subcutaneous fat). Ovilo et al. (2005) also
showed that the possible QTL was identified on chromosome 8 where the LEPR gene was located. As known,
there was a significant correlation of AFW and FW (r =
0.63). Therefore, association of the T28573025C SNP of
the LEPR gene with fatness possibly was reliable. The
A6626579G SNP of the GHR gene was associated with 5
traits (FTS, TALMF, TABMF, CPCBM, and CFCLM). To
test the accuracy of association of the A6626579G SNP of
the GHR gene with traits, a larger population should
be used.
Recently, some QTL that affected meat quality traits
have been detected in chickens by use of many kinds of
molecular markers. The QTL for AFW were found on
chromosomes 1, 3, 5, 7, 15, and 28 (Ikeobi et al., 2002;
Jennen et al., 2004; Lagarrigue et al., 2006). Some of these
QTL with effect on AFW were located on chromosome
7, which contains the IGFBP-2 gene (Jennen et al., 2004,
2005). Meanwhile, QTL for AFW and percentage abdominal fat on chromosome 1 where the IGF-I gene is located
were found (Suzuki et al., 2004; Jennen et al., 2005). The
QTL affecting fatness in male chickens were mapped to
less than 8 Mbp at the distal part of the chromosome 5,
which was close to the chicken INS gene (Abasht et al.,
2006). All these showed the locations of underlying QTL
Downloaded from at National Chung Hsing University Library on April 10, 2014
1
AFW= abdominal fat pad weight (g); AFPR = abdominal fat pad ratio; FTS = fat thickness under skin (mm); FW fat width = (mm); TALMF =
transversal area of the leg muscle fiber; TABMF = transversal area of the breast muscle fiber; CPCBM = CP content of the breast muscle; CPCLM =
CP content of the leg muscle; CFCBM = crude fatty content of the breast muscle; and CFCLM = crude fatty content of the leg muscle.
2
GHR = growth hormone receptor gene; GHSR = growth hormone secretagogue receptor gene; and INS = insulin gene.
3
There was one insertion-deletion GGTACA for 18792785 to 187907591in the chicken GHSR gene.
4
Estimated by subtracting the solution for the BB genotype from that for the AA genotype, A = A and B = G for the A11303145G SNP, and the
A11303145G SNP of the INS gene, and A = A and B = G for the G6626579A SNP of the GHR gene, and A = I and B = D for the 18792785 to
187907591 indel of the GHSR gene.
5
Estimated by subtracting the average of solutions for homozygous genotypes from that for the heterozygous genotype.
GROWTH-CORRELATED GENES AND CHICKEN FATNESS
ACKNOWLEDGMENTS
The current work was funded by projects under the
Major State Basic Research Development Program China,
project No. 2006CB102100. Danlin He and Zhijun Peng
gave excellent technical assistance in the observations of
chicken fatness and muscle fiber traits.
REFERENCES
Abasht, B., F. Pitel, S. Lagarrigue, E. Le Bihan-Duval, P. Le Roy,
O. Demeure, F. Vignoles, J. Simon, L. Cogburn, S. Aggrey,
A. Vignal, and M. Douaire. 2006. Fatness QTL on chicken
chromosome 5 and interaction with sex. Genet. Sel. Evol.
38:297–231.
Amills, M., N. Jimenez, D. Villalba, M. Tor, E. Molina, D. Cubilo,
C. Marcos, A. Francesch, A. Sanchez, and J. Estany. 2003.
Identification of three single nucleotide polymorphisms in
the chicken insulin–like growth factor 1 and 2 genes and
their associations with growth and feeding traits. Poult. Sci.
82:1485–1493.
Amills, M., O. Vidal, L. Varona, A. Tomas, M. Gil, A. Sanchez,
and J. L. Noguera. 2005. Polymorphism of the pig 2,4–dienoyl
CoA reductase 1 gene (DECR1) and its association with carcass and meat quality traits. J. Anim. Sci. 83:493–498.
Besnard, V., S. Corroyer, G. Trugnan, K. Chadelat, E. Nabeyrat,
V. Cazals, and A. Clement. 2001. Distinct patterns of insulinlike growth factor binding protein (IGFBP)-2 and IGFBP-3
expression in oxidant exposed lung epithelial cells. Biochim.
Biophys. Acta 1538:47–58.
Bruns, K. W., R. H. Pritchard, and D. L. Boggs. 2004. The relationships among body weight, body composition, and intramuscular fat content in steers. J. Anim. Sci. 82:1315–1322.
Buyse, J., and E. Decuypere. 1999. The role of the somatotrophic
axis in the metabolism of the chicken. Domest. Anim. Endocrinol. 17:245–255.
Daly, M. J., J. D. Rioux, S. F. Schaffner, T. J. Hundson, and E.
S. Lander. 2001. High-resolution haplotype structure in the
human genome. Nat. Genet. 29:229–232.
Fang, M., Q. Nie, C. Luo, D. X. Zhang, and X. Q. Zhang. 2006.
An 8 bp indel in exon 1 of ghrelin gene associated with
chicken growth. Domest. Anim. Endocrinol. 32:216–225.
Feng, X. P., U. Kuhnlein, S. E. Aggrey, J. S. Gavora, and D.
Zadworny. 1997. Trait association of genetic markers in the
growth hormone and growth hormone receptor gene in a
White Leghorn strain. Poult. Sci. 76:1770–1775.
Guyonnet-Dupe´rat, V., N. Geverink, G. S. Plastow, G. Evans,
O. Ousova, C. Croisetiere, A. Foury, E. Richard, P. Mormede,
and M. P. Moisan. 2006. Functional implication of an
Arg307Gly substitution in corticosteroid-binding globulin, a
candidate gene for a quantitative trait locus associated with
cortisol variability and obesity in pig. Genetics 173:2143–
2149.
Ikeobi, C. O. N., J. A. Woolliams, D. R. Morrice, A. Law, D.
Windsor, D. W. Burt, and P. M. Hocking. 2002. Quantitative
trait loci affecting fatness in the chicken. Anim. Genet.
33:428–435.
Jennen, D. G., A. L. Vereijken, H. Bovenhuis, R. M. Crooijmans,
J. J. van der Poel, and M. A. Groenen. 2005. Confirmation of
quantitative trait loci affecting fatness in chickens. Genet.
Sel. Evol. 37:215–228.
Jennen, D. G., A. L. Vereijken, H. Bovenhuis, R. M. Crooijmans,
A. Veenendaal, J. J. van der Poel, and M. A. Groenen. 2004.
Detection and localization of quantitative trait loci affecting
fatness in broilers. Poult. Sci. 83:295–301.
Kuhnlein, U., L. Ni, S. Weigend, J. S. Gavora, W. Fairfull, and
D. Zadworny. 1997. DNA polymorphisms in the chicken
growth hormone gene: Response to selection for disease resistance and association with egg production. Anim. Genet.
28:116–123.
Lagarrigue, S., F. Pitel, W. Carre, B. Abasht, P. Le Roy, A. Ne´au,
Y. Amigues, M. Sourdioux, J. Simon, L. A. Cogburn, S. E.
Aggrey, B. Leclercq, A. Vignal, and M. Douaire. 2006. Mapping quantitative trait loci affecting fatness and breast muscle
weight in meat–type chicken lines divergently selected on
abdominal fatness. Genet. Sel. Evol. 38:85–97.
Le Bihan-Duval, E., C. Berri, E. Baeza, N. Millet, and C. Beaumont. 2001. Estimation of the genetic parameters of meat
characteristics and of their genetic correlations with growth
and body composition in an experimental broiler line. Poult.
Sci. 80:839–843.
Le Bihan-Duval, E., S. Mignon–Grasteau, N. Millet, and C. Beaumont. 1998. Genetic analysis of a selection experiment on
increased body weight and breast muscle weight as well as
on limited abdominal fat weight. Br. Poult. Sci. 39:346–353.
Lei, M. M., Q. H. Nie, X. Peng, D. X. Zhang, and X. Q. Zhang.
2005. Single nucleotide polymorphisms of the chicken insulin-like factor binding protein 2 gene associated with chicken
growth and carcass traits. Poult. Sci. 84:1191–1198.
Lo, H. S., Z. Wang, Y. Hu, H. H. Yang, S. Gere, K. H. Buetow,
and M. P. Lee. 2003. Allelic variation in gene expression is
common in the human genome. Genome Res. 13:1855–1862.
Mao, J. N., L. A. Cogburn, and J. Burnside. 1997. Growth hormone down–regulates growth hormone receptor mRNA in
chickens but developmental increases in growth hormone
receptor mRNA occur independently of growth hormone
action. Mol. Cell. Endocrinol. 16:135–143.
Nie, Q., M. Lei, J. Ouyang, H. Zeng, G. Yang, and X. Zhang.
2005a. Identification single nucleotide polymorphisms in 12
chicken growth–correlated performance liquid chromatography. Genet. Sel. Evol. 37:339–360.
Nie, Q., B. Sun, D. Zhang, C. Luo, N. A. Ishag, M. Lei, G. Yang,
and X. Zhang. 2005b. High diversity of the chicken growth
hormone gene and effects on growth and carcass traits. J.
Hered. 96:698–703.
Nii, M., T. Hayashi, S. Mikawa, F. Tani, A. Niki, N. Mori, Y.
Uchida, N. Fujishima–Kanaya, M. Komatsu, and T. Awata.
Downloaded from at National Chung Hsing University Library on April 10, 2014
affecting fatness and muscle fiber traits were often
mapped to, or close to, regions harboring candidate functional genes of somatotropic axis. The candidate genes of
the somatotropic axis may affect chicken fatness deposition and muscle fiber traits.
Linkage disequilibria in the 2 unrelated populations
were analyzed for the 8 genes. Only the GH and IGFBP2 genes appeared as haplotype blocks in the XH and WRR
chickens by using Haploview software package (Daly et
al., 2001). For the other genes, no haplotype blocks were
found in both the XH and WRR chickens and, therefore,
fail to exhibit disequilibrium with fatness and muscle
fiber traits. However, haplotype blocks in the XH and
WRR chickens were consistent with the association.
Meanwhile difference for haplotype blocks in the XH
and WRR chickens suggested that difference of the gene
structures could be present between the XH and WRR
chickens and these could affect gene expression level.
In summary, association of 30 SNP and one 6-bp indel
from 8 genes of somatotropic axis with chicken fatness
and muscle fiber traits was analyzed in the present study.
Three genes, GH, GHSR, and LEPR, were significantly
related to the chicken fatness. Two genes, INS and IGFI, were linked with the muscle fiber density. In conclusion,
the genes of the somatotropic axis not only affected
chicken growth and body compositions but also were
associated with fatness and muscle fiber traits.
841
842
LEI ET AL.
in pectoralis muscle and myostatin ontogeny. Poult. Sci.
83:1404–1412.
Stearns, T. M., J. E. Beever, B. R. Southey, M. Ellis, F. K. McKeith,
and S. L. Rodriguez–Zas. 2005. Evaluation of approaches to
detect quantitative trait loci for growth, carcass, and meat
quality on swine chromosomes 2, 6, 13, and 18. I. Univariate
outbred F2 and sib-pair analyses. J. Anim. Sci. 83:1481–1493.
Suzuki, K., M. Nakagawa, K. Katoh, H. Kadowaki, T. Shibata, H.
Uchida, Y. Obara, and A. Nishida. 2004. Genetic correlation
between serum insulin-like growth factor–1 concentration
and performance and meat quality traits in Duroc pigs. J.
Anim. Sci. 82:994–999.
Ukkola, O., E. Ravussin, P. Jacobs–on, E. E. Snyder, M. Chagnon,
L. Sjostrom, and C. Bouchard. 2001. Mutations in the preproghrelin/ghrelin gene associated with obesity in humans. J.
Clin. Endocrinol. Metab. 86:3996–3999.
Vasilatos-Younken, R., Y. Zhou, X. Wang, J. P. McMurtry, W.
Rosebrough, E. Decuypere, N. Buys, V. M. Darras, V. Geyten,
and F. Tomas. 2000. Altered chicken thyroid hormone metabolism with chronic GH enhancement in vivo: Consequences
for skeletal muscle growth. J. Endocrinol. 66:609–620.
Wyszynska-Koko, J., M. Pierzchala, K. Flisikowski, M. Kamyczek, M. Rozycki, and J. Kury. 2006. Polymorphisms in coding
and regulatory regions of the porcine MYF6 and MYOG
genes and expression of the MYF6 gene in m. longissimus
dorsi versus productive traits in pigs. J. Appl. Genet.
47:131–138.
Zerehdaran, S., A. L. Vereijken, J. A. van Arendonk, and E. H.
van der Waaijt. 2004. Estimation of genetic parameters for
fat deposition and carcass traits in broilers. Poult. Sci.
83:521–525.
Downloaded from at National Chung Hsing University Library on April 10, 2014
2005. Quantitative trait loci mapping for meat quality and
muscle fiber traits in a Japanese wild boar × Large White
intercross. J. Anim. Sci. 83:308–315.
Ovilo, C., A. Crop, J. L. Noguera, M. A. Oliver, L. Barragan, C.
Rodriguez, L. Silio, M. A. Toro, A. Coll, J. M. Folch, A. Sanchez, D. Babot, L. Varona, and M. Perez-Encisco. 2002. Quantitative trait locus mapping for meat quality traits in an Iberian × Landrace F2 pig population. J. Anim. Sci. 80:2801–2808.
Ovilo, C., A. Fernandez, J. L. Noguera, C. Barragan, R. Leton,
C. Rodriguez, A. Mercade, E. Alves, J. M. Folch, L. Varona,
and M. Toro. 2005. Fine mapping of porcine chromosome
6 QTL and LEPR effects on body composition in multiple
generations of an Iberian by Landrace intercross. Genet. Res.
85:57–67.
Qiu, F. F., Q. H. Nie, C. L. Luo, D. X. Zhang, S. M. Lin, and X.
Q. Zhang. 2006. Association of single nucleotide polymorphisms of the insulin gene with chicken early growth and
fat deposition. Poult. Sci. 85:980–985.
SAGE. 2006. Statistical Analysis for Genetic Epidemiology, Release 5.2. Accessed Aug. 2006.
Schenkel, F. S., S. P. Miller, X. Ye, S. S. Moore, J. D. Nkrumah,
C. Li, J. Yu, I. B. Mandell, J. W. Wilton, and J. L. Williams.
2005. Association of single nucleotide polymorphisms in the
leptin gene with carcass and meat quality traits of beef cattle.
J. Anim. Sci. 83:2009–2020.
Scheuermann, G. N., S. F. Bilgili, J. B. Hess, and D. R. Mulvaney.
2003. Breast muscle development in commercial broiler
chickens. Poult. Sci. 82:1648–1658.
Scheuermann, G. N., S. F. Bilgili, S. Tuzun, and D. R. Mulvaney.
2004. Comparison of chicken genotypes: Myofiber number