Evaluation of recent Protein A stationary phase innovations for capture of biotherapeutics
Bạn đang xem bản rút gọn của tài liệu. Xem và tải ngay bản đầy đủ của tài liệu tại đây (3.63 MB, 16 trang )
Journal of Chromatography A, 1554 (2018) 45–60
Contents lists available at ScienceDirect
Journal of Chromatography A
journal homepage: www.elsevier.com/locate/chroma
Evaluation of recent Protein A stationary phase innovations for
capture of biotherapeutics
Timothy M. Pabst ∗ , Johnny Thai, Alan K. Hunter
MedImmune, Purification Process Sciences, One MedImmune Way, Gaithersburg, MD 20878, USA
a r t i c l e
i n f o
Article history:
Received 21 December 2017
Received in revised form 26 March 2018
Accepted 29 March 2018
Available online 7 April 2018
Keywords:
Protein A
Antibody
Affinity chromatography
Dynamic binding capacity
Bioprocessing
a b s t r a c t
We describe a comprehensive evaluation of 12 Protein A stationary phases for capture of biotherapeutics.
We first examine the morphological properties of the stationary phases using a variety of orthogonal
techniques including electron microscopy, particle sizing, pressure-flow behavior, and isocratic pulse
response. A panel of nine proteins spanning a wide range of structures and biochemical properties was
then used to assess equilibrium uptake, mass transport, dynamic binding capacity, and elution pH. Process
performance and product quality were also examined under realistic bioprocess conditions using clarified
mammalian cell culture broth. Equilibrium isotherms were found to be highly favorable, with equilibrium
binding capacity for monoclonal and bispecific antibodies ranging from 47–100 mg/mL packed bed across
all stationary phases tested. Effective pore diffusivities, De , were obtained by fitting the chromatography
general rate model to breakthrough data. The fitted De values for monoclonal antibodies ranged from
1.1–5.7 × 10⁻⁸ cm2 /s. The stationary phases had high dynamic binding capacities for the model proteins.
The highest dynamic capacities for monoclonal and bispecific antibodies were seen with MabSelect SuRe
pcc and MabSelect PrismA, which ranged from 58–74 mg/mL packed bed at 4 min residence times. Product
capture using clarified cell culture broth as a feedstock showed high yields and elution pool volumes that
ranged from 2–3 column volumes in most cases. Host cell protein, DNA, and aggregate levels in the elution
pool were dependent on the specific nature of protein being purified, and levels were consistent between
stationary phases. Lastly, we perform an analysis of bivariate correlations and discuss considerations for
process design and optimization.
© 2018 MedImmune. Published by Elsevier B.V. This is an open access article under the CC BY-NC-ND
license ( />
1. Introduction
Monoclonal antibodies (mAbs) continue to be the most prevalent class of approved biotherapeutics [1]. In addition, the use of
Fc-fusion proteins and mAb-like molecules, such as bispecific antibodies and antibody-drug conjugates (ADCs), continues to increase
[2–4]. Since the first mAb was approved in the 1980s, Protein A
has become the most widely used capture step for Fc-containing
molecules due to its highly specific nature, ease of use, and strong
regulatory track record. For these purification processes, Protein A
chromatography is routinely utilized as part of a platform approach
where it is placed first in the purification train to capture product
from clarified cell culture broth [5–13]. This configuration allows
for robust processing of similar molecules. Even with these advantages, there have been efforts to identify alternatives to Protein
∗ Corresponding author.
E-mail address: (T.M. Pabst).
A, such as cation exchange or multimodal capture chromatography, to overcome the burden of high stationary phase costs
[14–19]; however, these techniques may not be as selective and
may lack the ability to be employed as part of a platform approach.
There has also been interest in non-chromatographic techniques,
such as precipitation [20–22] and aqueous two-phase extraction
[23–25], but these strategies have not gained widespread use for
industrial-scale bioprocessing. Thus, it seems unlikely that Protein
A chromatography will be superseded as the dominant platform
approach for antibody and Fc-fusion protein purification in the
foreseeable future, and its use is likely to continue to increase with
the growth in the market [26].
Staphylococcal Protein A is a 42 kDa single chain polypeptide
located on the outer surface of Staphylococcus aureus [27–30]. Early
Protein A affinity stationary phases consisted of native Protein
A coupled to a base matrix most often through covalent bonding to amines. Since then, dramatic improvements have been
made in Protein A chromatography stationary phases, most notably
increased stability under alkaline conditions realized through point
/>0021-9673/© 2018 MedImmune. Published by Elsevier B.V. This is an open access article under the CC BY-NC-ND license ( />0/).
46
T.M. Pabst et al. / J. Chromatogr. A 1554 (2018) 45–60
Nomenclature
c
C
CF
cp
CCCB
CV
dp
Dax
De
Dp
D0
DBC
EBC
K
kf
KD
L
M
q
qd
qm
r
rp
rpore
rs
t
S
u
v
VR
V10%
z
interstitial protein concentration (mg/mL)
protein concentration in solution (mg/mL)
column protein feed concentration (mg/mL)
protein concentration in the pore fluid (mg/mL)
clarified cell culture broth
column volume (mL)
volume mean particle diameter (m)
axial dispersion coefficient (cm2 /s)
effective pore diffusivity, = εp Dp (cm2 /s)
pore diffusivity (cm2 /s)
free solution diffusivity (cm2 /s)
dynamic binding capacity (mg/mL)
equilibrium binding capacity (mg/mL)
adsorption constant in Langmuir isotherm model
(mL/mg)
film mass transfer coefficient (cm/s)
distribution coefficient, = VR /CV − εb / (1 − εb )
bed height (cm)
dextran molecular weight (Da)
stationary phase protein concentration (mg/mL)
percent of total in a histogram particle size bin (%)
maximum binding capacity in Langmuir isotherm
model (mg/mL)
radial coordinate (cm)
volume mean particle radius (m)
pore radius (nm)
dextran hydrodynamic radius (nm)
time (s)
standard error of regression (units of the response
variable)
superficial mobile phase velocity (cm/s)
interstitial mobile phase velocity (cm/s)
retention volume (mL)
volume at which 10% breakthrough occurs (mL)
axial coordinate (cm)
Dimensionless numbers
NBi
Biot number, =kf rp /De
Reynolds number, =dp u / εb
NRe
NSc
Schmidt number, = / D0
Greek symbols
P
pressure drop in a packed bed (MPa)
extraparticle porosity (interstitial column volume
εb
fraction)
εp,x
intraparticle porosity for solute x
εT
total column porosity, = εb + (1 − εb ) εp
dynamic viscosity (cP)
density (g/mL)
capacity, both equilibrium and dynamic capacity, is not limited to
batch processing as similar increases in productivity are expected
in continuous multi-column process settings. In response to these
market pressures, numerous Protein A stationary phases have been
introduced over the last several years to achieve ever higher DBCs
and increased productivity. In some cases, an increase in DBC is realized by improving static binding capacity through modification of
the ligand [34,35] or increasing the ligand density [7,36]. In other
cases, DBC can be increased by reducing mass transfer resistance
such that the available static capacity is utilized more efficiently
[37–40].
In this work, we examine recent innovations in Protein A
stationary phases suitable for industrial-scale capture of biopharmaceuticals. The work includes comprehensive characterization of
the stationary phase morphological properties, as well as binding
and elution behavior for a panel of antibodies and Fc-fusion proteins. In addition, we quantitatively describe protein mass transfer
using the general rate model to determine effective pore diffusivity.
Finally, the Protein A stationary phases were tested with clarified
cell culture broth to assess process performance and product quality under realistic bioprocess settings.
2. Materials and Methods
2.1. Buffer reagents and protein preparations
Chemicals used for buffer preparation and dextran standards
were obtained from Sigma (St. Louis, MO, USA) and JT Baker
(Phillipsburg, NJ, USA). Antibodies and Fc-fusion proteins were
expressed in Chinese hamster ovary (CHO) cells using standard cell
culture techniques. To generate purified material, clarified cell culture broth was purified by Protein A chromatography and then by
ion exchange chromatography. Table 1 summarizes the antibodies
and Fc-fusion proteins used in this work.
2.2. Protein A stationary phases
Protein A stationary phases used in this work are summarized in Table 2 along with publicly available data obtained from
manufacturer literature. All stationary phases were commercially
available, except for MabSelect PrismA, which was obtained as a
pre-commercial launch sample from GE Healthcare (Marlborough,
MA, USA). The Protein A stationary phases were flow packed in
1.1 cm diameter Vantage L11 columns from Millipore (Billerica, MA,
USA) to a 10 cm bed height and compression factors of ∼1.2 were
achieved for all resins. Packed bed quality was evaluated by calculating asymmetry factors and reduced HETP from pulses of sodium
chloride in Tris buffer at pH 7.4. Values for asymmetry factor ranged
from 1.0–2.2 and reduced HETP values ranged from 3.6–9.2, which
are consistent with the reduced HETP values recently reported for
lab-scale columns [41].
2.3. Protein concentration determination
mutations in the B and C domains of Protein A [31]. Many of the
commercially available Protein A stationary phases now consist
of engineered ligands with repeat units derived from the B or C
domain, and can withstand many cycles of exposure to sodium
hydroxide concentrations at or greater than 0.1 N.
In addition to the increase in alkaline stability, there has been
a robust demand to increase the binding capacity of Protein A stationary phases in response to continuously increasing cell culture
titers, which now routinely exceed 5 g/L. Process models developed
to predict facility capacity and cost of goods have been shown to
be sensitive to Protein A capture column dynamic binding capacity (DBC) [32,33]. Moreover, the importance of increased binding
Protein concentrations of purified samples were determined
using a Nanodrop 2000c from Thermo Scientific (Wilmington,
DE, USA) with the microvolume pedestal and measurement at
a wavelength of 280 nm. Concentrations of antibodies and Fcfusion proteins in clarified cell culture broth were determined
by analytical Protein A high-performance liquid chromatography
(ProA-HPLC) using a POROS A 20 (4.6 mm ID × 10 cm, 20 m) column obtained from Thermo Fisher (Grand Island, NY, USA) with
an Agilent 1200 HPLC system (Palo Alto, CA USA). The HPLC system was operated at 3.5 mL/min with binding and elution mobiles
phases consisting of phosphate buffered saline (PBS) at pH 7.2
and pH 2.2, respectively. Samples were applied to the column
T.M. Pabst et al. / J. Chromatogr. A 1554 (2018) 45–60
47
Table 1
Protein properties.
Molecule
Class
pIa
MW (kDa)b
rh (nm)c
D0 (x10−7 cm2 /s)d
mAb1
mAb2
mAb3
bsAb1
bsAb2
bsAb3
Fc1
Fc2
Fc3
Antibody (IgG1)
Antibody (IgG4)
Antibody (IgG1)
Bispecific Ab (IgG1-(scFv)2 )
Bispecific Ab (IgG1-(scFv)2 )
Bispecific Ab (IgG1-(peptide)2 )
Fc fusion (IgG4Fc-(ligand)2 )
Fc fusion ((IgG4Fc)3 -(ligand)6 )
Bispecific Fc fusion (IgG4-(ligand)2 )
8.3–9.0
6.9–7.5
7.8–8.4
8.9–9.1
8.8–9.0
8.0–8.7
7.0–8.3
5.6–6.5
6.1–7.7
146.7
147.3
149.0
206.2
204.6
158.7
159.0
310.0
280.0
5.2
5.3
5.4
6.3
6.0
5.8
5.4
8.1
7.4
4.6
4.5
4.5
3.8
4.0
4.2
4.5
3.0
3.3
a
b
c
d
Measured by capillary isoelectric focusing.
Measured by mass spectrometry including contribution from glycosylation.
Calculated by Stokes-Einstein equation with D0 measured by dynamic light scattering at infinite dilution.
Measured by dynamic light scattering at infinite dilution.
Table 2
Protein A stationary phase properties as reported by manufacturers.
Name
Abbreviation
Manufacturer
Base matrix
Protein A ligand progenitor domain
(number of repeat units)
dp (m)
Alkaline stabilized
MabSelect SuRe
MabSelect SuRe LX
MabSelect SuRe pcc
MabSelect PrismA
Amsphere A3
AF-rProtein A HC-650F
KanCapA
KanCapA 3G
Eshmuno A
Praesto AP
Monofinity A
MabSpeed rP202
MSS
LX
PCC
PrismA
A3
650F
KCA
KCA3G
EshA
AP
MonoA
rP202
GE Healthcare
GE Healthcare
GE Healthcare
GE Healthcare
JSR Life Sciences
Tosoh Biosciences
Kaneka
Kaneka
EMD Merck
Purolite
Genscript
Mitsubishi
Agarose
Agarose
Agarose
Agarose
polymethacrylate
polymethacrylate
Cellulose
Cellulose
Polyvinylether
Agarose
Agarose
polymethacrylate
B (4)
B (4)
B (4)
B (6)
–a
C (6)
C (5)
–a
C (5)
–a
–a
C (–a )
85
85
50
∼60
50
45
65-85
65-85
∼50
85
∼90
45
Yes
Yes
Yes
Yes
Yes
Yes
Yes
Yes
Yes
Yes
Yes
Yes
a
Not disclosed by the manufacturer.
neat and the elution profile was monitored at 280 nm using the
system spectrophotometer. Elution peak area was converted to
protein concentration using a standard curve generated with purified material.
2.4. Aggregate determination by size exclusion HPLC
Aggregate levels in purified protein samples were determined
by analytical high-performance size exclusion chromatography
(SEC-HPLC) using a TSKgel G3000SWXL (7.8 mm ID × 30 cm, 5 m)
column obtained from Tosoh Biosciences (King of Prussia, PA, USA)
with an Agilent 1260 HPLC system. The HPLC system was operated at 1 mL/min with a mobile phase consisting of 100 mM sodium
phosphate, 200 mM sodium sulfate, pH 6.8. The mobile phase used
to analyze mAb1 samples also included 10% isopropanol. Samples
(250 g) were applied to the column neat and the elution profile
was monitored at 280 nm using the system spectrophotometer.
Aggregate levels were determined as a ratio of peak areas of the
early-eluting aggregate peak(s) and the monomer peak.
2.5. Dynamic Light Scattering
Dynamic light scattering (DLS) measurements were made with
a DynaPro Plate Reader II from Wyatt Technology (Santa Barbara,
CA, USA) with purified protein samples prepared at 2–10 g/L in
25 mM Tris, 150 mM NaCl, pH 7.4. 35 L protein samples were
measured in triplicate in 384 well plates at 20 ◦ C. Diffusivities
were obtained from the Dynamics software (version 7.4.0) and
hydrodynamic radii were calculated within the software using
the Stokes-Einstein equation. Averaged (n = 3) values were plotted
versus concentration and extrapolated to obtain diffusivity values
and hydrodynamic radii at infinite dilution.
2.6. Electron microscopy
Transmission electron microscopy (TEM) of stationary phases
was performed at Charles River Pathology Associates (Durham,
NC, USA). Stationary phases in their shipping solutions (∼20%
ethanol) were dehydrated with graded steps to 100% ethanol, solvent exchanged into 100% acetone, and then embedded in Spurr’s
resin to generate solid sample blocks. Thin sections (∼90 nm) were
cut using a diamond knife, stained with methanolic uranyl acetate
and Reynold’s lead citrate, and then examined with a transmission
electron microscope from JEOL (Peabody, MA, USA; model JEM1011). TEM was performed at magnifications between 800–6000x
and high-resolution images were captured with an AMT XR16M
digital camera.
2.7. Particle size measurements
Volume mean diameters were determined by light scattering
using the Partica laser scattering particle size distribution analyzer (model LA-950V2) from Horiba Instruments (West Chicago,
IL, USA). Stationary phase samples were prepared at 15% slurries
in 50 mM Tris, 150 mM NaCl, pH 7.4 and then 1 mL of the sample
slurry was added to the detection chamber and measured at room
temperature. Horiba software reported the volume mean diameter,
the standard deviation of the particle size distribution, and the distribution histogram. Samples were measured in triplicate and the
volume mean diameter was determined from the average of three
sample measurements.
2.8. Pressure-flow curves
Pressure drop across packed beds was measured at linear superficial velocities between 0–400 cm/h using a digital manometer
48
T.M. Pabst et al. / J. Chromatogr. A 1554 (2018) 45–60
(model 3462) purchased from Traceable Products (Webster, TX,
USA). Column inlets were connected to an AKTA Pure 25 (GE Healthcare, Marlborough, MA USA) system pump and the column outlet
left open to atmospheric pressure. The digital manometer was connected to the inlet and outlet tubing with T-connections. Pressure
drop measured in an empty column with the adapters pushed
together was subtracted from the packed bed measurements.
2.9. Particle porosity measurements
Particle porosities, εp , were obtained from isocratic pulses injections of mAb3, bsAb1, and sodium chloride carried out at 150 cm/h
using an AKTA Pure 25. For protein pulses, the mobile phase was
50 mM acetate, 100 mM NaCl, pH 3.0 for all protein and stationary
phase combinations except proteins injected on to the Toyopearl
AF-rProteinA HC-650F column, which used 100 mM acetic acid
to prevent interactions with the column at pH 3.0. Protein samples (final concentration ∼2.5 mg/mL) were injected on to the
columns using a 100 L sample loop. For sodium chloride injections, the mobile phase was 50 mM Tris, 150 mM NaCl, pH 7.4,
and 100 L samples of 50 mM Tris, 1 M NaCl, pH 7.4 were injected
using a sample loop. Peak retention was monitored using the AKTA
instrumentation (absorbance for proteins, conductivity for sodium
chloride) and the data was exported to Excel software to determine the peak retention volume using the first statistical moment.
The system volume, determined in an empty column with the
adapters pushed together, was subtracted from the values obtained
in packed beds.
2.10. Inverse size exclusion chromatography using dextran pulse
injections
Dextran injections were carried out at 1 mL/min using an Agilent 1260 HPLC and the peak retention was monitored with an
Agilent refractive index (RI) detector (Model G1362A). The mobile
phase (50 mM Tris, pH 7.4) was controlled to 26 ◦ C with a recirculating water bath. Temperature of the autoinjector, column
block, and RI detector were controlled at 26 ◦ C using Chemstation
software. Dextran samples, purchased from Sigma-Aldrich (with
nominal molecular weights of 10 kDa (catalog #D9260), 40 kDa
(31389), 70 kDa (31390), 270 kDa (00894), 410 kDa (00895), and
670 kDa (00896), and dextrose, purchased from Thermo Fisher
Scientific (catalog #D16-1), were dissolved in the mobile phase
buffer at a final concentration of 5 mg/mL and injected neat
(10 L) on to the ∼10 mL Protein A columns (packed in Vantage L11 columns as described previously). Data was exported
to Excel software to determine the peak retention volume, VR ,
using the first statistical moment, and the distribution coefficient,
KD = VR /CV − εb / (1 − εb ). Peaks were normalized by peak area
for plotting. The system volume, determined in an empty column
with the adapters pushed together, was subtracted from the values
obtained in packed beds.
2.11. Adsorption isotherms
Equilibrium adsorption isotherms were constructed from
1.25 mL batch binding experiments. Protein stock solutions were
prepared at ∼5 mg/mL in equilibration buffer (50 mM Tris, 150 mM
NaCl, pH 7.4) and diluted to known concentrations with equilibration buffer in 1.5 mL Eppendorf tubes. Stationary phase slurries
were prepared at ∼15% in equilibration buffer, added to the diluted
protein samples, and allowed to gently mix on a rotator for
24–28 hours. After equilibration, the Eppendorf tubes were centrifuged briefly to pellet the stationary phases and the protein
concentrations in the liquid phases were measured. A mass bal-
ance was used to determine the amount of protein that was bound
to the stationary phase at equilibrium.
2.12. Breakthrough behavior and equilibrium binding capacity
measurements
Breakthrough behavior was determined using the AKTA Pure
25 at a residence time of 4 minutes with a ∼10 mL packed bed.
Purified protein load was adjusted to pH 7.4 ± 0.2 and conductivity was adjusted to 15 ± 2 mS/cm with sodium chloride. The
column was equilibrated with 50 mM Tris, 150 mM NaCl, pH 7.4
and then loaded with protein (feed concentration, CF ∼5 mg/mL)
until the column was saturated (i.e. the outlet concentration was
∼99% of the feed concentration). The exact protein concentration
of the feed was determined by offline A280 measurement using
the Nanodrop 2000c. Bed exhaustion occurred with a protein load
of 150–225 mg/mL column volume, depending on the protein and
stationary phase. Instantaneous concentration at the column outlet was measured online at 280 nm using the AKTA UV meter. The
UV absorbance was measured with the column in bypass to determine the maximum absorbance of the protein feed solution. To
test for linearity, the AKTA UV meter was calibrated with mAb1,
which had the greatest UV absorbance of the proteins evaluated in
this study. A highly linear calibration curve was obtained over the
protein concentration range used for breakthrough and dynamic
binding capacity experiments.
The equilibrium binding capacity (EBC, in mg/mL of solid
support) was determined from a full breakthrough curve by numerically integrating the area above the curve and below the feed
concentration according to:
∞
EBC =
0
(CF − C)dV − εT CF CV
(1 − εT )CV
(1)
Where εT = εb + (1 − εb ) εP is the total porosity (outside of particle and inside pores), εb is the extraparticle porosity, and CV is the
column volume (or packed bed volume). In this equation, the integral in the numerator represents the mass of protein accumulated
in the column during the entire breakthrough experiment and the
second term in the numerator represents the mass of protein that
remains unbound in the liquid within the column; taken together
they represent the mass of protein bound to the solid phase during
the experiment. The denominator represents the amount of stationary phase (in units of mL of solid support). The system holdup
volume (determined by protein pulses in empty columns with the
adapters pushed together) was also subtracted from the volume
loaded. EBCs were converted to mg/mL of particle or mg/mL of
packed bed using εp and εb , as appropriate.
2.13. Dynamic binding capacity measurements
Dynamic binding capacity (DBC), defined as the amount of protein loaded at 10% breakthrough, was determined for stationary
phases packed in ∼10 mL columns using an AKTA Pure 25 in a manner similar to full breakthrough curves as described above. The
column was equilibrated with 50 mM Tris, 150 mM NaCl, pH 7.4
and then loaded with pH and conductivity adjusted purified protein
at CF ∼5 mg/mL until >10% breakthrough was observed. DBC was
determined at residence times of 2.4, 4, and 6 minutes according
to:
DBC =
(V10% − εT CV )CF
CV
(2)
where V10% is the volume at which 10% breakthrough occurs.
As can be seen from Eq. (2), the unbound protein that remains in
the liquid inside the column is subtracted from the bound protein
for purposes of calculating DBC, whereas the amount of protein that
T.M. Pabst et al. / J. Chromatogr. A 1554 (2018) 45–60
49
Table 3
Summary of Protein A stationary phase morphological properties.
Name
MabSelect SuRe
MabSelect SuRe LX
MabSelect SuRe pcc
MabSelect PrismA
Amsphere A3
AF-rProtein A HC-650F
KanCapA
KanCapA 3G
Eshmuno A
Praesto AP
Monofinity A
MabSpeed rP202
a
b
c
d
e
Particle sizea (m)
dp
SD
89.6
88.4
44.4
54.1
49.6
54.2
75.0
79.2
50.2
92.5
95.7
44.9
21.8
20.7
6.5
8.1
8.4
7.2
11.7
11.3
8.1
20.8
20.3
5.7
rpore b (nm)
41.8
38.2
29.7
32.7
46.0
30.8
51.0
42.5
40.8
37.4
36.8
60.5
Extraparticle
porosity, εb c
0.31
0.31
0.35
0.34
0.34
0.34
0.36
0.33
0.34
0.25
0.29
0.37
Intraparticle porosity
εp,mAb3 d
εp,bsAb1 d
εp,NaCl e
εp,dex b
0.76
0.69
0.57
0.50
0.61
0.36
0.67
0.70
0.74
0.69
0.63
0.42
0.70
0.65
0.53
0.49
0.53
0.30
0.69
0.69
0.70
0.64
0.60
0.44
0.96
0.96
0.92
0.94
0.89
0.91
0.98
0.95
0.82
0.95
0.98
0.86
0.94
0.90
0.87
0.92
0.85
0.76
0.91
0.88
0.81
0.95
0.92
0.74
As measured by laser light scattering. dp is the volume mean diameter; SD is the standard deviation of the frequency distribution.
Determined by fit of Eq. (4) to isocratic elution data obtained with dextran probes ranging from 10–670 kDa.
Determined from fit of Eq. (3) to pressure drop data in a packed bed.
Determined from injections of mAb or bsAb under non-binding (acidic) conditions described in Section 2.9.
Determined from NaCl pulse injections.
breaks through the column (up to 10% breakthrough) is included
in the DBC value. A more rigorous calculation, like Eq. (1) where
the limits of integration go from 0 to V10% , could be implemented
to account for protein that breaks through up to V10% , but this contribution is negligible and thus was not accounted for in the DBC
values. The total porosity determined by mAb3 injections was used
in DBC calculations for mAb1-3, bsAb1, and Fc1 (i.e. the smaller
proteins), while total porosity determined by bsAb1 injections was
used for the larger proteins.
2.14. Linear pH gradient elution chromatography
For linear pH gradient elution experiments, columns were equilibrated with 50 mM Tris, 150 mM NaCl, pH 7.4 and then purified
protein was loaded on the column to 5 mg/mL packed bed using
an AKTA Pure 25. The column was re-equilibrated, washed with
50 mM citrate, pH 6.7, and then eluted in a linear gradient to 50 mM
citrate, pH 2.7 over 10 column volumes at 150 cm/h. Equilibration
and elution buffer pH was measured offline using a SevenMulti pH
meter from Mettler Toledo (Columbus, OH, USA) equipped with an
InLab Expert Pro pH probe from Mettler Toledo and calibrated with
pH 2, 4, 7, and 10 standards. Peak retention volume was determined
by peak maximum absorbance (from the AKTA spectrophotometer at 280 nm). Elution pH at the peak maximum was calculated
through linear interpolation between the offline pH values of the
two buffers used to form the gradient. The AKTA pH trace was
adjusted to account for the total column porosity, εT , and the system delay volume. Elution pH at peak maximum as determined
by linear gradient elution was used to select an appropriate elution pH for the step elution phase in the capture chromatography
experiments described in the following section.
2.15. Capture from clarified cell culture broth
Capture of proteins from clarified cell culture broth (CCCB) was
evaluated in packed columns using an AKTA Pure 25. Columns were
equilibrated with 50 mM Tris, 150 mM NaCl, pH 7.4 and then CCCB
was loaded on the column at a residence time of 4 min. The load
was calculated as 85% of the DBC measured at a residence time
of 4 min. Columns were re-equilibrated with 50 mM Tris, 150 mM
NaCl, pH 7.4 and then eluted in stepwise fashion with 25 mM
acetate, pH 3.4–3.5 for all stationary phases except for Toyopearl
AF-rProteinA HC-650F (which used pH 3.2), and MabSpeed rP202
(pH 3.8). Elution pools were collected from 100-100 mAU (using
AKTA spectrophotometer with a 2 mm path length at 280 nm). Step
yield was determined using mass of product in the load (determined by ProA-HPLC) and pool (determined by A280).
2.16. Host cell protein and DNA measurements
Host cell protein (HCP) concentrations were measured using
the bioaffy sandwich immunoassay on the Gyrolab xP workstation
from Gyros AB (Uppsala, Sweden). Capture and detection antibodies were in-house reagents raised against HCP from the cell line
used to produce the antibodies and Fc-fusion proteins used in this
work.
Host cell DNA concentrations were measured by an inhouse method employing a sodium iodide/sodium dodecyl
sulfate/Proteinase K sample treatment followed by an isopropanol
DNA extraction coupled with a quantitative Polymerase Chain
Reaction targeting the Short Interspersed Nuclear Element DNA
sequence repeated across the CHO genome with SYBR Green based
detection.
3. Results and discussion
3.1. Stationary phase morphological properties
Table 3 summarizes Protein A stationary phase morphological properties. As can be seen in the table, particle sizes were
in agreement with data provided by the manufacturer and standard deviations measured were typically small compared to the
mean particle size (13–24% of the volume averaged mean value).
Particle size distributions can be found in Supplemental material
(Fig. S3). Extraparticle porosities of the stationary phases packed in
chromatography columns were determined by fitting the Kozeny
equation [42] to pressure drop data (by minimizing the residual
sum of squares):
P
(1 − εb )2
u
= 150 2
L
dP
ε3b
(3)
Where and u are the mobile phase dynamic viscosity and superficial velocity, respectively, and dP is the average particle diameter.
For this work, dP -values determined from particle sizing (volume
mean diameters; see Table 3) were used in place of manufacturer’s
data. Pressure drop curves were found to be linear over the range
tested (up to 400 cm/h in 1.1 cm × 10 cm packed beds) and the magnitude of the pressure drop was consistent with expectations based
50
T.M. Pabst et al. / J. Chromatogr. A 1554 (2018) 45–60
on particle size. It is worth noting that the pressure drop in a larger
diameter manufacturing-scale column will likely be higher due to
a loss of wall support; nonetheless, the data presented is useful to
assess relative differences between the stationary phases. The fitted
εb -values are shown in Table 3 and pressure drop curves with the
fitted Kozeny equation are shown in Supplemental material (Fig.
S4).
Particle porosities measured using sodium chloride were greater
than 0.9 for the less rigid (agarose and cellulose) particles and
between 0.8–0.9 for the more rigid (synthetic polymer) particles
suggesting a higher percentage of solids in the base matrices for the
synthetic polymer supports. Particle porosity was also estimated
with mAb3 and bsAb1 under non-binding (acidic) conditions. As
expected, the larger proteins could not access the entire pore volume due to steric restrictions, and resulted in porosities that were
lower than obtained using sodium chloride, with only minor differences observed between the mAb (εp,mAb3 = 0.34–0.76) and the
slightly larger bsAb (εp,bsAb1 = 0.30–0.70) as shown in Table 3.
Inert dextan probes, ranging from 10–670 kDa, were used to further elucidate particle porosity (data in Supplemental material, Fig.
S5). For all the stationary phases tested, the largest 670 kDa dextran probe could access a limited fraction of the particle volume
while smaller dextran probes gained access to a larger portion of
the particle volume. To estimate the pore radius, rpore , and intraparticle porosity, εp,dex , using the dextran elution data, a cylindrical
pore model was applied according to Hagel et al. [43]:
KD = εp,dex 1 −
rs
rpore
2
(4)
Where KD is the distribution coefficient and rs is the dextran hydrodynamic radius. For this work rs -values were estimated from the
dextran viscosity radii correlation of Squire [44]:
rs = 0.028 × M 0.47
(5)
where M is the dextran molecular weight. A plot of
KD vs.
rs was used to obtain the fitted values of rpore , and εp,dex (by
linear least squares). The εp,dex -values obtained, as shown in
Table 3, were slightly higher than those of non-retained proteins
and slightly lower than those obtained using sodium chloride
injections, suggesting that the dextran probes experience a macroporous structure free of very small pores that only sodium chloride
can access. The rpore -values obtained from the model fit, as shown
in Table 3, were generally consistent across stationary phases, with
values in the range of 30–60 nm. These data suggest that the particles have highly porous structures which was supported by TEM
of the stationary phases (data in Supplemental material, Fig. S2).
TEM micrographs showed spherical particles with wellconnected porous networks, regardless of the base matrix material.
Some differences were observed in the morphology of the base
matrix structures, where the more rigid synthetic polymer materials appeared to have structures that include dense nodes
surrounded by pore networks, but in general the pore sizes
appeared to be similar, which is consistent with the cylindrical pore
model results discussed above.
Substantial variation in staining was observed across the stationary phases as shown in Fig. S2. For example, Monofinity A and
MabSelect PrismA appeared to be heavily stained while MabSelect
SuRe pcc and Praesto AP showed little staining. The stains employed
in this study, uranyl acetate and Reynold’s lead citrate, are primarily utilized for TEM imaging of biological specimens. Exactly how
they interact with embedded stationary phase specimens of this
nature remains a matter of conjecture. Therefore, while heavier
staining implies a region with a higher concentration of electron
dense atoms, it is difficult to draw conclusions beyond this. In
particular, we would caution against interpretations that link stain-
ing variation to Protein A ligand density or distribution under the
assumption that these stains primarily interact with the polypeptide chain of the Protein A ligand.
3.2. Adsorption isotherms
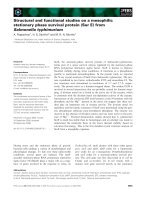
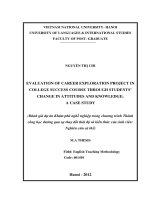
Fig. 1 shows adsorption isotherms for mAb1 on Protein A stationary phases. Adsorption isotherms for all other protein and
stationary phase combinations are available in Supplemental material (Fig. S6). The isotherm data were fit with the Langmuir
isotherm:
q=
qm KC
1 + KC
(6)
where qm is the maximum binding capacity and K is the adsorption constant. Fitted values of these parameters (determined by
minimizing the residual sum of squares) are available in Supplemental material (Table S2). Since there are challenges in the
isotherm experimentation, particularly with accurate determination of stationary phase volume added to the isotherm batch
binding experiment, we adopted a methodology that relies on
breakthrough experiments to estimate qm -values in a manner
similar to Ng et al. and Reck et al. [45–47]. The qm -value (and corresponding experimental q-values shown in Fig. 1 and Fig. S6) were
normalized to the EBCs ascertained with Eq. (1) using full breakthrough curves such that qm is set equal to the EBC. This approach
assumes for Eq. (6) that q = qm at C = CF , which is valid for the case of
a nearly rectangular isotherm provided that CF lies in the flat portion of the curve. In most instances, the qm -value changed by less
than 15% when normalizing to the EBC value.
As can be seen in Fig. 1 (and Supplemental material Fig. S6) the
isotherms are highly favorable for all stationary phases, which is
consistent with Protein A behavior previously reported in the literature [37,39,40]. Equilibrium capacities are quite high for the
Protein A stationary phases, greater than 140 mg/mL particle in
some instances. To make comparisons within the large data set,
EBCs of stationary phases were averaged for a given stationary
phase across various protein groupings (e.g. all of the mAbs, or all of
the proteins with molecular weights in the range of 147–159 kDa).
Comparing stationary phases in terms of average EBC value for proteins with molecular weights similar to mAbs, MabSelect PrismA
and MabSelect SuRe pcc performed best, averaging >126 mg/mL
particle. KanCapA 3G and MabSelect SuRe LX showed the next
highest equilibrium capacities (107–112 mg/mL particle), followed
by Toyopearl AF-rProteinA HC-650F, Monofinity A, and Praesto AP
(92–96 mg/mL particle), and then Amsphere A3, MabSpeed rP202,
and Eshmuno A (81–86 mg/mL particle). Similar capacities and
trends were observed for the larger bsAbs (∼200 kDa); however,
average EBCs for the larger Fc-fusion proteins (280–310 kDa) were
50-65% of the those determined for the smaller proteins.
3.3. Dynamic binding capacity
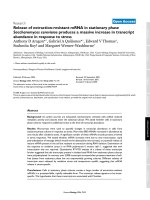
Dynamic binding capacities at 10% breakthrough were determined for all combinations of proteins and stationary phases for 2.4,
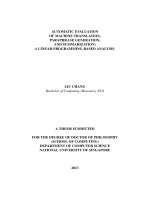
4, and 6 min residence times. Fig. 2 shows DBC plotted as a function
of residence time. DBC values are also available in tabular format in
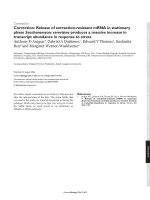
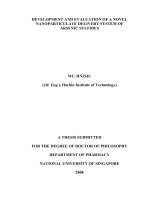
Supplemental material (Table S1). For the 4 min residence time condition, full breakthrough curves were obtained for columns loaded
to 150–220 mg/mL packed bed, and are shown in Fig. 3 for mAb1.
Full breakthrough curves at 4 min residence time for the remaining molecule and stationary phases combinations are available in
Supplemental material (Fig. S7).
As can be seen in Fig. 2, the Protein A stationary phases have
high dynamic binding capacities, greater than 70 mg/mL packed
bed in some instances at 4–6 min residence times. The range of
T.M. Pabst et al. / J. Chromatogr. A 1554 (2018) 45–60
51
Fig. 1. Equilibrium isotherms for mAb1 on Protein A stationary phases. Open circles are experimental data and the solid line is a fit of the Langmuir isotherm, Eq. (6), with
parameters given in Table S2.
dynamic binding capacities that were observed was similar for the
mAbs and bsAbs except for mAb1, which was higher for all stationary phases. For Fc1, which is similar in size to the mAbs, the
DBC range was broader across stationary phases, but largely similar to mAbs and bsAbs. For the larger Fc2 and Fc3 molecules, the
binding capacities were considerably lower, reaching 30-40% of the
capacity determined for the smaller mAbs and bsAbs.
Similar to the analysis of EBC in the previous section, comparisons were made between stationary phases in terms of average
DBC at 4 min residence time for proteins with molecular weights
similar to mAbs (147–159 kDa). The stationary phases generally fell
into groups with MabSelect PrismA and MabSelect SuRe pcc having the highest DBCs for all molecules at 4 minutes residence time.
The next group of stationary phases included KanCapA 3G, MabSelect SuRe LX, Toyopear AF-rProtein A HC-650F, Praesto AP, and
Amsphere A3, while the remaining stationary phases behaved similarly to each other in a third group. For larger bsAbs (∼200 kDa) and
the larger Fc-fusion proteins (∼300 kDa) the average DBC comparison groupings remained the same but Amsphere A3 and Toyopearl
AF-rProtein A HC-650F moved to the top of the second group while
MabSelect SuRe LX and KanCapA 3G fell slightly within the second
group. This observation suggests that Amsphere A3 and Toyopearl
AF-rProtein A HC-650F may be able to better accommodate the
larger proteins.
In all cases, the DBC data follow the expected trend where
shorter residence times resulted in lower dynamic binding capacities. The decrease in DBC between 6 min and 4 min residence times
was consistent for mAbs and bsAbs and was typically smaller than
the decrease from 4 min to 2.4 min. Comparing stationary phases
for a given molecule revealed that MabSelect PrismA, Monofinity
A, MabSelect SuRe LX, KanCapA 3G, and Praesto AP were slightly
more sensitive to residence time, as these stationary phases showed
steeper declines in DBC between 4 min and 2.4 min residence times
across most proteins tested. The larger impact of residence time
suggests these resins may experience higher mass transfer resistance. This topic is explored in the next section.
3.4. Protein mass transport
Mass transfer plays a key role in the performance of modern Protein A stationary phases [36–39]. Therefore, examination of protein
mass transport is crucial to gain a comprehensive understanding
of these materials and make informed judgements. To characterize
protein mass transport in packed beds, we chose the chromatography general rate model, given by:
2
∂c
∂c
∂ c 1 − εb 3
−
k (c − cp |r=rp )
= −v
+ Dax
εb rp f
∂t
∂z
∂z 2
∂cp
= Dp
∂t
2
∂ cp 2 ∂cp
+
r ∂r
∂r 2
−
1 − εp ∂q
εp ∂t
(7)
(8)
Eq. (7) represents a mass balance on the interstitial column volume with terms for convection, dispersion, and film mass transfer.
Eq. (8) represents a mass balance on the stationary phase with
terms for pore diffusion and adsorption.
Danckwerts boundary conditions were applied at the column
inlet and outlet [48]. A symmetry condition was assumed at the
bead center, and stagnate film mass transfer was applied at the
boundary of the stationary phase and the interstitial column volume [48]. Local equilibrium was assumed for protein adsorption as
52
T.M. Pabst et al. / J. Chromatogr. A 1554 (2018) 45–60
Fig. 2. Dynamic binding capacities as a function of residence time for mAbs, bispecific antibodies, and Fc fusion proteins on Protein A stationary phases.
described by Eq. (6). Equations (7), (8) and the boundary conditions
were spatially discretized using finite volumes and the weighted
essentially non-oscillatory (WENO) method [48]. The resulting system of ordinary differential equations was numerically integrated
using CADET software version 2.3.2 (64 bit) running on a Windows
7 PC with MATLAB version R2014b and an Intel CORE i7 CPU [49].
Langmuir isotherm parameters, K and qm , are given in Supplemental materials (Table S2). Axial dispersion, Dax , was neglected
[50,51]. The particle radius, rp , extraparticle porosity, εb , and particle porosity, εp , were obtained from Table 3. εp,mAb3 was used for the
smaller proteins (mAb1-3, bsAb3, and Fc1), and εp,bsAb1 was used for
the larger proteins (bsAb1-2, Fc2-3). The film mass transfer coefficient, kf , was estimated from the correlation given by Carberry
[52]:
kf = 1.15
u −1/2 −2/3
N
NSc
εb Re
(9)
Where NRe = dp u / εb (Reynolds number) and NSc = / D0
(Schmidt number).
Using the parameter values described above, pore diffusivity, Dp ,
was fit to experimental breakthrough data by minimizing the residual sum of squares (RSS). Fig. 3 shows modeling results obtained
for mAb1. As can be seen from the figure, the goodness of fit was
generally excellent in this case but did vary from stationary phase
to stationary phase. Other proteins (shown in Supplemental material Fig. S6) tended to behave similarly. Perhaps not surprisingly,
overall a better fit was obtained with the mAbs and a poorer fit was
obtained with the larger Fc-fusion proteins.
When the goodness of fit was inferior it was associated with
instances where the breakthrough curve tailed to a greater extent,
suggesting a slow approach to equilibrium. This observation is confirmed quantitatively by the standard error of regression, S, also
shown in Fig. 3 (and Fig. S6 in Supplemental material). The tailing
behavior has previously been explained based on a heterogeneous
binding mechanism where there are fast binding sites that are diffusion controlled and slow sites controlled by binding kinetics [39].
In the context of Protein A, this explanation intuitively makes
sense as there are multiple binding sites on a single Protein A ligand
[7,34]. We can speculate that the diffusion controlled fast binding
sites correspond to low binding occupancy of a Protein A ligand. On
the other hand, as ligand occupancy increases, we can surmise that
the remaining binding sites may become less accessible and more
sterically hindered, corresponding to slow binding kinetics. Therefore, in instances where this behavior was observed, the reported
effective pore diffusivity, De (=εp Dp ), value essentially represents
an average that incorporates resistances due to both pore diffusion
and binding kinetics, likely having limited predictive usefulness.
Nonetheless, even when the goodness of fit varied, the De -values
obtained were often consistent. For example, based on both quantitative measures (S) and qualitative comparison, the goodness of
fit spanned a broad range for the three mAbs on MabSelect SuRe
LX. Despite this, the De -values obtained by minimization of RSS
varied relatively little, ranging from 3.0–3.5 × 10⁻⁸ cm2 /s, which is
probably within the expected error for this type of measurement.
Fig. 4 summarizes De /D0 for all proteins and stationary phases
evaluated in this study. Quantitative values of all results summarized in Fig. 4 are provided in Supplemental material (Table
S2). D0 values are summarized in Table 1 and DLS data used to
estimate D0 are given in Supplemental material (Fig. S1). Where
available, the De -values obtained were largely consistent with
T.M. Pabst et al. / J. Chromatogr. A 1554 (2018) 45–60
53
Fig. 3. Breakthrough curves for mAb1 on Protein A stationary phases. Open circles show experimental data and solid lines show fitted model results based on Eqs. (7) and
(8) using parameters in Table S2. The standard error of regression, S, is given for each stationary phase.
previously reported values for Protein A stationary phases evaluated at higher protein concentrations [36,38,39]. In particular,
the De -values obtained in this study for monoclonal antibodies
at 5 mg/mL concentration on MabSelect SuRe, which ranged from
4.8–5.7 × 10⁻⁸ cm2 /s, were in good agreement with values reported
by Hahn and coworkers [38]. In their detailed study, a De -value of
5 × 10⁻⁸ cm2 /s was obtained for shallow bed uptake on MabSelect
SuRe at 3.0 mg/mL protein concentration. With respect to external mass transfer, the Biot Number (NBi ) values obtained across
all stationary phases and proteins tested ranged from 118-990,
suggesting film mass transfer plays a negligible role under the conditions utilized for this study.
3.5. Linear pH gradient elution chromatography
Since Protein A chromatography is often employed as part of a
platform approach, it is important to select an elution pH that works
consistently for a majority of the modalities to be purified with the
platform process. This may include more than one antibody format
as well as Fc-fusion proteins. Table 4 summarizes the elution pH
determined by pH gradient elution for all protein and stationary
phase combinations. As can be seen in the table, elution pH was
found to occur between 3.5–3.8 and only minor variations were
observed for all molecules on a given stationary phase. There were
a few exceptions to this behavior that were specific to a protein or
stationary phase. For example, Toyopearl AF-rProtein A HC-650F
required the lowest pH for elution of all proteins (0.1–0.3 pH units
lower), while the elution pH for MabSpeed rP202 was found to be
higher than the other stationary phases (0.2–0.5 pH units higher).
This unique high pH elution on MabSpeed rP202 could be beneficial
for proteins that are sensitive to acidic conditions, such as Fc-fusion
proteins, which can aggregate rapidly under acidic conditions [53].
The only protein that was out of trend was Fc3 which was found to
elute 0.3–0.4 pH units higher than all other proteins. This data set
was used to select an appropriate elution pH for the step elution
conditions used for purification of select molecules from clarified
cell culture broth. In most cases pH 3.4–3.5 was suitable for step
elution; however, AF-rProtein A HC-650F required a lower pH (pH
3.2) while MabSpeed rP202 could elute the select molecules with
a higher pH (pH 3.8).
Based on previous reports in the literature, the underlying cause
of the observed variation in elution pH, and in the milder elution
conditions seen for MabSpeed rP202 in particular, are most likely
due to ligand polypeptide sequence differences as a result of protein
engineering to improve ligand performance [54]. This remains a
matter of speculation; however, as Protein A ligand sequence information for the stationary phases evaluated in this study have not
been publicly disclosed by the manufacturers. Nonetheless, similar
strategies have demonstrated it is possible to elute Protein A under
milder pH conditions through destabilization of the ligand itself or
the ligand-Fc interaction [55–57].
3.6. Capture from clarified cell culture broth
Capture chromatography experiments were conducted to test
the ability of the Protein A stationary phases to selectively purify
three of the proteins in this study. In all cases, the chromatogram
for the capture step was well behaved, showing sharp elution peaks
and little to no protein in the 0.1 M acetic acid column strip (Fig. S8
in Supplemental material shows example chromatograms for the
54
T.M. Pabst et al. / J. Chromatogr. A 1554 (2018) 45–60
Table 4
Elution pH on Protein A stationary phases as determined by pH gradient elution.
Stationary
phase
MabSelect SuRe
MabSelect SuRe LX
MabSelect SuRe pcc
MabSelect PrismA
Amsphere A3
AF-rProtein A HC-650F
KanCapA
KanCapA 3G
Eshmuno A
Praesto AP
Monofinity A
MabSpeed rP202
pH at elution peak max
mAb1
mAb2
mAb3
bsAb1
bsAb2
bsAb3
Fc1
Fc2
Fc3
3.7
3.7
3.7
3.8
3.7
3.4
3.7
3.8
3.7
3.6
3.7
4.2
3.6
3.6
3.6
3.5
3.5
3.4
3.6
3.7
3.7
3.5
3.7
4.1
3.7
3.7
3.7
3.7
3.7
3.5
3.7
3.8
3.7
3.6
3.7
4.2
3.7
3.7
3.7
3.7
3.6
3.5
3.7
3.8
3.8
3.5
3.7
4.2
3.7
3.7
3.7
3.6
3.6
3.5
3.7
3.8
3.7
3.5
3.7
4.2
3.7
3.7
3.7
3.7
3.7
3.4
3.6
3.7
3.7
3.6
3.7
4.0
3.7
3.6
3.6
3.7
3.6
3.2
3.6
3.6
3.6
3.6
3.7
4.0
3.6
3.6
3.6
3.6
3.6
3.3
3.5
3.6
3.6
3.5
3.6
3.9
4.0
4.0
4.0
4.0
3.9
3.7
3.9
3.9
4.0
3.8
4.0
4.7
Fig. 4. De /D0 values for mAbs (top panel), bsAbs (middle panel), and Fc-fusion proteins (bottom panel) measured on Protein A stationary phases. De -values obtained
from fit of breakthrough curves using Eqs. (7) and (8) with parameters given in Table
S2. D0 -values determined by DLS are given in Table 1.
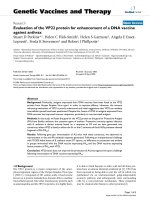
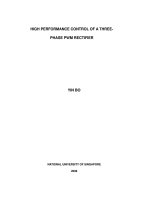
capture of mAb1 from CCCB). Fig. 5 summarizes the process performance and resulting product quality in the Protein A elution pool.
As can be seen in the figure, yields were consistently above 90%,
with only minor differences observed between stationary phases.
Elution pool volumes were slightly more variable, falling between
1.8–3.8 column volumes; however, the variability was the result of
a few protein and stationary phase combinations, and most of the
results fall in a narrower range of 2–3 column volumes. In some
cases, higher binding capacity stationary phases did have larger
elution pools compared to the lower capacity stationary phases,
but no trends among high capacity resins were observed.
Protein A chromatography is most often employed as the capture column in a purification train and is expected to provide highly
selective binding while process-related impurities remain in the
column flow through. Moreover, Protein A chromatography is not
expected to reduce the level of product-related impurities, such
as aggregates, under typical operating conditions. As can be seen
in Fig. 5, HCP, DNA, and aggregate levels in the elution pool were
relatively consistent between stationary phases for a given protein
with only minor exceptions. When considering HCP levels in the
elution pool, there was no stationary phase that provided the best
HCP removal for all three molecules tested. For example, MabSelect
SuRe LX had the highest HCP level of all stationary phases tested for
mAb1, but the lowest for bsAb3. Similarly, Toyopearl AF-rProtein A
HC-650F had the lowest HCP for mAb1, but the highest for mAb3.
For DNA clearance, no trends were observed; however, Monofinity
A fared the best of all the stationary phases for all three proteins
tested. When comparing aggregate levels for mAb1 and mAb3 in
the elution pool across stationary phases, only small differences are
seen, whereas more variability was observed for the aggregate level
in the bsAb3 pools. Moreover, some trends in the bsAb3 data can
be seen where higher (Amsphere A3) or lower (MabSpeed rP202)
aggregate levels were observed in elution pools that had higher or
lower protein concentrations, respectively (concentration data not
shown).
When making comparisons between proteins, it was observed
that some proteins are not as easily purified from CCCB, and higher
levels of process- and product-related impurities are seen. Aside
from the exceptions noted above, impurity levels were quite consistent when comparing stationary phases and no trends were
observed based on stationary phases properties (e.g. higher binding
capacity vs. lower binding capacity; natural vs. synthetic polymeric backbone materials) or process performance data (e.g. yield,
pool volume, pool concentration). It should be noted that the
capture purification experiments in this work only employed a reequilibration step (50 mM Tris, 150 mM sodium chloride, pH 7.4);
however, a more stringent wash is often employed to reduce nonspecific interactions of HCP and stationary phases and/or HCP and
the protein of interest [58–60]. It is unclear if a more stringent wash
would benefit one stationary phase over another, but it is plausible
that this could occur and may merit investigation when developing
a Protein A capture step.
3.7. Bivariate correlation analysis
Fig. 6 shows a matrix of bivariate scatterplots correlating stationary phase morphological properties with protein binding and
mass transfer. The scatterplot matrix was generated using the
gplotmatrix function in MATLAB version R2014b. The diagonal
shows univariate histograms with the highest frequency bin normalized to full scale on the ordinate axis. Plots in the upper
left-hand quadrant are sparser as they correlate morphological properties to other morphological properties. Similar to the
approach described in protein mass transport above, εp,mAb3 was
T.M. Pabst et al. / J. Chromatogr. A 1554 (2018) 45–60
55
Fig. 5. Process performance and product quality obtained from capture of clarified cell culture broth for mAb1 (left panels), mAb3 (center panels), and bsAb3 (right panels)
on Protein A stationary phases.
used for the smaller molecules (mAb1-3, bsAb3, and Fc1), and
εp,bsAb1 was used for the larger molecules (bsAb1-2, Fc2-3).
Examining Fig. 6, it becomes apparent that EBC and DBC at
4 min residence time show the only strong correlation. Linear least
squares analysis of this bivariate scatter plot yields an R2 value
of 0.81 with a slope of 0.70 DBC/EBC. That EBC and DBC are well
correlated for such a diverse group of stationary phases and proteins suggests that different manufacturers have identified a similar
optimum of DBC as a fraction of total EBC utilization. This fraction
is represented by the slope of the line (0.70 DBC/EBC), meaning
approximately 70% of the available equilibrium binding capacity is
utilized at 4 min residence time. The fitted slope obtained by lin-
56
T.M. Pabst et al. / J. Chromatogr. A 1554 (2018) 45–60
Fig. 6. Matrix of bivariate scatterplots correlating stationary phase morphological properties with protein binding and mass transfer. The diagonal shows univariate histograms
with the highest frequency bin normalized to full scale on the ordinate axis.
ear least squares was in good agreement with the average value of
DBC/EBC for the entire dataset, which was calculated to be 0.68.
Lastly, as shown in the lower left-hand corner of Fig. 6, a subtler correlation was identified for De -values with particle size. For
stationary phases with a particle diameter <60 m, the average
De -value for all proteins tested was 1.3 × 10⁻⁸ cm2 /s. On the other
hand, for stationary phases >60 m in diameter, the average De value was more than double at 2.9 × 10⁻⁸ cm2 /s. This result further
highlights the complex balance that must be struck between mass
transport rates and other competing properties. In this case, smaller
bead sizes compensate for slower mass transfer. This may come at
the expense of higher column back pressure at a given flow rate. As
discussed by Müller and Vajda [35] and Hahn et al. [38], the results
of this study show that as advances are made in base matrix properties enabling a more favorable pressure-flow relationship and
hence use of smaller bead sizes, other aspects of stationary phase
design likely capitalize on these improvements to achieve optimal
performance. The complex nature of this optimization challenge is
elucidated further in the next section.
3.8. Considerations for process optimization and stationary phase
lifetime
Optimization of the Protein A capture step is critically important
to increase process productivity and reduce cost of goods for manufacturing. Productivity, defined as the amount of product purified
per unit time per unit column volume, is dependent on a complex
interplay of numerous parameters. For example, a Protein A cycle
may be optimized subject to the constraint that the entire unit
operation not exceed a specified length of time (e.g. a production
shift or within the specified CCCB hold time). Alternatively, column volume may be minimized to reduce stationary phase and raw
material costs. The extent to which a process can be optimized is
often heavily dependent on facility fit constraints such as available
column sizes, tank volumes, and skid capabilities. The optimization
strategy and parameter weightings are also likely to be different for
clinical versus commercial manufacturing.
Fig. 7 shows the impact of residence time on DBC for mAb1 and
column pressure on MabSelect SuRe LX, KanCapA 3G, MabSelect
PrismA, and Amsphere A3. These high capacity stationary phases
represent a diverse mix of properties likely to impact process
performance, including mass transfer rates (1.2–3.5 × 10⁻⁸ cm2 /s),
particle size (50–90 m), and base matrix material (synthetic vs.
natural polymers). In the figure, experimentally determined DBC at
2.4, 4, and 6 min residence times are shown with predicted DBC for
a 20 cm packed bed length constructed using the chromatography
general rate model and input parameters as described in Section
3.4, with the exception of diffusivity values which were obtained
from Table S2. As can be seen in Fig. 7, the model accurately predicts
DBC within a few percent of the experimental data and captures
the salient features of the DBC curve with a steep decrease at lower
residence times.
When optimizing Protein A productivity, a compromise is often
made between increasing mobile phase velocity to minimize cycle
time at the expense of DBC. Several groups have published models for Protein A productivity as a function of residence time; given
similar assumptions and constraints, these models show maximum
productivity at residence times less than 1.5 minutes for batch processing [40,61,62]. Similar residence time ranges have also been
reported as optimal for continuous or semi-continuous processing
T.M. Pabst et al. / J. Chromatogr. A 1554 (2018) 45–60
57
Fig. 7. Column DBC and pressure curves as a function of residence time. Experimental DBC values obtained from Table S1. Predicted DBC curves constructed using the
chromatography general rate model to simulate breakthrough behavior with a 20 cm packed bed length; input parameters as described in Section 3.4, and diffusivity values
obtained from Table S2. Predicted pressure curves were constructed using Eq. (3) with parameters given in Table 3 for a 20 cm packed bed length.
[46,63]. Examining Fig. 7, it is apparent that operating at residence times between 1–2 min lies in a region where DBC changes
rapidly in a nonlinear fashion. Comparing DBC at 1 and 2 min residence times, Amsphere A3 showed a DBC increase of 11 mg/mL
packed bed, while the other three stationary phases saw increases
of 18–22 mg/mL packed bed.
Fig. 7 also displays the column pressure predicted by Eq. (3) with
parameters given in Table 3. The equation assumes a linear relationship between flow rate and pressure, which is acceptable for the
small-scale columns used in this work; however, this assumption
becomes invalid for semi-rigid media as the column is scaled-up
and loses wall support. It is worth noting that while the pressureflow relationship shown on Fig. 7 is linear with flowrate, it is
non-linear with residence time. When operating at process-scale
with much larger diameter columns, the pressure-flow curve will
to shift to the right, potentially limiting the maximum operational
flow rate and hence productivity [61,64–66]. Additional constraints
may be imposed due to the specific nature of the manufacturing
facility and equipment, such as pressure rating on process-scale
equipment and increases in viscosity for chilled manufacturing
suites. Moreover, certain Protein A operations may be susceptible
to higher viscosity during elution due to phase separation behavior
at locally high concentration [67].
To overcome these limitations, packed bed height can be
reduced. However, given the constraint of a fixed column diameter,
this will reduce the column volume likely increasing the number
of column cycles, which is unattractive due to an increase in fixed
processing time for steps such as equilibration and cleaning. If column size is not a constraint, it may still be unattractive to increase
diameter as large columns often require permanent installation
in a manufacturing suite and will also increase capital equipment
costs. Regardless of the assumptions and constraints, given that
both DBC and pressure are likely to change rapidly and nonlinearly over the residence time range of interest, optimization models
are expected to be very sensitive to relatively small variations in
these parameters. In particular, as stationary phase manufacturers
trend toward smaller bead sizes to overcome mass transport limitations, the pressure-flow relationship will have a greater influence
on optimization outcomes. Therefore, to fully answer the question
of optimal Protein A process design, in addition to results presented
in this work, high quality pressure-flow data from process-scale
columns combined with predictive models for packed beds of semirigid media are also necessary to reach a fundamentally sound
conclusion [61,64–66].
In most commercial bioprocess scenarios, it is understood that
the cost of Protein A must be distributed over numerous individual lots to reduce manufacturing costs to an acceptable level. Even
when good stationary phase lifetime is achieved, often exceeding 150 cycles, cost of goods for manufacturing is usually more
sensitive to Protein A capture column costs when compared to
other purification process unit operations. Other groups have studied performance of Protein A stationary phases during column
cycling, reporting lower DBC and yield, increased elution pool volumes, as well as increased impurity levels in the Protein A elution
pool [68–73]. In general, the loss of chromatographic performance
was attributed to damage to the ligand under alkaline conditions
or fouling of the resin by proteinaceous material. Therefore, the
cleaning and sanitization protocols employed play a crucial role in
58
T.M. Pabst et al. / J. Chromatogr. A 1554 (2018) 45–60
obtaining acceptable stationary phase lifetime. Nevertheless, ligand stability and the ability to clean Protein A stationary phases
after repeated exposure to CCCB is beyond the scope of this work
as it is heavily dependent on the specific nature of the protein of
interest, composition of the CCCB feedstock (e.g. complex vs chemically defined cell culture media), process hardware, and operating
conditions chosen.
To elucidate stability under alkaline conditions, data provided
by the manufacturers can shed light on the potential loss of DBC.
Under standard cleaning conditions (0.1 N sodium hydroxide with
15 minutes of contact time per cycle is common), manufacturers
evaluated in this study claim minimal loss of DBC over stationary
phase lifetime and low levels of leached Protein A ligand in subsequent cycles. MabSelect PrismA is currently the only example
where the manufacturer suggests routine cleaning with up to 1 N
sodium hydroxide while showing minimal loss of DBC and low levels of ligand leaching up to 175 cycles. In many cases, the cycling
data provided by manufacturers is performed under artificial settings in the absence of CCCB, and the loss of DBC is strictly a function
of the loss of (or damage to) the base labile Protein A ligand. In a
more realistic bioprocess scenario where the Protein A stationary
phase is subjected to repeated cycling with a cruder feed stream,
one must also consider fouling of the stationary phase as well
as increased non-specific binding of process- and product-related
impurities over the lifetime of the stationary phase.
4. Conclusions
This work provides a comprehensive evaluation of Protein A stationary phases using a panel of mAbs, bsAbs, and Fc-fusion proteins.
Morphological properties of stationary phases were characterized
using a variety of orthogonal techniques, including TEM, particle
sizing, pressure-flow behavior, and isocratic pulse response. These
results show highly porous particles with particle diameters consistent with manufacturer’s data. Equilibrium isotherms were found
to be highly favorable, and EBCs averaged 52–92 mg/mL packed bed
across all mAbs and bsAbs for a given stationary phase. EBCs were
lower for the larger Fc-fusion proteins, averaging 25–49 mg/mL
packed bed. The stationary phases also had high DBCs for mAbs
and bsAbs, broadly falling into three groups. The first group of stationary phases (MabSelect SuRe pcc and MabSelect PrismA) had
DBCs which averaged 62–66 mg/mL packed bed across all mAbs and
bsAbs at 4 min residence times. The next group (KanCapA 3G, Toyopearl AF-rProtein A HC-650F, MabSelect SuRe LX, Praesto AP, and
Amsphere A3) averaged 50–53 mg/mL packed bed, and the remaining stationary phases average 39–45 mg/mL packed bed. Groupings
of resins were similar for the larger Fc-fusion proteins but DBCs
were roughly one third of those determined for mAbs and bsAbs.
Effective pore diffusivities were obtained by fitting the general rate
model to breakthrough data. The fitted De -values for mAbs ranged
from 1.1–5.7 × 10⁻⁸ cm2 /s. Not surprisingly, the larger bsAbs and
Fc-fusion proteins showed lower De -values.
Elution behavior was evaluated using linear pH gradient elution, and the resulting pH at which elution occurred was nearly
identical for all proteins on a given stationary phase except for
Fc3, which eluted 0.3–0.5 pH unit higher than all other proteins.
Only slight variations in the elution pH were observed between stationary phases, with Toyopearl AF-rProtien A HC-650F requiring a
lower pH (∼0.3 pH units lower), and MabSpeed rP202 eluting at a
higher pH (∼0.4 pH units higher). Stationary phases were evaluated
in a capture setting using clarified cell culture broth as a feedstock.
The resulting product yields were high, while elution pool volumes
ranged from 2–3 column volumes in most cases. HCP, DNA, and
aggregate levels in the elution pool were dependent on the spe-
cific nature of protein being purified, and levels were consistent
between stationary phases.
Bivariate correlation analysis was performed to elucidate the
relationship between stationary phase morphological properties,
protein adsorption, and mass transfer. The results of this analysis
demonstrate a linear correlation between EBC and DBC at 4 min residence time across a wide range of proteins and stationary phases.
Lastly, our findings suggest as Protein A stationary phase manufacturers trend toward smaller bead sizes to overcome mass transfer
limitations, pressure-flow behavior in process-scale columns will
have a greater influence on optimization outcomes, particularly for
short residence time ranges previously identified by other groups
as probable optima.
Conflict of interest statement
The authors declare no conflict of interest. The stationary phases
evaluated in this study were purchased commercially or obtained
as samples without restrictions on use or publication. No parties external to MedImmune participated in preparation of this
manuscript or approved disclosure of its contents.
Acknowledgements
We would like to thank many collaborators at MedImmune for
making this work possible; including, Lindsay Arnold, Wai Keen
Chung, Chris Thompson, Matt Aspelund, Paul Santacroce, and Chris
Afdahl for providing proteins used in this study; Arsala Wallace,
Njanma Amadi-Obi, and Jon Borman for analytical testing; and
Dana Motabar for review of the manuscript. We thank Al Inman
and Robert Keys at Charles River Pathology Associates for TEM
imaging. We owe a special thanks to Eric von Lieres and the entire
CADET team for making this valuable computational tool available to the scientific community. Lastly, we are very grateful to
William Wang (at MedImmune) for his support, encouragement,
and detailed review of this manuscript.
Appendix A. Supplementary data
Supplementary data associated with this article can be found,
in the online version, at />060.
References
[1] D.M. Ecker, S.D. Jones, H.J. Levine, The therapeutic monoclonal antibody
market, MAbs 7 (2015) 9–14.
[2] U. Brinkmann, R.E. Kontermann, The making of bispecific antibodies, MAbs 9
(2017) 182–212.
[3] C. Sheridan, Despite slow progress, bispecifics generate buzz, Nat. Biotechnol.
34 (2016) 1215–1217.
[4] A. Beck, L. Goetsch, C. Dumomtet, N. Corvaïa, Strategies and challenges for the
next generation of antibody–drug conjugates, Nat. Rev. Drug Discov. 16
(2017) 315–337.
[5] S. Hober, K. Nord, M. Linhult, Protein A chromatography for antibody
purification, J. Chromatogr. B 848 (2007) 40–47.
[6] S. Ghose, M. Allen, B. Hubbard, C. Brooks, S.M. Cramer, Antibody variable
region interactions with Protein A: implications for the development of
generic purification processes, Biotech. Bioeng. 92 (2005) 665–673.
[7] S. Ghose, B. Hubbard, S.M. Cramer, Binding capacity differences for antibodies
and Fc-fusion proteins on Protein A chromatographic materials, Biotech.
Bioeng. 96 (2007) 768–779.
[8] S. Ghose, T. McNerney, B. Hubbard, Protein A affinity chromatography for
capture and purification of monoclonal antibodies and Fc-fusion proteins:
practical considerations for process development, in: A.A. Shukla, M.R. Etzel,
S. Gadam (Eds.), Process Scale Bioseparations for the Biopharmaceutical
Industry, CRC, Press, Boca Raton, FL, 2006, pp. 463–490.
[9] S. Vunnum, G. Vedantham, B. Hubbard, Protein A-based affinity
chromatography, in: U. Gottschalk (Ed.), Process Scale Purification of
Antibodies, John Wiley & Sons, Hoboken, NJ, 2009, pp. 79–102.
T.M. Pabst et al. / J. Chromatogr. A 1554 (2018) 45–60
[10] A.A. Shukla, B. Hubbard, T. Tressel, S. Guhan, D. Low, Downstream processing
of monoclonal antibodies – application of platform approaches, J.
Chromatogr. B 848 (2007) 28–39.
[11] B. Kelley, Industrialization of mAb production technology: the bioprocessing
industry at a crossroads, MAbs 1 (2009) 443–452.
[12] H.F. Liu, J. Ma, C. Winter, R. Bayer, Recovery and purification process
development for monoclonal antibody production, MAbs 2 (2010) 1–20.
[13] A.A. Shukla, L.S. Wolfe, S.S. Mostafa, C. Norman, Evolving trends in mAb
production processes, Bioeng. Transl. Med. 2 (2017) 58–69.
[14] M. Urmann, H. Graalfs, M. Joehnck, L.R. Jacob, C. Frech, Cation-exchange
chromatography of monoclonal antibodies: characterization of a novel
stationary phase designed for production-scale purification, MAbs 2 (2010)
395–404.
[15] Y. Tao, A. Ibraheem, L. Conley, D. Cecchini, S. Ghose, Evaluation of
high-capacity cation exchange chromatography for direct capture of
monoclonal antibodies from high-titer cell culture processes, Biotechnol.
Bioeng. 111 (2014) 1354–1364.
[16] S. Ghose, B. Hubbard, S.M. Cramer, Evaluation and comparison of alternatives
to Protein A chromatography mimetic and hydrophobic charge induction
chromatographic stationary phases, J. Chromatogr. A 1122 (2006) 144–152.
[17] J. Pezzini, G. Joucla, R. Gantier, M. Toueille, A.-M. Lomenech, C. Le Sénéchal, B.
Garbay, X. Santarelli, C. Cabanne, Antibody capture by mixed-mode
chromatography: a comprehensive study from determination of optimal
purification conditions to identification of contaminating host cell proteins, J.
Chromatogr. A 1218 (2011) 8197–8208.
[18] G. Joucla, C. Le Sénéchal, M. Bégorre, B. Garbay, X. Santarelli, C. Cabanne,
Cation exchange versus multimodal cation exchange resins for antibody
capture from CHO supernatants: Identification of contaminating Host Cell
Proteins by mass spectrometry, J. Chromatogr. B 942–943 (2013) 126–133.
[19] M. DiLeo, A. Ley, A.E. Nixon, J. Chen, Choices of capture chromatography
technology in antibody manufacturing processes, J. Chromatogr. B 1068–1069
(2017) 136–148.
[20] P. McDonald, C. Victa, L. Franklin-Carter, R. Fahrner, Selective antibody
precipitation using polyelectrolytes: a novel approach to the purification of
monoclonal antibodies, Biotechnol. Bioeng. 102 (2009) 1141–1151.
[21] Y. Brodsky, C. Zhang, Y. Yigzaw, G. Vedanthan, Caprylic acid precipitation
method for impurity reduction: an alternative to conventional
chromatography for monoclonal antibody purification, Biotechnol. Bioeng.
109 (2012) 2589–2598.
[22] R. Sommer, A. Tscheilessnig, P. Satzer, H. Schultz, B. Helk, A. Jungbauer,
Capture and intermediate purification of recombinant antibodies with
combined precipitation methods, Biochem. Eng. J. 93 (2015) 200–215.
[23] A. Azevedo, P.A.J. Rosa, I.F. Ferreira, M.R. Aires-Barros, Chromatography-free
recovery of biopharmaceuticals through aqueous two-phase processing,
Trends Biotehnol. 27 (2009) 240–247.
[24] D. Platis, N.E. Labrou, Application of a PEG/salt aqueous two-phase partition
system for the recovery of monoclonal antibodies from unclarified transgenic
tobacco extract, Biotechnol. J. 4 (2009) 1320–1327.
[25] P.A.J. Rosa, A. Azevedo, S. Sommerfeld, M. Mutter, W. Bäcker, M.R.
Aires-Barros, Continuous purification of antibodies from cell culture
supernatant with aqueous two-phase systems: from concept to process,
Biotechnol. J. 8 (2013) 352–362.
[26] G. Bolton, K.K. Mehta, The role of more than 40 years of improvement in
Protein A chromatography in the growth of the therapeutic antibody
industry, Biotechnol. Prog. 32 (2016) 1193–1202.
[27] H.K. Kim, V. Thammavongsa, O. Schneewind, D. Missiakas, Recurrent
infections and immune evasion strategies of Staphylococcus aureus, Curr.
Opin. Microbiol. 15 (2012) 92–99.
[28] A. Surolia, D. Pain, M.I. Khan, Protein A: nature’s universal anti-antibody,
Trends Biochem. Sci. 7 (1982) 74–76.
[29] H. Gouda, M. Shiraishi, H. Takahashi, K. Kato, H. Torigoe, Y. Arata, I. Shimada,
NMR study of the interaction between the B domain of Staphylococcal Protein
A and the Fc portion of Immunoglobulin G, Biochemistry 37 (1998) 129–136.
[30] G. Silverman, B cell superantigens: possible roles in immunodeficiency and
autoimmunity, Semin. Immunol. 10 (1998) 43–55.
[31] M. Linhult, S. Gülich, T. Gräslund, A. Simon, M. Karlsson, A. Sjöberg, K. Nord, S.
Hober, Improving the tolerance of a Protein A analogue to repeated alkaline
exposures using a bypass mutagenesis approach, Proteins: Struct. Funct.
Bioinf. 55 (2004) 407–416.
[32] B. Kelley, Very large scale monoclonal antibody purification: the case for
conventional unit operations, Biotechnol. Prog. 23 (2007) 995–1008.
[33] M. Trexler-Schmidt, S. Sze-Khoo, A.R. Cothran, B.Q. Thai, S. Sargis, B. Lebreton,
B. Kelley, G.S. Blank, Purification strategies to process 5 g/L titers of
monoclonal antibodies, Biopharm. Int. (Suppl. March) (2009).
[34] M. Freiherr von Roman, S. Berensmeier, Improving the binding capacities of
Protein A chromatographic materials by means of ligand polymerization, J.
Chromatogr. A 1347 (2014) 80–86.
[35] E. Müller, J. Vajda, Routes to improve binding capacities of affinity resins
demonstrated for Protein A chromatography, J. Chromatogr. B 1021 (2016)
159–168.
[36] J.T. McCue, G. Kemp, D. Low, I. Quinones-García, E valuation of protein-A
chromatography media, J. Chromatogr. A 989 (2003) 139–153.
[37] R. Hahn, R. Schlegel, A. Jungbauer, Comparison of Protein A affinity sorbents, J.
Chromatogr. B 790 (2003) 35–51.
59
[38] R. Hahn, P. Bauerhansl, K. Shimahara, C. Wizniewski, A. Tscheliessnig, A.
Jungbauer, Comparison of Protein A affinity sorbents: II. Mass transfer
properties, J. Chromatogr. A 1093 (2005) 98–110.
[39] E.X. Perez-Almodovar, G. Carta, IgG adsorption on a new protein A adsorbent
based on microporous hydrophilic polymers, I. Adsorption equilibrium and
kinetics, J. Chromatogr. A 1216 (2009) 8339–8347.
[40] Z. Liu, S.S. Mostafa, A.A. Shukla, A comparison of Protein A chromatographic
stationary phases: performance characteristics for monoclonal antibodies,
Biotechnol. Appl. Biochem. 62 (2015) 37–47.
[41] S. Schweiger, S. Hinterberger, A. Jungbauer, Column-to-column packing
variation of disposable pre-packed columns for protein chromatography, J.
Chromatogr. A 1527 (2017) 70–79.
[42] R.B. Bird, W.E. Stewart, E.N. Lightfoot, Transport Phenomena, Wiley, New
York, 1960.
[43] L. Hagel, M. Ostberg, T. Andersson, Apparent pore size distributions of
chromatography media, J. Chromatogr. A 743 (1996) 33–42.
[44] P.G. Squire, Calculation of hydrodynamic parameters of random coil polymers
from size exclusion chromatography and comparison with parameters by
conventional methods, J. Chromatogr. 210 (1981) 433–442.
[45] C.K.S. Ng, H. Osuna-Sanchez, E. Valéry, E. Sørensen, D.G. Bracewell, Design of
high productivity antibody capture by protein A chromatography using an
integrated experimental and modeling approach, J. Chromatogr. B 899 (2012)
116–126.
[46] C.K.S. Ng, F. Rousset, E. Valéry, D.G. Bracewell, E. Sørensen, Design of high
productivity sequential multi-column chromatography for antibody capture,
Food Bioprod. Process. 92 (2014) 233–241.
[47] J.M. Reck, T.M. Pabst, A.K. hunter, G. Carta, Separation of antibody
monomer-dimer mixtures by frontal analysis, J. Chromatogr. A 1500 (2017)
96–104.
[48] E. von Lieres, J. Andersson, A fast and accurate solver for the general rate
model of column liquid chromatography, Comput. Chem. Eng. 34 (2010)
1180–1191.
[49] />[50] G. Carta, A. Jungbauer, Protein Chromatography, 1st ed., Wiley-VCH,
Germany, 2010, pp. 75–76.
[51] B.D. Bowes, A.M. Lenhoff, Protein adsorption and transport in
dextran-modified ion-exchange media. II. Intraparticle uptake and column
breakthrough, J. Chromatogr. A 1218 (2011) 4698–4708.
[52] J.J. Carberry, A boundary-layer model of fluid-particle mass transfer in fixed
beds, AIChE J. 6 (1960) 460–463.
[53] A.A. Shukla, P. Gupta, X. Han, Protein aggregation kinetics during Protein A
chromatography: case study for an Fc fusion protein, J. Chromatogr. A 1171
(2007) 22–28.
[54] T.M. Pabst, R. Palmgren, A. Forss, J. Vasic, M. Fonseca, C. Thompson, W.K.
Wang, X. Wang, A.K. Hunter, Engineering of novel Staphylococcal Protein A
ligands to enable milder elution pH and high dynamic binding capacity, J.
Chromatogr. A 1362 (2014) 180–185.
[55] S. Gülich, M. Ulhén, S. Hober, Protein engineering of an IgG-binding domain
allows milder elution conditions during affinity chromatography,
J.Biotechnol. 76 (2000) 233–244.
[56] N.L. Brown, S.P. Bottomley, M.D. Scawen, M.G. Gore, A study of the
interactions between an IgG-binding domain based on the B domain of
Staphylococcal Protein A and rabbit IgG, Mol. Biotechnol. 10 (1998) 9–16.
[57] H. Watanabe, H. Matsumaru, A. Ooishi, S. Honda, Structure-based histidine
substitution for optimizing pH-sensitive Staphylococcus protein A, J.
Chromatogr. B 929 (2013) 155–160.
[58] A.A. Shukla, P. Hinckley, Host cell protein clearance during Protein A
chromatography: development of an improved column wash step,
Biotechnol. Prog. 24 (2008) 1115–1121.
[59] B. Nogal, K. Chhiba, J.C. Emery, Select host cell proteins coelute with
monoclonal antibodies in Protein A chromatography, Biotechnol. Prog. 28
(2012) 454–458.
[60] N. Aboulaich, W.K. Chung, J. Heidbrink Thompson, C. Larkin, D. Robbins, M.
Zhu, A novel approach to monitor clearance of host cell proteins associated
with monoclonal antibodies, Biotechnol. Prog. 30 (2014) 1114–1124.
[61] E.X. Perez-Almodovar, G. Carta, IgG adsorption on a new protein A adsorbent
based on microporous hydrophilic polymers. II. Pressure–flow curves and
optimization for capture, J. Chromatogr. A 1216 (2009) 8348–8354.
[62] K. Swinnen, A. Krul, I. Van Goidsenhoven, N. Van Tichelt, A. Roosen, K. Van
Houdt, Performance comparison of protein A affinity resins for the
purification of monoclonal antibodies, J. Chromatogr. B 848 (2007) 97–107.
[63] V. Girard, N. Hilbold, C.K.S. Ng, L. Pegon, W. Chahim, F. Rousset, V. Monchois,
Large-scale monoclonal antibody purification by continuous chromatography,
from process design to scale-up, J. Biotechnol. 213 (2015) 65–73.
[64] J.J. Stickel, A. Fotopoulos, Pressure-flow relationships for packed beds of
compressible chromatography media at laboratory and production scale,
Biotechnol. Prog. 17 (2001) 744–751.
[65] J.T. McCue, D. Cecchini, C. Chu, W. Liu, A. Spann, Application of a
two-dimensional model for predicting the pressure-flow and compression
properties during column packing scale-up, J. Chromatogr. A 1145 (2007)
89–101.
[66] R.N. Keener III, E.J. Fernandez, J.E. Maneval, R.A. Hart, Advancement in the
modeling of pressure-flow for the guidance of development and scale-up of
commercial-scale biopharmaceutical chromatography, J. Chromatogr. A 1190
(2008) 127–140.
60
T.M. Pabst et al. / J. Chromatogr. A 1554 (2018) 45–60
[67] H. Luo, N. Lee, X. Wang, Y. Li, A. Schmelzer, A.K. Hunter, T. Pabst, W.K. Wang,
Liquid-liquid phase separation causes high turbidity and pressure during low
pH elution process in Protein A chromatography, J. Chromatogr. A 1488
(2017) 57–67.
[68] R. Hahn, K. Shimahara, F. Steindl, A. Jungbauer, Comparison of protein A
affinity sorbents III. Life time study, J. Chromatogr. A 1102 (2006) 224–231.
[69] C. Jiang, J. Liu, M. Rubacha, A.A. Shukla, A mechanistic study of Protein A
chromatography resin lifetime, J. Chromatogr. A 1216 (2009) 5849–5855.
[70] A. Grönberg, M. Eriksson, M. Ersoy, H.J. Johansson, A tool for increasing the
lifetime of chromatography resins, mAbs 3 (2011) 192–202.
[71] S. Zhang, W. Daniels, J. Salm, J. Glynn, J. Martin, C. Gallo, R. Godavarti, G. Carta,
Nature of foulants and fouling mechanism in the Protein A MabSelect resin
cycled in a monoclonal antibody purification process, Biotechnol. Bioeng. 113
(2016) 141–149.
[72] S. Zhang, K. Xu, W. Daniels, J. Salm, J. Glynn, J. Martin, C. Gallo, R. Godavarti, G.
Carta, Structural and functional characteristics of virgin and fouled Protein A
MabSelect resin cycled in a monoclonal antibody purification process,
Biotechnol. Bioeng. 113 (2016) 367–375.
[73] M. Pathak, A.S. Rathore, Mechanistic understanding of fouling of protein A
chromatography resin, J. Chromatogr. A 1459 (2016) 78–88.