Electromembrane extraction of streptomycin from biological fluids
Bạn đang xem bản rút gọn của tài liệu. Xem và tải ngay bản đầy đủ của tài liệu tại đây (1.86 MB, 9 trang )
Journal of Chromatography A 1639 (2021) 461915
Contents lists available at ScienceDirect
Journal of Chromatography A
journal homepage: www.elsevier.com/locate/chroma
Electromembrane extraction of streptomycin from biological fluids
Frederik André Hansen a, Stig Pedersen-Bjergaard a,b,∗
a
b
Department of Pharmacy, University of Oslo, P.O. Box 1068 Blindern, 0316 Oslo, Norway
Department of Pharmacy, Faculty of Health and Medical Sciences, University of Copenhagen, Universitetsparken 2, 2100 Copenhagen, Denmark
a r t i c l e
i n f o
Article history:
Received 2 December 2020
Revised 11 January 2021
Accepted 16 January 2021
Available online 21 January 2021
Keywords:
Electromembrane extraction
Polar base
Streptomycin
Biological samples
Hydrophilic interaction liquid
chromatography – mass spectrometry
a b s t r a c t
In this fundamental study, streptomycin was extracted successfully from urine and plasma using electromembrane extraction (EME). Streptomycin is an aminoglycoside with log P -7.6 and was selected as
an extremely polar model analyte. EME is a microextraction technique, where charged analytes are extracted under the influence of an electrical field, from sample, through a supported liquid membrane
(SLM), and into an acceptor solution. The SLM comprised 2-nitrophenyl pentyl ether (NPPE) mixed with
bis(2-ethylhexyl) phosphate (DEHP). DEHP served as ionic carrier and facilitated transfer of streptomycin
across the SLM. For EME from urine and protein precipitated plasma, the optimal DEHP content in the
SLM was 45–50% w/w. From untreated plasma, the content of DEHP was increased to 75% w/w in order
to suppress interference from plasma proteins. Most endogenous substances with UV absorbance were
not extracted into the acceptor. Proteins and phospholipids were also discriminated, with <0.6% of proteins and <0.02% of phospholipids found in the acceptor after EME. Thus, despite the fact that the SLM
was permeable to more polar molecules, the EME still provided very efficient sample cleanup. Extraction
process efficiencies of 98% and 61% were achieved from urine and plasma, respectively, with linear calibration (R2 > 0.9929), absence of significant matrix effects (94–112%), accuracy of 94–125%, and RSD ≤
15% except at LLOQ. The average current during extractions was 67 μA or less. The findings of this paper
demonstrated that EME is feasible for extraction of basic analytes of extreme polarity.
© 2021 The Author(s). Published by Elsevier B.V.
This is an open access article under the CC BY license ( />
1. Introduction
For more than two decades, microextraction has been a major
point of research focus within analytical chemistry. Electromembrane extraction (EME) is an example, suited for selective extraction of ionizable compounds from complex biological and environmental samples [1]. In EME, the sample solution is separated from
a clean acceptor solution by means of a supported liquid membrane (SLM), comprising a water-immiscible (hydrophobic) solvent
immobilized in the pores of a supporting polymeric membrane.
The aqueous solutions are pH adjusted to favor ionization of the
target analytes, and extraction is based on application of an electric field across the SLM. The process may thus be considered as
electrophoresis across an oil membrane. EME is an attractive technique for selective extraction, since selectivity is based on analyte
charge and partitioning.
Since the introduction of EME in 2006 [2], focus has been diverted to successful extraction of non-polar (log P 2 to 5) [3-6] and
moderately polar (log P 0 to 2) [7-10] analytes. Due to effective
∗
Corresponding author.
E-mail address: (S. Pedersen-Bjergaard).
discrimination of polar matrix constituents by the SLM, excellent
sample cleanup has been obtained. In recent years, increasing attention has been drawn to the application of EME for extraction of
polar (−2 < log P < 0) and highly polar analytes (−5 < log P <
−2). Polar and highly polar analytes are challenging with most extraction techniques due to poor partition, and this is also the case
with EME. Even with a high electrical field across the sample-SLM
interface, transfer of polar and highly polar cationic or anionic analytes across the interface may be limited. Recently, bases with log
P −5.7 to +1.5 were extracted successfully [11-13], and based on
this EME was recently mentioned as one of the more promising
microextraction techniques for polar and highly polar compounds
[14]. Development of suitable EME methods for polar, highly polar, extremely polar (log P < −5) compounds may be very attractive for metabolomics [15], peptidomics [16], and for environmental sciences [17]. However, for such research and development to
be successful, more experiences are required. Especially, we need
to understand (a) how to design the SLMs, (b) if extremely polar
analytes can be extracted, and (c) if such EME systems provide acceptable selectivity and cleanup from complex real samples.
In this work, we selected streptomycin as a model analyte of
extreme polarity, to address the research questions above. Strepto-
/>0021-9673/© 2021 The Author(s). Published by Elsevier B.V. This is an open access article under the CC BY license ( />
F.A. Hansen and S. Pedersen-Bjergaard
Journal of Chromatography A 1639 (2021) 461915
(DEHP), ammonium acetate, formic acid, citric acid, disodium
hydrogen phosphate, phosphoric acid (85%), streptomycin sulfate, and dihydrostreptomycin sesquisulfate were purchased from
Merck (Darmstadt, Germany). Bovine serum albumin (PierceTM )
was purchased from Thermo Scientific (Waltham, MA, USA), and
Coomassie dye reagent was purchased from Bio-Rad Laboratories
(Hercules, CA, USA). Plasma samples were obtained from Oslo University Hospital (Oslo, Norway) and stored at −28 °C. Urine samples were obtained from a healthy volunteer and stored at −28 °C.
2.2. Preparation of solutions
2.2.1. Standards
Streptomycin sulfate and dihydrostreptomycin sesquisulfate (internal standard - IS) were dissolved individually in MQ water at
2 mg mL−1 and frozen in aliquots at −28 °C. From these, working
solutions were prepared daily and used for spiking of standards
and biological samples.
2.2.2. Buffer solutions for sample adjustment
Buffers in the pH range 2.5–7.3 were prepared as 50 mM citrate/hydrogen phosphate solutions, also known as the McIlvaine
buffer [21]. Solutions were prepared by titrating 50 mM citric acid
with 50 mM disodium hydrogen phosphate to the desired pH, verified by a pH-meter.
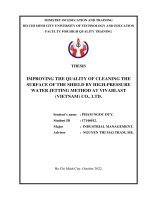
Fig. 1. Chemical structure of streptomycin and dihydrostreptomycin (IS). The redcolored groups indicates the difference of the structures.(For interpretation of the
references to color in this figure legend, the reader is referred to the web version
of this article.)
mycin is an aminoglycoside. Aminoglycosides are antibiotics used
against gram-negative bacteria causing diseases like tuberculosis,
and act by inhibiting the bacteria protein synthesis. Chemically, the
structures are based on glycosides with amine-based modifications
that make the molecules very hydrophilic, and thus very challenging to extract with equilibrium-based microextraction techniques
[15]. Streptomycin is listed by the World Health Organization as
critically important for human medicine [18]. It is therefore of high
importance to have efficient analytical-scale sample preparation
methods that can provide good cleanup of streptomycin from complex matrices. The chemical structure of streptomycin is shown in
Fig. 1. The log P value is −7.6, but since streptomycin carries three
positive charges at pH < 7.4, the effective distribution coefficient
(log D) is rather −12.0 under physiological conditions [19]. Additionally, the pH window where streptomycin is uncharged is very
narrow. The typical strategy for enhanced extraction of polar bases
into a hydrophobic phase by raising the pH above the pKa value is
therefore not feasible. Historically, extraction of streptomycin and
other aminoglycosides has been performed by solid-phase extraction, using either cation-exchangers, C18 sorbents with added ionpair reagent, and hydrophilic-lipophilic-balance sorbents [20].
The current paper contributes with new experiences and
knowledge related to EME of extremely polar substances. EME
was combined with hydrophilic interaction liquid chromatography (HILIC) coupled to tandem mass spectrometry (MS/MS). Initially, different solvents were screened to identify a suitable SLM.
Subsequently, the effect of sample pH and SLM composition for
urine and plasma samples was studied by means of a designof-experiments (DOE) approach. Finally, the data reliability of the
proposed EME system was evaluated. The paper is a fundamental
study, and the conclusions are of high importance for further development of EME.
2.2.3. Deep eutectic solvent preparation
Deep eutectic solvents composed of coumarin and thymol were
prepared by weighing appropriate amounts of each component
into a 5 mL Eppendorf-tube. The amounts weighed depended on
the desired molar ratio. The melting of the mixture was assisted
by heating in an 80 °C oven for 15 min. After complete melting,
the solvent was vortexed for 10 s to ensure homogeneity.
2.2.4. Protein precipitation procedure
500 μL thawed plasma was added to 10 0 0 μL ACN, vortexed at
1800 RPM for 1 min, and centrifuged at 10,000 RPM for 3 min.
10 0 0 μL supernatant was collected and evaporated to dryness under a flow of nitrogen gas in a heating block set to 40°C. The
residue was re-suspended in 667 μL McIlvaine buffer with variable
pH. This was equal to a 2-fold dilution of the original plasma concentration.
2.3. EME procedure
EME was performed in 96-well format with potential for high
throughput extraction. The setup is illustrated in Figure S1. It
comprised a sandwich of three plates. The bottom one was a
laboratory-built steel plate with 96 wells, each holding 100 μL
of sample. The second one was a commercially available 96-well
Multiscreen-IP filter plate (polyvinylidene fluoride (PVDF) membranes, 0.45 μm pores) from Merck Millipore Ltd (Carrigtwohill,
Ireland). The third one was a laboratory-built lid in aluminum with
96 rod electrodes. For each sample, 4 μL SLM solvent was pipetted onto the bottom of the PVDF filter, which resulted in immobilization of the solvent to yield the SLM. 100 μL sample solution was loaded into the corresponding well of the steel plate,
and the filter plate was clamped onto the steel plate, which put
the sample in contact with the SLM. 100 μL acceptor solution
(50 mM phosphoric acid pH 2.0) was loaded into the filter plate
well, and the aluminum lid was attached. Phosphoric acid was chosen because it has buffer capacity at pH 2. The whole device was
placed on a shaking board (Vibramax 100 Heidolph, Kellheim, Germany), which was set for 900 RPM based on previous optimization [13]. The steel plate and aluminum lid were then connected
to the anode and cathode, respectively, of a power supply (model
2. Experimental
2.1. Chemicals and reagents
Milli-Q (MQ) water was provided by an Integral 3 purification
system (Milli-Q, Molsheim, France). LC-grade methanol (MeOH),
LC-MS grade acetonitrile (ACN), 2-nitrophenyl octyl ether (NPOE),
2-nitrophenyl pentyl ether (NPPE), bis(2-ethylhexyl) phosphate
2
F.A. Hansen and S. Pedersen-Bjergaard
Journal of Chromatography A 1639 (2021) 461915
ES 0300e0.45, Delta Elektronika BV, Zierikzee, Netherlands). Extractions were initiated by simultaneous application of shaking and
voltage. A Fluke 287 multi-meter (Everett, WA, USA) monitored the
extraction current with an 8 Hz acquisition rate. When extraction
was finished, acceptor solutions were collected quantitatively and
mixed 1:1 with 1 M formic acid in acetonitrile. This was to eliminate adsorption of streptomycin and dihydrostreptomycin to the
glass walls of the HPLC vials, and to ensure compatibility of the
injection solvent with the HILIC-MS method used for quantitation.
For recovery studies, the acceptor solution was spiked with IS to
1 μg mL−1 after extraction to correct for LC-MS/MS variability.
phases consisted of (A) 95:5 v/v ACN:MQ-water with 5 mM ammonium acetate and 0.5% formic acid, and (B) 20:80 v/v ACN:MQwater with 5 mM ammonium acetate and 0.5% formic acid. Elution
was performed at 0.4 mL min−1 flowrate, using a gradient with
10% B for 0–1 min, 10–70% B in 1–5 min where it was maintained
for 1 min, and then returned to 10% B for 9 min re-equilibration.
The total run time was thus 15 min, and the injection volume was
2 μL. Aqueous samples were prior to injection diluted 1:1 with 1 M
formic acid in ACN to be compatible with HILIC conditions. For
mass spectrometer detection, a full scan (50–600 m/z) was formed
in both positive and negative electrospray ionization (ESI) mode.
The capillary temperature was set to 225°C.
2.4. LC-MS/MS and LC-UV methods
2.5. Total protein determination
2.4.1. HILIC-MS/MS method for streptomycin and dihydrostreptomycin
(IS) quantitation
Quantitation of streptomycin and dihydrostreptomyin (internal
standard) was performed with a Dionex UltiMate 30 0 0 RS UHPLC system comprising a pump, autosampler, and column compartment, with an LTQ XL linear ion-trap as detector (all from Thermo
Scientific, San Jose, CA, USA). The column was an Acquity UPLC®
BEH Amide column (150 × 2.1 mm ID, 1.7 μm) from Waters (Wexford, Ireland), and was maintained at 40 °C. The mobile phases
consisted of (A) 95:5 v/v ACN:MQ-water with 5 mM ammonium
acetate and 0.5% formic acid, and (B) 20:80 v/v ACN:MQ-water
with 5 mM ammonium acetate and 0.5% formic acid. Addition of
formic acid was important to maintain peak shapes. The flow was
kept at 0.3 mL min−1 , and elution was performed according the
following gradient: 55–75% B for 0–2 min, 75% B for 2–3 min, returned to 55% B in 0.1 min, and finally 4.9 min of re-equilibration.
The total run time was thus 8 min, and the injection volume was
5 μL. Detection was performed in positive electrospray ionization
mode by selected reaction monitoring (SRM) of streptomycin (transition m/z 582 → 540), and dihydrostreptomycin (transition m/z
584 → 542), both using 20% normalized collision energy. The capillary temperature was set at 350°C.
The total concentration of protein in plasma samples and acceptor solutions after extraction was determined according to the
Bradford assay [23]. For each measurement, 10 μL sample was
added to 200 μL Coomassie dye reagent in the wells of a microplate. Presence of protein induced an absorbance shift of the
dye from 465 nm to 595 nm. Absorbance measurements of each
well at 595 nm were performed after 5 min of incubation, using a
microplate reader (Wallac Victor 3, Perkin Elmer, Boston, MA, USA).
Calibration was performed with bovine serum albumin standards
of 0–400 μg mL−1 . Details of calibration are available in Supplementary information 3. Dilutions were made in 50 mM phosphoric
acid to match the acceptor solution. pH-related effects of the assay
were therefore not present. All measurements were performed in
duplicate.
2.6. Statistical design and analysis of experiments
Experimental designs and analysis by means of a design-ofexperiments (DOE) approach were handled using the software
Design-Expert 12 (Stat-Ease Inc., Minneapolis, MN, USA). Analysis and modeling were performed using multiple linear regression
(MLR) and analysis of variance (ANOVA) to assess significance of
effects. Regression of calibration curves was performed in GraphPad Prism version 9.0.
2.4.2. Phospholipid determination by reversed-phase LC-MS/MS
For determination of phospholipids, the same instrument described in Section 2.4.1 was used. An Acquity UPLCđ HSS T3 column (100 ì 2.1 mm ID, 1.8 μm) from Waters (Wexford, Ireland)
maintained at 60 °C was used as stationary phase. Mobile phases
consisted of (A) 95:5 v/v MQ-water:MeOH with 0.1% formic acid,
and (B) 5:95 v/v MQ-water:MeOH with 0.1% formic acid. Elution was performed using a gradient method with 0.4 mL min−1
flowrate, where 10% B initially was ramped to 100% in 0.3 min, and
kept for 12 min, before returning to 10% B in 0.1 min, for 2.6 min
of re-equilibration. The total run time was thus 15 min, and the
injection volume was 10 μL. Detection of phospholipids was accomplished using in-source fragmentation with selected reaction
monitoring (SRM) in positive electrospray ionization mode, based
on a previously reported method [22]. For this, a source potential
of 65 V and 10% normalized collision energy was applied, and the
transition m/z 184 → 184 was monitored. The capillary temperature was set at 350°C.
2.7. Calculations
For estimation of extraction efficiencies, IS was added to the acceptor solution after extraction, to account for variability in LC-MS
quantitation.
Extraction yield (EY,%) was defined as the recovery obtained for extraction from a standard buffer solution, and
calculated by the streptomycin/IS peak area ratio of the acceptor (AUCacceptor,final /AUCIS ) and non-extracted standard
(AUCnon−extracted standard /AUCIS ), according to (1).
EY =
Vsample
AUCacceptor,final /AUCIS
×
× 100 %
AUCnon−extracted standard /AUCIS
Vacceptor
(1)
Vsample and Vacceptor were the volumes of sample and acceptor
solution, respectively. For all extractions, these were both 100 μL.
Process efficiency (PE,%) was similarly defined as the ISadjusted acceptor signal obtained from a spiked biological matrix
(AUCacceptor,matrix /AUCIS ) relative to that of a non-extracted standard at the same concentration, and was calculated according to
(2).
2.4.3. HILIC-UV and full scan MS method for matrix clean-up
assessment
Biological samples were analyzed prior to and after EME to assess the clean-up efficiency of the extraction method. The analysis
was performed using a Dionex UltiMate 30 0 0 RS UHPLC system
equipped with a variable wavelength detector set at 254 nm, or
mass spectrometer detection. An Acquity UPLC® BEH Amide column (150 × 2.1 mm ID, 1.7 μm) from Waters (Wexford, Ireland)
maintained at 30 °C was used as stationary phase. The mobile
PE =
Vsample
AUCacceptor,matrix /AUCIS
×
× 100%
AUCnon−extracted standard /AUCIS
Vacceptor
(2)
Matrix effect (ME,%) was defined as the signal change of streptomycin caused by matrix components in the mass spectrometer
3
F.A. Hansen and S. Pedersen-Bjergaard
Journal of Chromatography A 1639 (2021) 461915
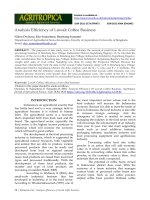
carrier, bis(2-ethylhexyl) phosphate (DEHP), was therefore added
to the three solvents at 10% and 30% w/w level, to introduce ionic
interactions. This resulted in exhaustive extraction with both DESs
containing 10% w/w DEHP and approximately 30% extraction yield
with NPPE containing 10% DEHP. The DESs containing 30% DEHP
were less efficient, and substantial amounts of streptomycin were
retained in the SLM. The DESs with 30% DEHP also provided excessive current during extraction, and therefore they were operated
at 3–5 V. In contrast, NPPE with 30% DEHP provided an extraction
yield of 70%, while the extraction current was maintained low even
at 50 V. This solvent system was therefore chosen for further study
and optimization.
Fig. 2. Extraction yield (%) of streptomycin using 0%, 10%, and 30% DEHP added to
1) NPPE, 2) coumarin:thymol 1.5:1, and 3) coumarin:thymol 1:2. Extraction time:
15 min; sample solution was 1 μg mL−1 streptomycin in pH 4.0; acceptor solution
was phosphoric acid pH 2.0. Voltage was varied depending on SLM solvent. Error
bars represent the standard deviation (n = 3).
3.2. Effect of matrix type on optimal extraction conditions
The screening of different SLM solvents revealed that DEHP
mixed with NPPE was suitable as SLM solvent, and the tested levels of DEHP indicated that increasing the amount of DEHP was
favorable to the extraction yield. However, the ion-paring mechanism of DEHP with analyte cations is dependent on sample pH
[13]. Under strongly acidic conditions (pH < 2.5) DEHP stays entirely in the SLM and acts by interfacial ion-pair formation with
analytes. At neutral and basic conditions (pH > 6.5), DEHP leaks
to a large extent into the sample solution, and ion-pairing thus
take place in bulk sample. In between these extremes, ion paring occurs by a combination of the two modes (mixed-mode complexation). The effects of sample pH and DEHP concentration in
the SLM are thus highly interconnected, and a central composite design was utilized for further optimization. In these experiments, the effect of (A) sample pH and (B)% DEHP were studied
for EME from samples of pure buffer, urine, protein precipitated
(PP) plasma, and untreated plasma. Details about the central composite design and the statistical analysis are given in Supplementary information 2. Briefly, the design included four factorial point,
four center points, and four axial points (α = 1.41) for a total of
12 runs performed in randomized order. Each run was performed
in triplicate, and the average extraction process efficiency (PE,%)
was used as the response. For pH adjustment, urine and protein
precipitated plasma were diluted 1:1 in buffer and simultaneously
spiked with streptomycin. Untreated plasma was, based on a few
preliminary experiments, diluted 1:4 in buffer and spiked simultaneously. All other experimental parameters such as extraction time
(15 min) and voltage (30 V) were kept constant, as the purpose of
this initial set of experiments was to investigate the interrelationship between sample pH and% DEHP from different sample matrices. The factor level settings for each matrix type are indicated
in Table 1. Following experimentation, the data were analyzed and
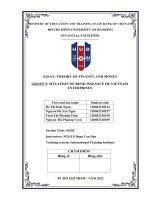
fitted to quadratic regression models. Fig. 3 shows the 2D contour
plots obtained for each sample matrix. As seen, the optimal settings in pure buffer were found at sample pH 4.5 and at 34% w/w
DEHP in NPPE. At higher pH, and at higher% DEHP, recovery decreased due to retention in the SLM. Conversely, at lower levels of
pH and DEHP, streptomycin remained in the sample.
When EME was conducted from urine and PP plasma (Fig. 3),
optimal conditions shifted towards higher sample pH and% DEHP.
Clearly, matrix components interacted with DEHP and caused interference. However, with increased sample pH and% DEHP, release of
DEHP into the sample increased for ion-paring with streptomycin,
and EME provided exhaustive extraction. For urine, optimal sample
pH was 5.5 and optimal amount of DEHP in the SLM was 50%. For
PP plasma, optimal conditions were found at sample pH 5.0 and
45% DEHP. In both cases, the EME system operated according to
the principle of mixed-mode complexation.
To identify the optimal DEHP content for untreated plasma,
the design-space had to be extended as shown in Table 1. The
corresponding contour plot is shown in Fig. 3. As seen, the op-
(ion suppression or enhancement), and was calculated according
to (3).
ME =
AUCpost extraction spiked matrix
× 100%
AUCnon−extracted standard
(3)
AUCpost extraction spiked matrix is the signal of streptomycin in a
post extraction spiked acceptor solution, after extraction of a blank
matrix sample.
3. Results and discussion
3.1. Selection of SLM solvent
In EME, the extraction selectivity is largely determined by the
SLM solvent. Highly polar analytes are easily discriminated from
extraction, unless the SLM solvent offers sufficiently strong interactions to overcome the hydrophobic discrimination by the nonpolar SLM solvent. In two recent reports, Drouin et al. successfully
used 2-nitrophenyl pentyl ether (NPPE) as SLM solvent for extraction of a variety of basic analytes in the range −5.7 < log P < 1.5
[11, 12]. The extraction system however operated under high current (~300 μA), and most analytes suffered from poor extraction
efficiency in complex samples. In another recent report, we investigated the use of deep eutectic solvents (DESs) as SLM [24]. DESs
based on mixtures of coumarin (hydrogen bond acceptor - HBA)
and thymol (hydrogen bond donor - HBD) provided exhaustive extraction of various moderately polar bases (log P −0.4 to +1.8). The
DESs provided strong hydrogen bonding and aromatic interactions
with the analytes.
These two solvent systems were tested for EME of streptomycin.
Two different DESs were prepared, namely coumarin mixed with
thymol in molar ratios 1.5:1 and 1:2 (coumarin:thymol molar ratio). The former with excess HBA and the latter with excess HBD
properties. The DESs and NPPE were initially tested as pure solvents at 50 V. Extraction conditions were based on previous experience. These are given in Fig. 2 along with recovery data. As
seen, recoveries were zero with the pure solvents. However, analysis of sample solutions after extraction (data not shown) revealed
that 40% of streptomycin was retained in the coumarin and thymol 1.5:1 SLM, and 20% was in the coumarin and thymol 1:2 SLM.
With pure NPPE, the entire content of streptomycin was found in
the sample after extraction. Streptomycin showed highest affinity
for the DES with excess HBA properties, and this is in agreement
with previous observations for basic analytes [25].
From experiments above, extraction of streptomycin was not efficient based on hydrogen bonding interactions alone. The ionic
4
F.A. Hansen and S. Pedersen-Bjergaard
Journal of Chromatography A 1639 (2021) 461915
Table 1
Coded and un-coded factor levels used for different sample matrices in central composite design.
Coded level
Buffer
Urine
PP plasma
Full plasma
−α
−1
+α
+1
0
pH
%DEHP
pH
%DEHP
pH
%DEHP
pH
%DEHP
pH
%DEHP
1.7
1.7
1.7
1.7
1.7
5.7
5.7
53.8
2.5
2.5
2.5
2.5
10
15
15
60
4.5
4.5
4.5
4.5
30
37.5
37.5
75
6.5
6.5
6.5
6.5
50
60
60
90
7.3
7.3
7.3
7.3
58
69.3
69.3
96.2
Fig. 3. 2D contour plots of (A) sample pH-value and (B)%DEHP/NPPE effect on process efficiency (%) of streptomycin extraction from different matrix types. The color
gradient indicates process efficiency from 0% to 100% for blue and red, respectively. Extraction time: 15 min; extraction voltage: 30 V; sample matrices were spiked to a
final concentration of 1 μg mL−1 streptomycin; acceptor solution was phosphoric acid pH 2.0. (For interpretation of the references to colour in this figure legend, the reader
is referred to the web version of this article.)
timal amount of DEHP was very high (~75% w/w), and the estimated process efficiency was only 22% under these conditions.
Since plasma protein binding of streptomycin is approximately 30%
[26, 27], the poor efficiency was not attributed to drug-protein interactions. More likely, DEHP interacted heavily with plasma proteins, and this suppressed mass transfer of streptomycin. Levels of
DEHP higher than 75% were tested, but recoveries decreased due to
the relative high viscosity of DEHP. Optimal sample pH was found
at 5.0.
The data discussed above were obtained with 15-minute extractions at 30 V. The effects of voltage and time were investigated
subsequently for all biological matrices, as seen in Fig. 4. For this,
optimal sample pH and%DEHP was set according to the discussion
above. The optimal extraction voltage was for all found between
30 and 50 V. However, 30 V was finally selected to limit the current level and thus ensure a more robust system. At 30 V, both
urine and PP plasma reached exhaustive extraction after approximately 20 min. The highest process efficiency with full plasma was
obtained after 60 min of extraction. The decrease observed after
90 min was attributed to effects of electrolysis. Poor process efficiency with full plasma could thus partially be compensated for
by increasing the extraction time. The final optimal conditions are
summarized in Table 2. Fig. 5 shows representative current profiles under optimal extraction conditions for the three matrices.
As seen, the curves for urine and PP plasma were quite similar,
while the profile for untreated plasma indicated a slower progression of mass transport. The latter was in agreement with the timecurves of Fig. 4. At the optimal extraction conditions, the average
current per well was 67, 73, and 64 μA for urine, PP plasma, and
full plasma, respectively, which was considered sufficiently low to
provide stable and robust systems.
3.3. Clean-up efficiency from complex samples under optimal
extraction conditions
The clean-up efficiency of EME from biological samples, with
conditions suited for non-polar analytes, has in previous reports
5
F.A. Hansen and S. Pedersen-Bjergaard
Journal of Chromatography A 1639 (2021) 461915
Table 2
Summary of optimal extraction parameters for each sample matrix.
Matrix
Matrix:buffer ratio
Sample pH
%DEHP/NPPE in SLM
Voltage (V)
Time (minutes)
Urine
PP plasma
Full plasma
1:1
1:1
1:4
5.5
5.0
5.0
50
45
75
30
30
30
20
20
60
Fig. 5. Representative current profiles obtained from extraction of different matrices under optimal extraction conditions for each. The curves display the average
current per well of six wells extracted simultaneously.
For extractions with NPOE as SLM, no protein was detected in
the acceptor solution after extraction. This confirms previous assumptions that proteins are completely discriminated by this SLM.
With 75% DEHP/NPPE as SLM, optimized for streptomycin extraction, 0.57 ± 0.41% (n = 3, ±SD) of original protein in the sample was transferred to the acceptor solution. This was comparable
to the clean-up expected from conventional protein-precipitation
[30]. However, the Bradford assay is not specific to large proteins,
and may also detect smaller peptides. The small number measured
with the assay was therefore expected primarily to be peptides,
which are extracted by EME [31-33].
Presence or absence of phospholipids in the acceptor solution was determined by LC-MS/MS using in-source fragmentation,
as discussed in Section 2.4.2. For this, the SRM transition m/z
184 → 184 was monitored. This fragment corresponds to the backbone of phosphatidylcholines, lyso-phosphatidylcholines, and sphingomyelins, which account for the majority of phospholipids in
plasma [22]. As reference for the original amount of phospholipid,
one volume plasma (previously diluted 5-fold) was protein precipitated with two volumes ACN, centrifuged, and the supernatant was
analyzed directly by LC-MS/MS. Non-extracted PP plasma samples
were diluted in the same manner to reduce the concentration of
phospholipids prior to injection. The chromatograms of the nonextracted references are shown in the top of Fig. 6. EME was performed according to the optimized conditions (Table 2), and acceptor solutions were subsequently diluted 1:2 to allow direct quantitative comparison with the references. EME with NPOE as SLM was
also performed to compare with conditions suited for non-polar
analytes. With NPOE, no traces of phospholipids were found in the
acceptors after EME (green traces, Fig. 6). This confirmed previous
data [34]. Under EME conditions optimized for streptomycin, small
traces were identified in the acceptor after extraction (Rt 2.9 min,
red trace, Fig. 6). For untreated plasma, the peak area after EME
was however only 0.02% of the reference (original sample), and for
PP plasma the corresponding value was 0.18%. Although traces of
phospholipids were detected, the clean-up was thus very good and
represented >500-fold improvement compared to a simple protein
precipitation strategy.
Fig. 4. Effect of extraction voltage (upper graph) and extraction time (lower graph),
on process efficiency for urine, PP plasma, and full plasma. 50%, 45%, and 75%
DEHP/NPPE was used as optimal SLM composition for the three samples, respectively, and the voltage curve was performed with 15-minute extractions, while the
time curve was with 30 V applied. The error bars represent the standard deviation
(n = 3).
been excellent [28, 29]. This is because the hydrophobic SLM efficiently discriminates polar matrix constituents, and thus makes
the extraction selective. A typical SLM for non-polar bases is 2nitrophenyl octyl ether (NPOE). Compared to this, the SLM compositions identified for EME of streptomycin (Section 3.2) were much
more permeable to polar bases. The extraction selectivity / cleanup efficiency from urine, PP plasma, and full plasma, under optimal
extraction conditions for each matrix, was therefore studied next.
Attention was focused on proteins, phospholipids, and endogenous
substances with UV absorbance, positive and negative ESI-MS detection.
The total protein content of untreated plasma before and after extraction was determined by the Bradford assay (Section 2.5).
6
F.A. Hansen and S. Pedersen-Bjergaard
Journal of Chromatography A 1639 (2021) 461915
Fig. 6. Representative LC-MS/MS chromatograms of phospholipids (m/z 184 → 184) found in the acceptor solution after extraction with optimal conditions (red trace) for
full plasma (left panel) and PP plasma (right panel). For both conditions, extractions with NPOE (green trace) as SLM were included for comparison to a system suited for
non-polar substances. The black traces are the unextracted samples. Each extraction was performed in triplicate.(For interpretation of the references to color in this figure
legend, the reader is referred to the web version of this article.)
Finally, the clean-up of endogenous substances was evaluated
by HILIC analysis with UV-254 nm, as well as positive and negative full scan ESI-MS detection. The analysis was thereby capable
of detecting a wide range of substances. For UV-detection, 254 nm
was found to provide the best visualization of matrix peaks. This
was because the mobile phase gradient gave substantial changes
in baseline absorption at lower wavelengths. Representative UVchromatograms are shown in Fig. 7. For urine, the optimal EME
system for streptomycin (red trace) provided high clean-up efficiency for the vast majority of matrix components, with only few
minor matrix substances present in the acceptor. One major peak
was detected at 2.4 min, and this was attributed to creatinine
(highly abundant in urine). Total ion chromatograms (Figure S3)
obtained from the MS detection showed a similar trend, that some
matrix substances were present in the acceptor after extraction.
However, acceptable selectivity was achieved, despite that the SLM
was optimized for an analyte of extreme polarity.
The high selectivity resulted from discriminative effects of both
the electrical field and chemical composition of the SLM. Under
the optimal conditions for streptomycin, net anionic substances
were retained in the sample due to the direction of the electrical
field. Neutral substances were not influenced by the electrical field,
and mainly distributed between the sample and the SLM according to hydrophobicity. Net cationic substances were forced towards
the SLM/acceptor, but discrimination occurred based on sample pH
and% DEHP in the SLM. The latter parameters were specifically optimized for streptomycin (Fig. 3), and because this optimum is very
variable for individual substances dependent on their hydrophilicity and charge [13], many net cationic substances were discriminated. These substances either remained in the sample, or were
trapped in the SLM. Extraction of an extremely polar substance
from a polar matrix could thus be achieved with reasonable selectivity. The same trend was observed with EME from PP plasma
and untreated plasma, albeit UV-signals of matrix substances were
less.
3.4. Evaluation of data reliability
Finally, the analytical reliability of the proposed extraction
method was evaluated, with urine and untreated plasma samples
extracted according to Table 2. The validation data are provided in
Table 3. The linear range of calibration was from 20–500 ng mL−1
and 10 0–50 0 0 ng mL−1 for urine and plasma, respectively, with
an R2 ≥ 0.9929. Accuracy was within 94–107%, except for plasma
at LLOQ (125%). Similarly, repeatability was within 15%, except at
LLOQ. Matrix effects were insignificant for urine, while slight ion
enhancement was observed for full plasma samples.
The current data were not intended to be a full validation of the
proposed extraction method; the purpose was rather to demonstrate that reliable extraction performance could by achieved for
an extremely polar substance like streptomycin from complex matrices with EME.
7
F.A. Hansen and S. Pedersen-Bjergaard
Journal of Chromatography A 1639 (2021) 461915
Fig. 7. Representative HILIC-UV chromatograms at 254 nm of acceptor solutions after extraction of urine, PP plasma, and full plasma, under optimal conditions (red trace)
for each sample. Similar extractions with NPOE as SLM were included for comparison with a system suited for non-polar substances. The black traces are the unextracted
samples. All extractions were performed in triplicate. Prior to injection, all samples were mixed 1:1 with ACN for compatibility with HILIC conditions.(For interpretation of
the references to color in this figure legend, the reader is referred to the web version of this article.)
Table 3
Validation data for EME of streptomycin from urine and plasma. Process efficiency (PE) and matrix effects (ME) were determined at 200 ng mL−1 and
10 0 0 ng mL−1 for urine and plasma, respectively. Calibration curves were weighted by 1/x. Internal standard was added prior to extraction, except for
determination of PE where it was added post extraction. Limit of detection (LOD) and lower limit of quantitation (LLOQ) were defined by the concentrations with a signal-to-noise ratio of 3 and 10, respectively. ULOQ represent the upper limit of quantitation (i.e. upper linear range). All concentrations
are in ng mL−1 .
Matrix
Urine
Full plasma
∗
∗∗
Linear
range
(n = 4)
20–500
100–5000
R2
0.9991
0.9929
PE (%,
n = 4)
98
61
LOD
8
40
LLOQ
20
100
ME (%)
± SD
(n = 4)
97 ± 9
112 ± 9
Accuracy (%, n = 4)
LLOQ
107
125
Within range
∗
94
100∗∗
Repeatability (%, n = 4)
ULOQ
101
104
LLOQ
21
36
Within range
∗
4
11∗∗
ULOQ
9
15
at 100 ng mL−1 ,.
at 500 ng mL−1 .
4. Conclusion
teins and phospholipids were almost entirely discriminated by the
SLM, and this was the case also for the majority of endogenous
substances with UV absorbance. Lastly, the proposed EME method
was demonstrated to give reliable analytical data with exhaustive
extraction from urine and 61% extracted from full plasma.
The present study has reported successful EME of streptomycin
(log P = −7.6) for the first time. The extraction was enabled by
addition of bis(2-ethylhexyl) phosphate (DEHP) as ionic carrier to
the SLM comprising 2-nitrophenyl pentyl ether (NPPE). The interrelationship between carrier content, pH, co-solvent, recovery, repeatability, and extraction current (i.e. system stability), was studied carefully during method development. This was done based on
design-of-experiments (DOE) using urine and plasma samples. The
data obtained demonstrated that the optimal amount of DEHP in
the SLM, pH in the sample, and the mechanism of complexation,
were different with water, urine, and plasma samples. This was
because matrix components partly interacted and interfered with
DEHP.
Using optimized conditions for urine and plasma, the selectivity (i.e. clean-up) of streptomycin extraction was evaluated. Pro-
Declaration of Competing Interest
The authors declare that they have no known competing financial interests or personal relationships that could have appeared to
influence the work reported in this paper.
CRediT authorship contribution statement
Frederik André Hansen: Conceptualization, Methodology, Formal analysis, Investigation, Writing - original draft, Writing - re8
F.A. Hansen and S. Pedersen-Bjergaard
Journal of Chromatography A 1639 (2021) 461915
view & editing, Visualization. Stig Pedersen-Bjergaard: Methodology, Formal analysis, Writing - review & editing, Supervision.
[13] F.A. Hansen, P. Kubánˇ , E.L. Øiestad, S. Pedersen-Bjergaard, Electromembrane extraction of highly polar bases from biological samples – Deeper insight into
bis(2-ethylhexyl) phosphate as ionic carrier, Anal. Chim. Acta. 1115 (2020)
23–32.
[14] S. Knoll, T. Rösch, C. Huhn, Trends in sample preparation and separation methods for the analysis of very polar and ionic compounds in environmental water
and biota samples, Anal. Bioanal. Chem. (2020).
[15] N. Drouin, S. Rudaz, J. Schappler, Sample preparation for polar metabolites in
bioanalysis, Analyst 143 (1) (2018) 16–20.
[16] D.C. Dallas, A. Guerrero, E.A. Parker, R.C. Robinson, J. Gan, J.B. German, D. Barile, C.B. Lebrilla, Current peptidomics: applications, purification, identification,
quantification, and functional analysis, Proteomics 15 (5–6) (2015) 1026–1038.
[17] T. Reemtsma, U. Berger, H.P.H. Arp, H. Gallard, T.P. Knepper, M. Neumann,
J.B. Quintana, P.d. Voogt, Mind the Gap: persistent and Mobile Organic Compounds—Water Contaminants That Slip Through, Environ. Sci. Technol. 50 (19)
(2016) 10308–10315.
[18] World Health OrganizationCritically Important Antimicrobials For Human
Medicine, 6th rev. ed., World Health Organization, Geneva, 2019.
[19] ChemAxon, MarvinSketch. 2020: Budapest, Hungary.
[20] M. Glinka, W. Wojnowski, A. Wasik, Determination of aminoglycoside antibiotics: current status and future trends, Trends Anal. Chem. 131 (2020) 116034.
[21] T.C. McIlvaine, A BUFFER SOLUTION FOR COLORIMETRIC COMPARISON, J. Biol.
Chem. 49 (1921) 183–186.
[22] J.L. Little, M.F. Wempe, C.M. Buchanan, Liquid chromatography–mass spectrometry/mass spectrometry method development for drug metabolism studies: examining lipid matrix ionization effects in plasma. J, Chromatogr. B. 833 (2)
(2006) 219–230.
[23] M.M. Bradford, A rapid and sensitive method for the quantitation of microgram quantities of protein utilizing the principle of protein-dye binding, Anal.
Biochem. 72 (1) (1976) 248–254.
[24] F.A. Hansen, E. Santigosa-Murillo, M. Ramos-Payán, M. Muñoz, E.Leere Øiestad, S. Pedersen-Bjergaard, Electromembrane extraction using deep eutectic
solvents as the liquid membrane, Anal. Chim. Acta. 1143 (2021) 109–116.
[25] K.F. Seip, M. Faizi, C. Vergel, A. Gjelstad, S. Pedersen-Bjergaard, Stability and efficiency of supported liquid membranes in electromembrane extraction–a link
to solvent properties. Anal, Bioanal. Chem. 406 (8) (2014) 2151–2161.
[26] Y. Huang, Z. Zhang, D. Zhang, J. Lv, Flow-injection analysis chemiluminescence
detection combined with microdialysis sampling for studying protein binding
of drug, Talanta 53 (4) (2001) 835–841.
[27] R.C. Gordon, C. Regamey, W.M.M. Kirby, Serum Protein Binding of the Aminoglycoside Antibiotics, Antimicrob. Agents Chemother. 2 (3) (1972) 214.
[28] I.J.Ø. Kjelsen, A. Gjelstad, K.E. Rasmussen, S. Pedersen-Bjergaard, Low-voltage
electromembrane extraction of basic drugs from biological samples, J. Chromatogr. A. 1180 (1) (2008) 1–9.
[29] S. Seidi, Y. Yamini, T. Baheri, R. Feizbakhsh, Electrokinetic extraction on artificial liquid membranes of amphetamine-type stimulants from urine samples
followed by high performance liquid chromatography analysis, J. Chromatogr.
A. 1218 (26) (2011) 3958–3965.
[30] J. Blanchard, Evaluation of the relative efficacy of various techniques for deproteinizing plasma samples prior to high-performance liquid chromatographic
analysis, J. Chromatogr. B. 226 (2) (1981) 455–460.
[31] M. Balchen, L. Reubsaet, S. Pedersen-Bjergaard, Electromembrane extraction of
peptides, J. Chromatogr. A. 1194 (2) (2008) 143–149.
[32] C.X. Huang, A. Gjelstad, S. Pedersen-Bjergaard, Exhaustive extraction of peptides by electromembrane extraction, Anal. Chim. Acta. 853 (2015) 328–334.
[33] S. Nojavan, T. Bidarmanesh, A. Mohammadi, S. Yaripour, Electromembrane
extraction of gonadotropin-releasing hormone agonists from plasma and
wastewater samples, Electrophoresis 37 (5–6) (2016) 826–833.
[34] L. Vardal, A. Gjelstad, C. Huang, E.L. Oiestad, S. Pedersen-Bjergaard, Efficient
discrimination and removal of phospholipids during electromembrane extraction from human plasma samples, Bioanalysis 9 (8) (2017) 631–641.
Acknowledgement
The authors thank Shima Tirandaz for her contribution to
experimental work, and Frida Braathen for assistance in proofreading this manuscript. We also thank Hilde Nilsen for her assistance in measuring total protein content.
Supplementary materials
Supplementary material associated with this article can be
found, in the online version, at doi:10.1016/j.chroma.2021.461915.
References
[1] N. Drouin, P. Kubánˇ , S. Rudaz, S. Pedersen-Bjergaard, J. Schappler, Electromembrane extraction: overview of the last decade, Trends Anal. Chem. 113 (2019)
357–363.
[2] S. Pedersen-Bjergaard, K.E. Rasmussen, Electrokinetic migration across artificial liquid membranes: new concept for rapid sample preparation of biological
fluids, J. Chromatogr. A. 1109 (2) (2006) 183–190.
[3] A. Gjelstad, K.E. Rasmussen, S. Pedersen-Bjergaard, Electrokinetic migration
across artificial liquid membranes: tuning the membrane chemistry to different types of drug substances, J. Chromatogr. A. 1124 (1–2) (2006) 29–34.
[4] M.R. Payán, M.Á.B. López, R.F. Torres, M.V. Navarro, M.C. Mochón, Electromembrane extraction (EME) and HPLC determination of non-steroidal anti-inflammatory drugs (NSAIDs) in wastewater samples, Talanta 85 (1) (2011) 394–399.
[5] L.E. Eibak, A. Gjelstad, K.E. Rasmussen, S. Pedersen-Bjergaard, Exhaustive electromembrane extraction of some basic drugs from human plasma followed by
liquid chromatography-mass spectrometry, J. Pharm. Biomed. Anal. 57 (2012)
33–38.
[6] Y.A. Asl, Y. Yamini, S. Seidi, M. Rezazadeh, Simultaneous extraction of acidic
and basic drugs via on-chip electromembrane extraction, Anal. Chim. Acta. 937
(2016) 61–68.
[7] S. Seidi, Y. Yamini, A. Heydari, M. Moradi, A. Esrafili, M. Rezazadeh, Determination of thebaine in water samples, biological fluids, poppy capsule, and narcotic drugs, using electromembrane extraction followed by high-performance
liquid chromatography analysis, Anal. Chim. Acta. 701 (2) (2011) 181–188.
[8] M. Rezazadeh, Y. Yamini, S. Seidi, Electrically assisted liquid-phase microextraction for determination of β 2-receptor agonist drugs in wastewater, J. Sep.
Sci. 35 (4) (2012) 571–579.
[9] Y. Yamini, A. Pourali, S. Seidi, M. Rezazadeh, Electromembrane extraction followed by high performance liquid chromatography: an efficient method for extraction and determination of morphine, oxymorphone, and methylmorphine
from urine samples, Anal. Methods. 6 (15) (2014) 5554–5565.
[10] M. Baharfar, Y. Yamini, S. Seidi, M. Karami, Quantitative analysis of clonidine
and ephedrine by a microfluidic system: on-chip electromembrane extraction
followed by high performance liquid chromatography, J. Chromatogr. B. 1068
(2017) 313–321.
[11] N. Drouin, S. Rudaz, J. Schappler, New supported liquid membrane for electromembrane extraction of polar basic endogenous metabolites, J. Pharm.
Biomed. Anal. 159 (2018) 53–59.
[12] N. Drouin, T. Kloots, J. Schappler, S. Rudaz, I. Kohler, A. Harms, P.W. Lindenburg, T. Hankemeier, Electromembrane extraction of highly polar compounds:
analysis of cardiovascular biomarkers in plasma, Metabolites 10 (1) (2020).
9