Supercritical fluid chromatography-mass spectrometric determination of chiral fungicides in viticulture-related samples
Bạn đang xem bản rút gọn của tài liệu. Xem và tải ngay bản đầy đủ của tài liệu tại đây (596.66 KB, 10 trang )
Journal of Chromatography A 1644 (2021) 462124
Contents lists available at ScienceDirect
Journal of Chromatography A
journal homepage: www.elsevier.com/locate/chroma
Supercritical fluid chromatography-mass spectrometric determination
of chiral fungicides in viticulture-related samples
L. Pérez-Mayán, M. Ramil, R. Cela, I. Rodríguez∗
Department of Analytical Chemistry, Nutrition and Food Sciences. Research Institute on Chemical and Biological Analysis (IAQBUS). Universidade de
Santiago de Compostela, 15782-Santiago de Compostela, Spain
a r t i c l e
i n f o
Article history:
Received 16 November 2020
Revised 22 March 2021
Accepted 25 March 2021
Available online 30 March 2021
Keywords:
Fungicides
Enantiomeric fraction
Wine
Soil
Supercritical fluid chromatography
a b s t r a c t
Supercritical fluid chromatography (SFC), combined with mass spectrometry (MS), was employed for the
determination of five chiral fungicides, from two different chemical families (acylalanine and triazol) in
wine and vineyard soils. The effect of different SFC parameters (stationary phase, chiral selector, mobile
phase modifier and additive) in the resolution between enantiomers and in the efficiency of compounds
ionization at the electrospray source (ESI) was thorougly described. Under final working conditions, chiral
separations of selected fungicides were achieved using two different SFC-MS methods, with an analysis
time of 10 min and resolution factors from 1.05 to 2.45 between enantiomers. In combination with solidphase extraction and pressurized liquid extraction, they permitted the enantiomeric determination of target compounds in wine and vineyard soils with limits of quantification in the low ppb range (between
0.5 and 2.5 ng mL−1 , and from 1.3 to 6.5 ng g−1 , for wine and soil, respectively), and overall recoveries
above 80%, calculated using solvent-based standards. For azolic fungicides (tebuconazole, myclobutanil
and penconazole) soil dissipation and transfer from vines to wines were non-enantioselective processes.
Data obtained for acylalanine compounds confirmed the application of metalaxyl (MET) to vines as racemate and as the R-enantiomer. The enantiomeric fractions (MET-S/(MET-S+MET-R)) of this fungicide in
vineyard soils varied from 0.01 to 0.96; moreover, laboratory degradation experiments showed that the
relative dissipation rates of MET enantiomers varied depending on the type of soil.
© 2021 Elsevier B.V. All rights reserved.
1. Introduction
Many pesticides employed in agriculture have a chiral structure;
thus, the persistence of these compounds in crops, their degradation rates in agriculture soils and even their bioaccumulation in
invertebrates and toxicities towards non-target organisms might be
enantioselective processes [1].
Mildew and botrytis are major diseases impacting the productivity of vines. So, different families of fungicides have been designed and marketed to control these infections. Many of these
compounds are chiral molecules. Among them, acylalanine and
azoles are widely applied to vineyards for the prevention and the
control of infections caused by mildew and botrytis fungi, respectively. Metalaxyl (MET), and in a lesser extent benalaxyl (BEN), are
the most popular acylalanine fungicides. Although the fungicidal
activity of the R-enantiomer is much higher than that of the S-
∗
Corresponding author.
E-mail address: (I. Rodríguez).
/>0021-9673/© 2021 Elsevier B.V. All rights reserved.
form [2], currently, both compounds are still marketed as the racemate in addition to formulations enriched in the R-form. MET has
been often reported in wine [3,4] and vineyard soils [5,6]; however, no data are available regarding the enantiomeric profiles of
the compound in these matrices. The group of azolic fungicides
gathers a large number of active molecules authorized for agriculture treatments. Among them myclobutanil (MYC), tebuconazole
(TEB) and penconazole (PEN) are the most popular ones as regards viticulture applications. To the best of our knowledge, these
compounds are marketed only as racemates. Their transfer factors
from grapes to wine are lower than in case of MET [7,8]; however,
they are more persistent in soils [9]. In this regard, the European
Union (EU) has included TEB and PEN in the watch list of emerging environmental pollutants [10], for which data about their environmental distribution are required in order to estimate their risk
quotients.
According to literature, the relative enantiomeric degradation
rates of the above fungicides in crops and soil are matrix dependent. In this vein, the dissipation rates of MET isomers in soils varied largely depending on soil microbiota [11], with the stability of
the R-form decreasing dramatically in alkaline soils [12]. Some re-
L. Pérez-Mayán, M. Ramil, R. Cela et al.
Journal of Chromatography A 1644 (2021) 462124
cent data point out to the fact that the low fungicidal activity METS might perturb the metabolism of mammals in a higher extent
than the R-enantiomer [13]; thus, in addition to total concentration
data the knowledge of enantiomeric fractions of this fungicide, as
well as their time-course evolution, is a matter of concern. Wang
and co-workers [14] have reported a faster dissipation for the S
form of TEB than the R enantiomer in cabbage, whilst the opposite
behavior was noticed in cucumber. Also, the enantiomeric degradation rates of MYC and TEB in soil have been related to their organic
matter content, pH and other physico-chemical properties [15]. In
summary, non-target effects and dissipation rates of chiral fungicides might change depending on the investigated organisms, the
properties of each soil matrix, and the specific metabolism of each
crop. To the best of our knowledge, little information is available
related to the enantioselective accumulation of above fungicides
in viticulture related samples. Zhang et al. [16] described a faster
degradation of TEB-R in grapes than TEB-S; however, no data have
been found regarding the enantiomeric fractions (EFs) of the compound in wine.
To date, most methods employed for the determination of chiral
pesticides are based on liquid chromatography, either under normal or reversed-phase conditions [1,17]. Some limitations of chiral LC-based methods are either the use of isocratic conditions,
often optimized for the separation of the enantiomers of single
compound [15, 18, 19], or, in case of multianalyte procedures, the
employment of slow gradients leading to analysis times above 60
minutes [20]. Since some years ago, pharmaceutical laboratories
have upgraded their chiral separation methods from LC to supercritical fluid chromatography (SFC). Major advantages of the latter
technique are reduction of the analysis time, due to the higher diffusivity and lower viscosity of supercritical CO2 , and save of large
volumes of toxic organic solvents used in chiral LC separations
when performed under normal phase conditions [21]. The combination between SFC and electrospray mass spectrometry (ESI-MS)
has expanded the applicability of the technique to determine trace
level compounds in complex extracts obtained from environmental
and food samples, either using non-chiral or chiral columns [22–
25].
Herein, we evaluate the performance of SFC-ESI-MS for the
chiral separation of a selection of five fungicides, belonging to
two different chemical families, often employed in the control of
mildew and botrytis infections in vines. Their residues have been
often reported not only in viticulture related samples, but in general in agriculture soils and other environments impacted by agriculture activities [26]. Moreover, azolic fungicides are regarded
as an environmental threat and pinpointed as concerning pollutants for which environmental monitorization is recommended
[10]. Thereafter the method is applied to the analysis of commercial wines and vineyard soils. The enantiomeric fraction (EF) data
are employed to draw conclusions regarding the application form
of acylalanine fungicides (as racemates or as preparations of the
most active R enantiomer), and to investigate the existence of potential enantioselective dissipation processes during the wine making process and in the soil of different vineyards from the Northwest of Spain.
way Biotech Co (Minhang District, Shangai, China). Individual solutions of the above compounds were prepared in methanol (MeOH).
Racemic mixtures of fungicides, used to spike soil and wine samples processed through this study, were made in the same solvent. A mix of isotopically labelled compounds in methanol was
added to soil and wine samples before extraction. These compounds were employed as surrogate standards (SSs) to compensate
non-quantitative recoveries and/or changes on compounds ionization yield at the electrospray source (ESI). Calibration standards
containing increasing concentrations of native compounds (0.5 100 ng mL−1 ), and a fixed level of labelled compounds (100 ng
mL−1 ), were prepared in MeOH: ACN (50:50).
MeOH and ACN, both LC-MS grade purity, formic acid (FA, 98
%), NH3 (12% solution in MeOH), and acetic acid were supplied by
Merck (Darmstadt, Germany). Ultra-pure deionized water (18.2 M
cm−1 ) was obtained from a Milli-Q Gradient A-10 system (Millipore, Billerica, MA, USA). Carbon dioxide (CO2 ) was purchased from
Nippon Gases (Madrid, Spain).
OASIS HLB 200 mg cartridges, employed for solid-phase extraction (SPE) of wine samples, were acquired from Waters (Milford,
MA, USA). Diatomaceous earth, used during pressurized extraction
of vineyard soils, was provided by VWR (West Chester, PEN, USA).
2.2. Samples and sample preparation
Wines were either purchased in local supermarkets, or obtained
directly from regional wine production associations. Samples were
maintained in the dark, at room temperature and SPE extractions
were carried out immediately after opening wine bottles.
Soils were taken in seven vineyards, corresponding to three
different Designations of Origin in Galicia (Spain). Samples used
in this study corresponded to top soil (0-15 cm depth) collected
in polyethylene bags, and transported immediately to laboratory.
After removing coarse materials, samples were freeze-dried and
sieved. The fraction below 2 mm was stored at -20 °C and employed for analysis. Samples used to measure the EFs of fungicides
in vineyard soils were collected at the beginning of autumn and/or
the end of winter; thus, fungicides were in contact with the soil
since, at least, the end of the previous year summer. Soils employed in laboratory incubation studies were taken at the end of
spring (middle June), within the year period that fungicides are
sprayed on vineyards.
Sample preparation was performed using previously published
procedures dealing with pressurized liquid extraction [9] and SPE
[27] of vineyard soils and wines, respectively. In brief, soil samples
(2 g) were spiked with the mixture of SSs (250 ng g−1 ) and packed
in 11 mL stainless steel cells containing 1 g of diatomaceous earth.
The free volume above the sample, within the PLE cell, was filled
with the same sorbent. Cells were pressurized at 1500 psi and
compounds were extracted using a mixture of MeOH:ACN (70:30)
at 80 °C, in a single cycle with a duration of 5 min [9]. This extract
was concentrated and made up to 5 mL, using volumetric flasks,
and stored at 4 °C. Wines (2 mL) were diluted with the same volume of ultrapure water, spiked with SSs (100 ng mL−1 ) and passed
through a SPE cartridge previously conditioned with ACN: MeOH
(80:20) followed by a mixture of EtOH: H2 O (12:88), 2 mL each.
After loading the diluted samples, the sorbent was rinsed with 3
mL of the EtOH: H2 O solution and dried using a stream of nitrogen. Compounds were recovered with a mixture of ACN: MeOH
(80:20). The extract from the SPE cartridge (2 mL) was maintained
at 4 °C until analysis. Both sample preparation procedures were
previously combined with LC-MS as determination technique using a non-chiral column for compounds separation [9,27]. Before
injection in the SFC-MS system, all extracts were passed through a
0.22 μm syringe filter.
2. Material and methods
2.1. Standards, solvents and sorbents
Standards of MET, BEN, TEB, MYC and PEN, as racemates, were
purchased from Sigma-Aldrich (Milwakee, WI, USA). Isotopically labelled compounds (MET-13 C6 , TEB-d9 and MYC-d4 , as racemic solutions) were obtained from the same supplier. The R enantiomers
of MET and BEN were also purchased from Sigma-Aldrich, whilst
R and S forms of TEB were kindly supplied by Shangai Chiral2
L. Pérez-Mayán, M. Ramil, R. Cela et al.
Journal of Chromatography A 1644 (2021) 462124
the flow of mobile phase was 1.5 mL min−1 and columns were
maintained at 40 °C. As make-up solution, a mixture of MeOH:FA
(99.5: 0.5) was used to enhance compounds ionization in the ESI
source [29]. Under final conditions, two different chromatographic
methods were employed. The enantiomers of MET, BEN and TEB
were separated using the amylose-1 column. The mobile phases
consisted of CO2 (A) and MeOH, 5mM in NH4 Ac, (B) combined as
follows: 0-1 min (2% B), 4-6 min (30% B), 6.05-10 min (2% B). The
identity of the enantiomers of these fungicides was confirmed by
injection of R-forms of MET and BEN, as well as R and S isomers of
TEB. Chiral separations of MYC and PEN were performed with the
cellulose- 5 column using ACN 5 mM in NH4 Ac as organic modifier.
The mobile phase gradient was: 0-1 min (10% B), 4-6.5 min (30%
B), 6.51-10 min (10% B). The identities of the enantiomers for these
two fungicides were not elucidated; thus, they are simply referred
as isomers 1 and 2 attending to their elution order.
2.3. Soil incubation experiments
In addition to data obtained for field samples (vineyard soils),
the potential enantioselective degradation of fungicides in this matrix was re-evaluated in laboratory incubation assays. The physicochemical properties of the samples used in this series of experiments are given as supplementary information (Table S1). Fractions of 2 g from each soil (particle size below 2 mm) were transferred to 20 mL glass vials and spiked with a racemic mixture of
the five compounds considered in this study (addition level 200
ng g−1 ). One of the soils (sampling point 2, Table S1) was fortified
only with BEN and PEN given that it contained relevant residues
of the rest of compounds (from 50 ng g−1 for TEB to 250 ng g−1
for MYC). Water content in incubation vessels was adjusted to 20%
of sample weight. After Vortex homogenization, vials were capped
using Teflon lined septa. A needle was passed through the septum and a 0.45 μm pore size filter was connected on top of the
needle. This setup permits to assess compounds dissipation under
aerobic conditions, whilst it reduces water evaporation [28]. Vials
were maintained at 20 °C, and retrieved in duplicate at pre-defined
times (from 0 to 66 days). Control experiments were performed
with sterilized fractions of each soil matrix, incubated for 66 days.
Soil sterilization was performed heating the sieved samples to 170
°C for 90 min. Extraction of soil samples was carried as defined in
section 2.2 after addition of SSs.
2.5. Evaluation of enantiomeric fractions, matrix effects and accuracy
EFs of fungicides in the extracts from wine and soil samples
were calculated as the ratio between the concentration corresponding to the earlier eluting isomer and the sum of concentrations for both enantiomers [30].
Matrix effects (MEs) were evaluated with the ratio between the
slope of calibration curves for matrix-based standards (prepared
with spiked extracts from wine or soil samples) and solvent-based
standards. Normalized ratios around 100% correspond to similar
ionization efficiencies in both cases. Values below and above 100%
point out to signal suppression and enhancement, respectively.
The accuracy of the analytical procedure was estimated using
spiked samples of red and white wines, and vineyard soil. Spiked
and non-spiked fractions of the above samples were extracted
in triplicate. Concentrations of each enantiomer in the obtained
extracts were calculated using solvent-based standards. Accuracy
was estimated as the ratio between the difference of concentrations measured for spiked (samples were fortified before extraction) and non-spiked fractions of the investigated matrix divided
by the added value and multiplied by 100.
2.4. SFC-ESI-QTOF-MS determination conditions
Separation of chiral compounds was carried out using an Agilent 1260 infinity II SFC system (Wilmington, DE, USA) connected
to a quadrupole time-of-flight (QTOF) instrument (Agilent model
6550) furnished with dual spray ion funnel ESI source. The mobile
phase from the SFC system was mixed with the make-up solution
and divided in two streams. One reaches the ESI source through
a 1 m x 0.050 mm i.d. silica capillary. The second stream is connected to the back-flush pressure regulator (BPR), which is responsible to maintain the CO2 under supercritical conditions.
The TOF-MS instrument operated in the 2 GHz mode, offering a typical spectral resolution of 160 0 0 (calculated as FWHM
at m/z 322.0481). The ESI source was set in positive mode, and
the m/z axis was continuously recalibrated using reference ions at
m/z 121.0509 and 922.0098. Nitrogen was employed as nebulizing (35 PSI) and drying gas (15 L min−1 , 200 °C) in the ionization source. The ESI needle and the fragmentor voltages were set
at 3500 V and 380 V, respectively. During optimization of SFC conditions, the instrument was run in the MS mode, using the peak
areas for the [M+H]+ ion of each compound as response variable.
Analysis of soil and wine samples was carried out in the product
ion scan acquisition mode. In both cases, quantification ions were
extracted using a mass window of 20 ppm centred either in their
[M+H]+ ion, or in the most intense product ion of each compound
(Table 1).
The polysaccharide-based chiral columns evaluated for compounds separation were obtained from Phenomenex (Torrance, CA,
USA). Column dimensions were 150 mm (length) x 3 mm (i.d.),
3 μm particle size. The tested phases were amylose and cellulose with phenyl carbamate bonded to methyl and/or chlorine substituents as chiral selectors. Through this manuscript, columns are
termed as amylose-1 (3,5-dimethyl phenyl carbamate), amylose3 (3-methyl-5-chloro phenyl carbamate) and cellulose-5 (3,5dichlorophenyl carbamate). In the former case, the stationary
phase is coated on silica particles, whilst amylose-3 and cellulose-5
phases are immobilized on silica. The assayed mobile phases consisted of CO2 (phase A) combined with MeOH, or ACN (phase B)
as modifiers, containing different additives, such as FA (0.1%), ammonium acetate (NH4 Ac, 5 mM) or NH3 (0.1%). In all the cases,
3. Results and discussion
3.1. Optimization of SFC parameters
Enantiomeric separations of selected compounds were investigated combining the chiral columns described in section 2.4 with
MeOH or ACN as modifiers of supercritical CO2 . In this set of preliminary experiments, the percentage of modifier in the mobile
phase was varied as follows: 2% (0-1 min), 30 % (4-7 min), 2% (7.110 min). The mobile phase flow rate was 1.5 mL min−1 and the
temperature of the columns set at 40 °C. As a general trend, ACN
showed a lower solvation efficiency than MeOH, leading to longer
retention times than those observed with the latter modifier. In
some cases, the separation efficiency of the column was also lower
for ACN than for MeOH, as a consequence of wider peaks noticed
for the former solvent. As regards separation of enantiomers, resolution factors (Rs) were column and modifier dependent.
The amylose-3 column provided Rs above 1.5 only for the
enantiomers of BEN (obtained using MeOH as modifier), data not
shown. Table S2 summarized Rs and baseline peak width values
obtained using amylose-1 and cellulose-5 columns in combination
with MeOH and ACN as modifiers. The latter column separated
the enantiomers of BEN and PEN with any of both organic modifiers; moreover, partial separation of MYC forms (RS >1) was observed with ACN. On the other hand, this column did not resolve
the enantiomers of MET and TEB. The separation efficiency and the
3
L. Pérez-Mayán, M. Ramil, R. Cela et al.
Journal of Chromatography A 1644 (2021) 462124
Table 1
Retention times, quantification ions, linearity (R2 values) and instrument limits of quantification (LOQs) of the SFC-QTOF-MS system.
Compound
Column
Retention
time (min)
Rs
Quantification
transition (Collision
energy, Ev)
Other
product
ions
Linearity
(R2 , 1-100
ng mL−1 )
LOQ (ng
mL−1 )
a
Amylose1
1.05
0.9989
0.9984
0.9991
0.9978
0.9995
0.9983
0.9990
0.9956
0.9977
0.9962
0.5
0.5
1
1
0.5
0.5
0.5
0.5
2.5
2.5
1.04
280.1543 (10) >
220.1332
326.1751 (10) >
148.1121
308.1524 (20) >
70.0399
289.1215 (20) >
70.0399
284.0714 (20) >
70.0399
286.175 (10) >
226.1531
293.1466 (20) >
70.0399
317.2089 (20) >
70.0399
192.1383;
160.1121;
208.1332;
45.0335
91.0642
125.0153
Amylose-1
2.66
2.79
3.02
3.32
4.19
4.38
4.63
4.8
5.55
6.25
2.68; 2.81
MET-S
MET-R (M)
a
BEN-S
a
BEN-R (M)
c
TEB-S
c
TEB-R
b
MYC-1
b
MYC-2
b
PEN-1
b
PEN-2
a
Met 13 C6
a
Cellulose5
2.45
1.61
1.25
1.55
b
MYC-d4
Cellulose-5
4.49; 4.68
1.26
c
TEB-d9
Amylose-1
4.23; 4.40
1.59
a
b
c
125.0153
158.9763
Slope ratio
(1st /2nd
enantiomer)
1.00
1.01
0.99
1.01
0.94
198.1583;
166.1319
129.0397
125.0153
Denote the surrogate standard associated to each compound.
Denote the surrogate standard associated to each compound.
Denote the surrogate standard associated to each compound.
enantiomeric selectivity of the amylose-1 column was heavily affected by the organic modifier. Using ACN, partial resolution (Rs
values from 0.76 for MYC to 1.0 for PEN) was observed between
the pairs of enantiomers of the 5 fungicides. However, their peak
widths were 2-3 times larger than those noticed using MeOH. The
latter modifier led to partial separation of the enantiomers of MET
(Rs values around 1), the forms of BEN and TEB were baseline
resolved, and no separation was noticed for PEN and MYC enantiomers.
The effect of different additives (NH3 0.1%, FA 0.1% and NH4 Ac
5mM) in the performance of SFC separations was assessed using CO2 :MeOH and CO2 :ACN as mobile phases combined with
amylose-1 and cellulose-5 columns, respectively. Triazolic fungicides are slightly basic compounds, so depending on the mobile
phase pH, secondary interactions with the chiral stationary phase
and/or with the silica particles might affect their SFC retention and
separation [31]. The above additives did not modify the performance of SFC separations (efficiency, selectivity or resolution between enantiomers); however, they introduced significant effects
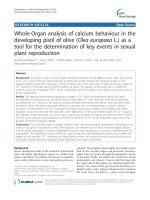
in the efficiency of compounds ionization. Relative responses (normalized to those obtained without any mobile phase additive) varied depending on the compound and the SFC column (Fig. 1). For
example, NH3 (0.1%) combined with MeOH exerted a minor effect in the relative response found for MYC with the amylose-1
column, Fig. 1A; however, the responses for the enantiomers of
this fungicide increased by a factor of 5 when the same additive
was combined with ACN (Fig. 1B). The adopted compromise decision was to employ NH4 Ac (5 mM) as additive in combination
with MeOH and ACN. This additive improved significantly the responses observed for the enantiomers of MET, BEN and MYC. On
the other hand, the peak areas of TEB and PEN suffered a reduction in comparison to those attained without additive in the mobile phase. NH4 Ac also prevented differences in the responses for
enantiomers of the same compound reaching the ESI source in a
different environment, as regards the mobile phase pH. As example, the relative intensities of the chromatographic peaks for the
enantiomers of BEN in the amylose-1 column, differed significantly
when acid or basic additives are included in the mobile phase,
(Fig. S1).
Another parameter considered during optimization of SFC conditions was the BPR pressure. Between 90 and 140 bar, retention
times decreased slightly with increasing the pressure due to a
higher polarity of the mobile phase. The effect of this parameter
in the resolution of enantiomers was negligible and, as a general
trend, responses (peak areas) increased significantly with BPR pressure, see Fig. S2. Thus, a working value of 140 bar was selected for
this parameter.
Taking into account the above data, after slight modifications of
the mobile phase gradient, two different chromatographic methods were proposed. Chiral determinations of MET, BEN and TEB
were carried out in the amylose-1 column, using MeOH (5 mM in
NH4 Ac) as modifier in the mobile phase. The percentage of modifier was programmed as follows: 2% (0-1 min), 30 % (4-6 min),
2% (6.05-10 min). For these three compounds, the earlier eluting
isomer was the S-form. MYC and PEN were determined using the
cellulose-5 column, with ACN (5 mM in NH4 Ac) as modifier. The
content of modifier was varied as follows: 10% (0-1 min), 30 % (46.5 min), 2% (6.51-10 min). The elution order of the enantiomers
of these compounds was not established. The cellulose-5 column
permitted also the separation of BEN enantiomers, with a different
selectivity to that reported for the amylose-1 column. That is, BENR eluted first than the S-form of the fungicide in the cellulose column. Under above conditions, maintaining chiral columns at 40 °C,
the total pressure in the chromatographic system varied with the
chromatographic gradient within the ranges of 210-250 bar (ACN),
200-250 bar (MeOH); thus, pressure remained 100 bar below the
upper limit (350 bar) established for the employed chiral columns.
The effect of the make-up flow rate (MeOH: FA, 99.5: 0.5) in
the responses of fungicides was evaluated in the range of values
from 0.1 to 0.7 mL min−1 . Under chromatographic conditions employed with the amylose-1 column, the normalized responses of
MET enantiomers and that of BEN-S increased significantly between 0.1 and 0.3 mL min−1 of make-up; thus, their ionization
efficiencies improved with the flow rate of MeOH: FA (99.5: 0.5)
reaching the ESI source (Fig. S3A). In case of BEN-R and TEB enantiomers, which elute from the column with a higher percentage of
MeOH in the mobile phase, the effect of make-up flow was negligible. A working value of 0.3 mL min−1 was used in combination with this column. Under conditions employed in the cellulose5 column, responses of all compounds decreased with the makeup flowrate, with the most dramatic effect observed for the enantiomers of PEN (Fig. S3B). Thus, a value of 0.1 mL min−1 was used
in combination with this column. It is worth noting that, normalized responses of BEN enantiomers showed a different dependence
with make-up flow rate as function of the modifier employed in
the mobile phase (Fig. S3A and S3B). Thus, the composition of the
4
L. Pérez-Mayán, M. Ramil, R. Cela et al.
Journal of Chromatography A 1644 (2021) 462124
MeOH
500%
MeOH 0.1% NH3
MeOH 0.1% FA
MeOH 5 mM NH4Ac
A
Normalis ed res pons e
400%
300%
200%
100%
0%
TEB-S
TEB-R
ACN
600%
MET-S
ACN 0.1% NH3
MET-R
BEN-S
ACN 0.1% FA
BEN-R
PEN
MYC
ACN 5mM NH4Ac
Normalis ed res pons e
500%
B
400%
300%
200%
100%
0%
TEB
MET
BEN-R
BEN-S
PEN-1
PEN-2
MYC-1
MYC-2
Fig. 1. Normalized responses as function of the mobile phase additive. A, amylose-1 column using methanol as modifier. B, cellulose-5 with acetonitrile as modifier, n=5
replicates.
CO2 : organic solvent reaching the ESI source plays a major effect
in the efficiency of compounds ionization.
the study of MEs, and the evaluation of the accuracy with spiked
samples. Both variables are affected not only by sample preparation conditions, but also by the composition of the mobile phase
in the ESI source, which differs between SFC and reversed-phase
LC methods. The assessment of MEs demonstrated suppression of
the ionization efficiency of certain compounds (Fig. 2). Particularly, the enantiomers of TEB and BEN showed a moderate signal attenuation for soil extracts and, in a lesser extent, during
analysis of red wine. More significant than the magnitude of signal attenuation is the lack of differences between MEs observed
for the enantiomers of the same species. This fact, reduces the
risk of reporting false variations in their EFs when processing real
samples.
The recoveries of the procedure, estimated using solvent-based
standards, are given in Table 2. The spiked levels employed in this
study were 20 and 50 ng mL−1 (case of wine) and 50 and 100
ng g−1 (soil). These values remain in the range of concentrations
reported in commercial wines and vineyard soils [6, 9, 27]. Recoveries varied in the range from 80% to 117% with RSDs between 2
and 15%. The overall LOQs of the procedure are also compiled in
Table 2. Reported values were estimated from instrumental LOQs
(Table 1), considering sample amount and final extract volume for
each type of sample, as well as signal attenuation effects observed
for some compounds (Fig. 2). In the case of wines, the procedural
LOQs are very similar to instrumental values. For soils, LOQs varied
in the range from 1.3 ng g−1 to 6.3 ng g−1 .
3.2. Characterization of the SFC-ESI-QTOF procedure
Table 1 compiles relevant data related to the performance of
SFC-ESI-QTOF-MS methods considering the MS/MS detection mode.
Linearity was investigated by injection of racemic mixtures of the
above compounds prepared in MeOH. Within the range of concentrations from 1 to 200 ng mL−1 (values referred to the sum
of enantiomers), linear responses were obtained for all the species
with determination coefficients above 0.99. Limits of quantification,
defined as the lowest concentration providing a signal to noise
(S/N) of 10 for the quantification product ion varied from 0.5 ng
mL−1 (enantiomers of MET, TEB and MYC) to 2.5 ng mL−1 (PEN
enantiomers). These values are only slightly higher than those obtained in a previous study reporting the determination of same
compounds by UPLC-QqQ-MS, using a non-chiral column (LOQs
from 0.1 to 0.4 ng mL−1 ) [27].
3.3. Matrix effects and accuracy assessment
The extraction yield of the sample preparation methods employed in the current study for wine and soil were characterized in previous publications of our group [9,27]. Thus, validation of the methodology described in this research was limited to
5
L. Pérez-Mayán, M. Ramil, R. Cela et al.
Journal of Chromatography A 1644 (2021) 462124
Soil
Red wine
White wine
120.0
Matrix effect (%)
100.0
80.0
60.0
40.0
20.0
0.0
MET-S
MET-R
BEN-S
BEN-R
TEB-S
TEB-R
MYC-1
MYC-2
PEN-1
PEN-2
Fig. 2. Ratios between slopes of calibration curves for solvent and matrix-matched standards prepared using a pool of extracts from soil and wine samples.
Table 2
Overall recoveries, with standard deviations, for soil and wine samples spiked with racemic mixtures of compounds at two different
concentration levels, n=3 replicates
Compound
Sample type
LOQs
Soil
MET-S
MET-R
BEN-S
BEN-R
TEB-S
TEB-R
MYC-1
MYC-2
PEN-1
PEN-2
Soil
Wine
50 ng g−1
100 ng g−1
Red wine
20 ng mL−1
50 ng mL−1
White wine
20 ng mL−1
50 ng mL−1
(ng g−1 )
(ng mL−1 )
98 (7)
97 (8)
99 (8)
84 (7)
93 (7)
98 (9)
105 (10)
100 (14)
108 (6)
94 (7)
108 (4)
103 (7)
112 (5)
105(5)
107 (5)
112 (5)
99 (11)
110 (11)
92 (8)
104 (8)
103 (10)
105 (12)
102 (15)
106 (15)
104 (14)
107 (14)
99 (12)
97 (13)
95 (2)
97 (9)
91
84
85
80
89
94
91
91
88
88
117 (4)
117 (5)
104 (5)
110 (11)
111 (5)
110 (9)
114 (7)
108 (5)
96 (6)
106 (11)
107 (12)
105 (12)
87 (12)
97 (10)
107 (11)
105 (11)
104 (6)
108 (8)
110 (9)
106 (9)
1.5
1.5
3.3
3.3
2.3
2.3
1.3
1.3
6.3
6.3
0.5
0.5
1.4
1.4
0.7
0.7
0.5
0.5
2.5
2.5
(3)
(3)
(3)
(2)
(6)
(4)
(4)
(4)
(2)
(3)
Table 3
Enantiomeric fractions (EFs), with their standard deviations (SD), and average total concentrations of fungicides in commercial
wines, n=3 replicates. R, red wine. W, white wine.
Sample
code
R1
R2
R3
R4
R5
R6
W1
W2
W3
W4
W5
W6
W7
W8
W9
W10
W11
MET
TEB
MYC
EF
SD
Conc. (ng mL−1 )
EF
SD
Conc. (ng mL−1 )
EF
SD
Conc. (ng mL−1 )
0.43
0.05
0.57
0.56
0.56
0.56
0.42
0.43
0.44
0.44
0.41
0.11
0.34
0.43
0.37
0.52
0.42
0.02
0.09
0.01
0.01
0.01
0.01
0.01
0.03
0.02
0.02
0.02
0.00
0.03
0.04
0.02
0.01
0.01
43
8
412
344
27
57
11
36
26
6
45
36
31
4
40
15
12
0.54
0.52
0.54
0.04
0.01
0.02
2
37
76
0.43
0.42
0.47
0.44
0.01
0.02
0.01
0.01
10
4
106
18
0.53
0.51
0.50
0.56
0.54
0.02
0.018
0.013
0.062
0.077
3
14
8
2
3
0.52
0.018
5
Empty cells correspond to non-detected compounds.
3.4. Distribution of fungicides in wine and soil samples
frequency for the rest of fungicides increased in the following order: MYC < TEB < MET, with residues of the latter species found
in all samples. Compared to the European Regulation for vinification grapes, the highest concentration of MET found in wine (412
ng mL−1 , equivalent to 412 ng g−1 , since the density of wine is
around 0.994 g mL−1 ) was close to 50% of its maximum residue
Table 3 shows the total concentrations and the EFs of fungicides in a selection of 17 wines produced in Galicia (Northwest
Spain). BEN and PEN remained below method LOQ in all samples,
so these compounds are not included in the table. The detection
6
Journal of Chromatography A 1644 (2021) 462124
0.03
0.03
0.01
0.03
0.39
0.40
0.48
0.50
EF
0.01
0.02
0.56
0.44
0.01
0.01
0.50
0.51
EF
0.53
0.50
EF
12
0.52
0.50
EF
5
6
7
4
3
2
Empty cells correspond to non-detected compounds.
374
96
14
7
408
71
121
75
13
7
29
0.01
0.01
0.05
0.04
0.01
0.01
0.01
0.04
0.03
0.07
0.03
0.37
0.28
0.30
0.35
0.01
0.03
0.96
0.65
0.62
0.49
0.27
OCTOBER 2018
MARCH 2019
OCTOBER 2018
MARCH 2019
OCTOBER 2018
MARCH 2019
OCTOBER 2018
MARCH 2019
MARCH 2019
MARCH 2019
MARCH 2019
1
EF
MET
SD
Conc. (ng g
−1
)
BEN
SD
0.01
0.01
14
7
Conc. (ng g
−1
)
TEB
SD
0.03
0.02
54
164
Conc. (ng g
−1
)
MYC
SD
7
Sampling date
The potential existence of enantioselective degradation processes at vineyard codes 2, 3 and 4 (Table 4) was further assessed under laboratory conditions. Soil from these points were
taken in June, in order to mimic microbiological conditions existing during the application period of these compounds, spiked with
selected compounds and incubated under conditions reported in
section 2.3. Table 5 summarized the total residual concentration of
each fungicide at the end of the experiment, in non-sterilized and
sterilized soils, normalized to that measured at day zero. TEB, MYC
and PEN were hardly degraded during the experiment, whilst the
Vineyard
code
Table 4
Enantiomeric fractions (EFs), with their standard deviations (SD), and average total concentrations of fungicides in vineyard soils, n=3 replicates.
3.5. Assessment of EFs under laboratory conditions
89
146
1746
586
Conc. (ng g
−1
)
PEN
SD
Conc. (ng g−1 )
level authorized in vinification grapes (10 0 0 ng g−1 ) [32]. Globally, the EFs of TEB and MYC were equal to 0.5. This fact confirms that both compounds are commercialized as racemates and
also, the absence of enantioselective dissipation processes either
at vines, or during microbiological processes involved in must fermentation. In case of MET, the range of EFs varied from 0.05 to
0.57. EFs below 0.1, as that observed for wine code R2, likely correspond to grapes fumigated with the R-form of MET (commercialized under the name of MET-M). On the other hand, EFs slightly,
although significantly, above 0.5 were measured in 4 red wines.
Assuming that they were obtained from grapes treated only with
the racemate of this fungicide, it seems that MET-S (the inactive fungicide isomer) is slightly enriched versus the R-form at
vines and/or during wine elaboration. Obviously, confirming this
assumption requires to the analysis of a relevant number of wines
elaborated from grapes treated with the racemate of MET, with
vinification developed under controlled conditions to avoid mixing in the same fermentation tank grapes, which received different treatments. Finally, in most white wines, EFs below 0.5
(0.37 to 0.43) were observed (Table 3). In this case, without information of vineyard treatments, it cannot be concluded a preferential accumulation of the R-form in this wine. The reason is
that vines might have been fumigated with formulations including the racemate and also with other preparations containing just
MET-M.
Average concentrations and EFs data for soil samples are summarized in Table 4. Samples were obtained from 7 vineyards from
3 Designations of Origin in Galicia (Northwest Spain). In this case,
all fungicides were noticed in, at least, one of the investigated samples. Compounds dissipation was noticed in those points where
pairs of samples were taken in autumn and at the end of winter (vineyards 1 to 4). Regarding EFs, those meassured for BEN,
TEB and MYC were equal to 0.50; thus, no enantioselective degradation processes were identified. In case of PEN, EF values measured in October and March were equivalent in vineyards codes
1 and 2, although in vineyard code 1 a value below 0.5 was
found in both sampling campaigns (Table 4). Finally, the EFs of
MET, and their variation between samples obtained at different
dates from same vineyard, differ as function of the sampling point.
At vineyard code 3, MET-R was the predominant form in October without observing compound enantiomerization in March.
EFs obtained for MET at vineyards 4 and 5 show a prevalence
of MET-S. Since fungicidal preparations containing only MET-S are
not commercially available, EFs above 0.5 are possible assuming a faster degradation of the R-form than that of S-isomer in
these vineyards. On the other hand, at vineyards 1,2 and 7, the
R-enantiomer was noticed at higher concentration than the Sform. In the particular case of vineyard 1, faster dissipation of
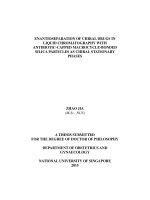
MET-S compared to the R-form can be concluded from EFs measured in October and March (0.37 ± 0.01 and 0.28 ± 0.01, respectively). The SFC chromatograms for the most intense product
ion of MET in soil samples showing different EFs are shown in
Fig. 3.
76
27
108
50
L. Pérez-Mayán, M. Ramil, R. Cela et al.
L. Pérez-Mayán, M. Ramil, R. Cela et al.
Journal of Chromatography A 1644 (2021) 462124
Fig. 3. Chromatographic profiles for the enantiomers of MET in soil samples obtained from different vineyards at the same date (October 2018). A, vineyard code 4. B,
vineyard code 2. Vineyard code 1.
Table 5
Percentage of each fungicide remaining in soil after 66 days of incubation (n=2 replicates).
Vineyard
soil code
MET
BEN
TEB
Aerobic
Sterilized
Aerobic
Sterilized
Aerobic
Sterilized
Aerobic
Sterilized
Aerobic
Sterilized
2
3
4
54%
53%
7%
108%
89%
90%
54%
54%
16%
92%
92%
92%
100%
89%
74%
99%
84%
92%
98%
90%
90%
100%
86%
113%
96%
91%
82%
105%
97%
89%
dissipated percentages of MET and BEN varied depending on the
vineyard soil. In both cases, the lowest residue level was found in
the same soil.
The average EFs at days 0 and 66 (n= 2 replicates) are given
in Table S3. As expected, in case of compounds not removed during the experiment (TEB, MYC and PEN), EFs measured at days
0 and 66 were equivalent. For BEN, the EFs slightly decreased at
day 66 compared to those calculate at zero time in soils from
vineyards codes 2 and 3, but not in soil from vineyard code 4.
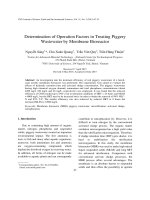
The plot showing evolution of EF values for BEN and total compound concentration in the three soils involved in the study is provided as supplementary information (Fig. S4). Finally, the change
in the EFs of MET depended on the soil matrix. Fig. 4 summarizes the time-course evolution of MET and the EFs of the compound during the incubation experiment. Samples from vineyards
3 and 4 were spiked with the racemate at 200 ng g−1 at day
0, whereas the initial concentration in the sample from vineyard
PEN
MYC
code 2 corresponds to the native residue of MET existing in this
soil. The kinetics of MET removal was sample dependent, with a
much faster dissipation in soil number 4 (Fig. 4A), which matches
the trend observed for BEN in same sample (Fig. S4). The evolution of the EFs of MET were also different between samples from
vineyards codes 2 and 3, with a faster dissipation of MET-S (EFs
decreased steady with incubation time), to that observed in vineyard soil code-4 (Fig. 4B). In the latter case, MET-R was degraded
completeley after 14 days of incubation, leading to EF values close
to 1. Thus, in agreement with data obtained under field conditions (Table 4), MET-R was less stable than MET-S in soil from
vineyard code 4. Faster degradation of MET-R versus the S-form
has been related to basic soils; however, the pH of soil obtained
from vineyard code 4, and employed in the incubuation experiment, was slightly acidic, and intermediate between those corresponding to the other two samples involved in the same study
(Table S1).
8
L. Pérez-Mayán, M. Ramil, R. Cela et al.
Journal of Chromatography A 1644 (2021) 462124
Vineyard soil-2
Vineyardsoil-3
A
Vineyardsoil-4
MET conce ntrati on (ng g-1)
250
200
150
100
50
0
0
10
20
Vineyard soil 2
30
40
IncubaƟon Ɵme (days)
Vineyard soil 3
50
60
70
B
Vineyard soil 4
EF (MET-S/(MET-S + MET-R))
1.20
1.00
0.80
0.60
0.40
0.20
0.00
0
10
20
30
40
50
60
70
IncubaƟon Ɵme (days)
Fig. 4. Time-course evolution of MET in soils from 3 different vineyards in laboratory dissipation studies, average values of duplicate assays. A, total concentration. B, EF
data (MET-S/(MET-S + MET-R). Soil from vineyards 3 and 4 were spiked with the racemic standard of MET (200 ng g−1 ). Soil from vineyard 2 contained significant levels of
MET; thus, it was not fortified with this compound in the laboratory dissipation study.
4. Conclusions
CRediT authorship contribution statement
SFC-ESI-QTOF-MS permitted the chiral, sensitive determination
of five fungicides widely employed in viticulture and, in general,
in agriculture. The modifier added to supercritical CO2 was the
only parameter showing a significant influence on the selectivity of
chiral separations. On the other hand, additives played compound
and mobile phase dependent effects in the yield of their ionization at the ESI source. Data obtained for processes samples (wines
and soils) point out to the fact that vineyards are still treated with
formulations including the very low active enantiomer of MET (Sform). Thus, without a record of vines treatments, through analysis
of commercial wines is hard to investigate potential enantioselective removal of MET isomers during interaction with vines and/or
through vinification steps. As regards vineyard soils, field data and
laboratory experiments confirmed the enantioselective degradation
of MET. The relative dissipation rates of R and S-forms differed significantly among soils from different vineyards. Despite BEN belongs to the same chemical family as MET, variations of its EFs
during soil incubation assays were more subtle.
L. Pérez-Mayán: Investigation, Methodology, Writing - review
& editing. M. Ramil: Data curation, Formal analysis, Writing - review & editing. R. Cela: Project administration, Funding acquisition,
Writing - review & editing. I. Rodríguez: Conceptualization, Funding acquisition, Funding acquisition, Writing - original draft.
Acknowledgments
L.P.M acknowledges a FPU grant to the Spanish Ministry of Science. This study was supported by Xunta de Galicia and Spanish Government through grants GRC-ED431C 2017/36, PGC2018094613-B-I00, both co-funded by the EU FEDER program.
Supplementary materials
Supplementary material associated with this article can be
found, in the online version, at doi:10.1016/j.chroma.2021.462124.
References
[1] N. Cui, H. Xu, S. Yao, Y. He, H. Zhang, Y. Yu, Chiral triazole fungicide tebuconazole: enantioselective bioaccumulation, bioactivity, acute toxicity, and dissipation in soils, Environ. Sci. Pollut. Res. 25 (2018) 25468–25475, doi:10.1007/
s11356- 018- 2587- 9.
[2] Y. Li, F. Dong, X. Liu, J. Xu, X. Chen, Y. Han, W. Liang, Y. Zheng, Development
of a multi-residue enanatiomeric analysis method for 9 pesticides in soil and
water by chiral liquid chromatography/tandem mass spectrometry, J. Hazard.
Mat. 250-251 (2013) 9–18, doi:10.1016/j.jhazmat.2013.01.071.
Declaration of Competing Interest
The authors declare that they have no known competing financial interests or personal relationships that could have appeared to
influence the work reported in this paper.
9
L. Pérez-Mayán, M. Ramil, R. Cela et al.
Journal of Chromatography A 1644 (2021) 462124
[3] A.R. Fontana, I. Rodríguez, M. Ramil, J.C. Altamirano, R. Cela, Solid-phase extraction followed by liquid chromatography quadrupole time-of-flight mass
spectrometry for the selective determination of fungicides in wine samples,
J. Chromatogr. A 128 (2011) 2165–2175, doi:10.1016/j.chroma.2011.02.025.
[4] A. Santana-Mayor, R. Rodríguez-Ramos, B. Socas-Rodríguez, C. Díaz-Romero,
M.A. Rodríguez-Delgado, Comparison of pesticide residue levels in red wines
from Canary islands, Iberian Peninsula and Cape Verde, Foods 9 (2020) 1555,
doi:10.3390/foods9111555.
[5] A. Bermúdez-Couso, M. Arias-Estévez, J.C. Nóvoa-Moz, E. López-Periago,
B. Soto-González, J. Simal-Gándara, Seasonal distributions of fungicides in soils
and sediments of a small river basin partially devoted to vineyards, Water Res.
41 (2007) 4515–4525, doi:10.1016/j.watres.2007.06.029.
[6] E. Pose-Juan, M.J. Sánchez-Martín, M.S. Andrades, M.S. Rodríguez-Cruz,
E. Herrero-Hernández, Pesticide residues in vineyard soils from Spain: spatial
and temporal distributions, Sci. Total Environ. 514 (2015) 351–358, doi:10.1016/
j.scitotenv.2015.01.076.
[7] P. Cabras, A. Angioni, Pesticide residues in grapes, wine, and their processing
products, J. Agric. Food Chem. 48 (20 0 0) 967–973, doi:10.1021/jf990727a.
[8] F. Cus, H.B. Cesnik, S.V. Bolta, A. Gregoric, Pesticide residues in grapes and
during vinification process, Food Control 21 (2010) 1512–1518, doi:10.1016/j.
foodcont.2010.04.024.
[9] L. Pérez-Mayán, M. Ramil, R. Cela, I. Rodríguez, Multiresidue procedure to assess the occurrence and dissipation of fungicides and insecticides in vineyard soils from Northwest Spain, Chemosphere (2020) 261, doi:10.1016/j.
chemosphere.2020.127696.
[10] Decision (EU) 2020/1161 establishing a watch list of substances for Union-wide
monitoring. Official journal of the European Union of 6 august 2020. L 257/32.
[11] A. Monkiedje, M. Spiteller, K. Bester, Degradation of racemic and enantiopure
metalaxyl in tropical and temperate soils, Environ. Sci. Technol. 37 (2003) 707–
712, doi:10.1021/es020123e.
[12] I.J. Buerge, T. Poiger, M.D. Müller, H.R. Buser, Enantioselective degradation of
metalaxyl in soils: chiral preference changes with soil pH, Environ. Sci. Technol. 37 (2003) 2668–2674, doi:10.1021/es0202412.
[13] J. Gu, C. Ji, S. Yue, D. Shu, F. Su, Y. Zhang, Y. Xie, Y. Zhang, W. Liu, M. Zhao,
Enantioselective effects of metalaxyl enantiomers in adolescent rat metabolic
profiles using NMR-based metabolomics, Environ. Sci. Technol. 52 (2018)
5438–5447, doi:10.1021/acs.est.7b06540.
[14] X. Wang, X. Wang, H. Zhang, C. Wu, X. Wang, H. Xu, X. Wang, Z. Li, Enantioselective degradation of tebuconazole in cabbage, cucumber, and soils, Chirality
24 (2012) 104–111, doi:10.1002/chir.21030.
[15] Y. Li, F. Dong, X. Liu, J. Xu, Y. Han, Y. Zheng, Enantioselectivity in tebuconazole
and myclobutanil non-target toxicity and degradation in soils, Chemosphere
122 (2015) 145–153, doi:10.1016/j.chemosphere.2014.11.031.
[16] Q. Zhang, X. Hua, Y. Yang, W. Yin, M. Tian, H. Shi, M. Wang, Stereoselective
degradation of flutriafol and tebuconazole in grape, Environ. Sci. Pollut. Res.
22 (2015) 4350–4358, doi:10.1007/s11356- 014- 3673- 2.
[17] Z. Shen, W. Zhu, D. Liu, X. Xu, P. Zhang, Z. Zhou, Stereoselective degradation of
tebuconazole in rat liver microsomes, Chirality 24 (2012) 67–71, doi:10.1002/
chir.21027.
[18] B. Gámiz, G. Facenda, R. Celis, Evidence for the effect of sorption enantioselectivity on the availability of chiral pesticide enantiomers in soil, Environ. Pollut.
213 (2016) 966–973, doi:10.1016/j.envpol.2016.03.052.
[19] Q. Zhang, L. Zhou, Y. Yang, X. Hua, H. Shi, M. Wang, Study on the stereoselective degradation of three triazole fungicides in sediment, Ecotoxicol. Environ.
Saf. 117 (2015) 1–6, doi:10.1016/j.ecoenv.2015.03.014.
[20] P. Zhao, J. Zhao, S. Lei, X. Guo, L. Zhao, Simultaneous enantiomeric analysis of
eight pesticides in soils and river sediments by chiral liquid chromatographytandem mass spectrometry, Chemosphere 204 (2018) 210–219, doi:10.1016/j.
chemosphere.2018.03.204.
[21] C. West, Recent trends in chiral supercritical fluid chromatography, Trends
Anal. Chem. 120 (2019) 115648, doi:10.1016/j.trac.2019.115648.
[22] S. Bieber, G. Greco, S. Grosse, T. Letzel, RPLC-HILIC and SFC with mass
spectrometry: polarity-extended organic molecule screening in environmental
water samples, Anal. Chem. 89 (2017) 7907–7914, doi:10.1021/acs.analchem.
7b00859.
[23] M. Ishibashi, Y. Izumi, M. Sakai, T. Ando, E. Fukusaki, T. Bamba, Highthroughput simultaneous analysis of pesticides by supercritical fluid chromatography coupled with high-resolution mass spectrometry, J. Agric. Food
Chem. 63 (2015) 4457–4463, doi:10.1021/jf5056248.
[24] V. Cutillas, M. Murcia-Morales, M. Gómez-Ramos, S.M. Taha, A.R. FernándezAlba, Supercritical fluid chromatography coupled to tandem mass spectrometry for the analysis of pesticide residues in dried spices. Benefits and drawbacks, Anal. Chim. Acta 1059 (2019) 124–135, doi:10.1016/j.aca.2019.01.010.
[25] V. Cutillas, M. García-Valverde, M. Gómez-Ramos, F.J. Díaz-Galiano, C. Ferrer,
A.R. Fernández-Alba, Supercritical fluid chromatography separation of chiral
pesticides: unique capabilities to study cyhalothrin and metalaxyl as examples,
J. Chromatogr. A. 1620 (2020) 461007, doi:10.1016/j.chroma.2020.461007.
[26] V. Silva, H.G.J. Mol, P. Zomer, M. Tienstra, C.J. Ritsema, V. Geissen, Pesticide
residues in European agricultural soils- a hidden reality unfolded, Sci. Total
Environ. 653 (2019) 1532–1545, doi:10.1016/j.scitotenenv.2018.10.441.
[27] G. Castro, L. Pérez-Mayán, T. Rodríguez-Cabo, I. Rodríguez, M. Ramil, R. Cela,
Multianalyte, high-throughput liquid chromatography tandem mass spectrometry method for the sensitive determination of fungicides and insecticides in wine, Anal. Bioanal. Chem. 410 (2018) 1139–1150, doi:10.1007/
s00216- 017- 0724- 9.
[28] J. Masbou, F. Meite, B. Guyot, G. Imfeld, Enantiomer-specific stable carbon isotope analysis (ESIA) to evaluate degradation of the chiral fungicide metalaxyl
in soils, J. Hazard. Mater. 353 (2018) 99–107, doi:10.1016/j.jhazmat.2018.03.047.
[29] F. Yang, Y. Wang, S. Liu, C. He, X. Tao, H. Deng, G. Tang, Z. Bian, Z. Fan, A
green and effective method for the determination of metalaxyl enantiomers
in tobacco and soil by supercritical fluid chromatography–tandem mass spectrometry, Chirality 32 (2020) 505–514, doi:10.1002/chir.23184.
[30] T. Harner, K. Wiberg, R. Norstrom, Enantiomer fractions are preferred to enantiomer ratios for describing chiral signatures in environmental analysis, Environ. Sci. Technol. 34 (20 0 0) 218–220, doi:10.1021/es9906958.
[31] C. Hamman, D.E. Schmidt, M. Wong, M. Hayes, The use of ammonium hydroxide as an additive in supercritical fluid chromatography for achirar and chiral separations and purifications of small, basic medicinal molecules, J. Chromatogr. A 1218 (2011) 7886–7894, doi:10.1016/j.chroma.2011.08.064.
[32] European commision - pesticides database, (n.d.). />plant/pesticides/eu-pesticides-database/public/?event=homepage&language=
EN.
10