Comprehensive on-line two-dimensional liquid chromatography × supercritical fluid chromatography with trapping column-assisted modulation for depolymerised lignin analysis
Bạn đang xem bản rút gọn của tài liệu. Xem và tải ngay bản đầy đủ của tài liệu tại đây (2.36 MB, 10 trang )
Journal of Chromatography A, 1541 (2018) 21–30
Contents lists available at ScienceDirect
Journal of Chromatography A
journal homepage: www.elsevier.com/locate/chroma
Comprehensive on-line two-dimensional liquid
chromatography × supercritical fluid chromatography with trapping
column-assisted modulation for depolymerised lignin analysis
Mingzhe Sun, Margareta Sandahl, Charlotta Turner ∗
Lund University, Department of Chemistry, Centre for Analysis and Synthesis, P.O. Box 124, SE-22100 Lund, Sweden
a r t i c l e
i n f o
Article history:
Received 14 November 2017
Received in revised form 29 January 2018
Accepted 5 February 2018
Available online 6 February 2018
Keywords:
Lignin
Phenolic compound
Supercritical fluid chromatography
Trapping capacity
Two-dimensional chromatography
a b s t r a c t
Lignin depolymerisation produces a large variety of low molecular weight phenolic compounds that can
be upgraded to value-added chemicals. Detailed analysis of these complex depolymerisation mixtures is,
however, hampered by the lack of resolving power of traditional analysis techniques. In this study, a novel
online comprehensive two-dimensional reversed-phase liquid chromatography (RPLC) × supercritical
fluid chromatography (SFC) method with trapping column interface was developed for the separation
of phenolic compounds in depolymerised lignin samples. The trapping capacities of different trapping
columns were evaluated. The influence of large volume water-containing injection on SFC performance
was studied. The relation between peak capacity and first dimension flow rate and gradient was investigated. The optimized method was applied for the analysis of a depolymerised lignin sample. The
RPLC × SFC system exhibited high degree of orthogonality. Compared with traditional loop based interface, trapping column interface can significantly shorten the analysis time and offer higher detectability,
with the disadvantage of more severe undersampling in the first dimension.
© 2018 The Authors. Published by Elsevier B.V. This is an open access article under the CC BY-NC-ND
license ( />
1. Introduction
Biomass holds potential to partly replace petroleum as a
raw material for production of fuels and valuable fine and bulk
chemicals [1]. Lignin is a naturally occurring polymer made
up from phenyl-propenoid units, decorated by hydroxy- and
methoxy-groups. These are connected through radical polymerisation mechanisms, resulting in several types of bonds between the
constituent building blocks. Terrestrial biomass consists primarily
of the macromolecules lignin, cellulose and hemicellulose. Lignin
could be an important source for the production of aromatic chemicals if well harnessed [2]. One of the key steps of conversion of lignin
to value-added chemicals is the depolymerisation − by selective
bond cleavage – of lignin into low molecular weight phenolic compounds, which in turn can be used for chemical production. Many
techniques have been developed and are continuously improved
for the purpose of depolymerisation [3]. Due to the structural complexity of lignin and the large variance in the monomeric unit
composition of different kinds of lignin, the depolymerisation products are usually very complex mixtures of aliphatic and phenolic
∗ Corresponding author.
E-mail address: (C. Turner).
compounds, the compositions of which vary greatly depending on
the lignin type and depolymerisation method applied [3].
Gas chromatography coupled with mass spectrometry is the
most widely adopted method for the analysis of lignin depolymerisation products [4]. However, this technique requires a rather
complicated sample preparation, usually including extraction and
derivatisation, which may have preference towards certain classes
of compounds if not carefully performed. Also, the relatively low
selectivity hinders the usage of this technique, if profiling all major
components is the aim instead of analysis of only a few selected
compounds. High-performance liquid chromatography (HPLC) or
ultrahigh performance liquid chromatography (UHPLC) have also
been used in the analysis of lignin-derived compounds [5,6]. However, these techniques also lack the separation power to fully
resolve all major components for profiling study.
Multidimensional chromatography has been widely applied in
various fields as it offers tremendously improved resolving power
compared with their one-dimensional chromatography counterparts. Lignin pyrolysis bio-oil analysis by two-dimensional gas
chromatography (2DGC) has been reported in recent years [7,8].
As a complementary technique to 2DGC, two-dimensional liquid chromatography (2DLC) also holds a large potential in the
analysis of complex samples like lignin depolymerization mixtures. It can overcome the disadvantage of 2DGC in the analysis
/>0021-9673/© 2018 The Authors. Published by Elsevier B.V. This is an open access article under the CC BY-NC-ND license ( />0/).
22
M. Sun et al. / J. Chromatogr. A 1541 (2018) 21–30
of compounds that are comparatively non-volatile, highly polar or
thermally unstable [9].
One of the most important considerations in 2DLC method
development is how to achieve a high degree of orthogonality
in order to maximise the effective 2D peak capacity [10]. This
is usually done by setting the two separation mechanisms on
both dimensions as orthogonal as possible. In general, the most
commonly used modes in LC separation include reversed-phase
liquid chromatography (RPLC), normal-phase liquid chromatography (NPLC), hydrophilic interaction liquid chromatography (HILIC),
size exclusion chromatography (SEC) and ion exchange chromatography (IEC). However, combinations of two reversed phase
liquid chromatography (RPLC × RPLC) are still preferred, as most of
the other − apparently more orthogonal combinations – such as
NPLC × RPLC and HILIC × RPLC suffer from solvent incompatibility
issues [11–13].
In order to address the relatively low degree of orthogonality
issue with RPLC × RPLC, the combination of supercritical fluid chromatography (SFC) and RPLC can be a feasible and promising option.
In general SFC displays a separation mechanism resembling that of
NPLC [14]. However, the selectivity can be tuned in a wider range
as both polar and non-polar columns can be used and mobile phase
temperature and pressure play important roles [15,16]. The potential of SFC as the first dimension in an online SFC × RPLC system
has been demonstrated by Francois and co-workers [17–19]. To
better harness the high efficiency and fast separation of SFC, efforts
have also been made to use online multiple heart-cutting LC-SFC,
in particular for pharmaceutical achiral-chiral analysis [20]. Online
comprehensive RPLC × SFC with traditional collection loops as the
interface has also been investigated for the analysis of traditional
Chinese medicine and processed biomass oil [21,22]. However,
compared with RPLC used as second dimension in a 2D online
LC × LC system, SFC imposes stricter limitation on the amount of
eluent transferred to the second dimension in a 2D RPLC × SFC
design. Transfer volumes within the normal range of a 2D LC × LC
system can cause significant peak broadening and misshaping, as
well as pressure spikes at the beginning of a second dimension run
and pressure build-up with continuous 2D runs in a RPLC × SFC system [21]. Consequently, a very low flow rate (<0.02 mL/min) needs
to be used in the first dimension LC with traditional loop collection in the interface, considering the feasible modulation length.
A low first dimension flow rate leads to relatively long analysis
time and high dilution factor. One way to address this issue is to
introduce an analyte retention and concentration step between the
two dimensional separations. The use of trapping columns in the
interface of 2DLC systems has been reported in recent years by
several authors [18,23,24], and very well summarised as a solution for both circumventing solvent incompatibility and focusing
the transferred fraction in two reviews [25,26]. This approach does
not only increase the signal to noise ratio as analytes in the first
dimension eluents are concentrated into narrow bands, but also
allows higher flow rate to be used in the first dimension. However, thorough evaluation and comparison of different trapping
columns before method development and the investigation of trapping column assisted modulation on method repeatability were not
performed in any of the published studies. Also, two-dimensional
liquid chromatography has to our knowledge never been applied
for the analysis of depolymerised lignin samples.
In the present study, a comprehensive 2D RPLC × SFC method
was developed for the separation of small phenolic compounds
in depolymerised lignin samples. Different trapping columns were
evaluated and compared with collection loops as the interface. The
effect of the large volume water-rich first dimension eluent on
the second dimension separation was studied, and the advantages
and disadvantages of replacing the collection loops with trapping
columns were investigated. The repeatability of trapping column
assisted modulation is reported.
2. Experimental
2.1. Materials and reagents
A standard mixture composed of 40 representative phenolic
compounds typically produced in lignin depolymerisation dissolved in 9:1 water:acetonitrile (volumetric ratio) was used (List
in supplement, see Table S1). All lignin phenols were obtained
from Sigma Chemical Co. (St. Louis, Missouri, USA). Acetonitrile
was obtained from Scharlau (Barcelona, Spain). Ethyl acetate was
purchased from Fisher Scientific (Waltham, MA USA). All organic
solvents were of HPLC grade or above. All water used was from
a Milli-Q Water Purification System with a UV unit. A sample
of depolymerised lignin (Pd-catalysed depolymerisation of lignin
from birch wood, monomeric fraction) was also used and was
kindly provided by Associate Professor Joseph S. M. Samec from
Stockholm University.
2.2. Apparatus
The experiments were conducted on a home-built comprehensive 2D RPLC × SFC system consisting of a SFC controlling module
(G4301A, Agilent Technologies), two binary pumps (G4302A for
SFC, G4220A for LC, Agilent Technologies), two diode array
detectors (G1315C for SFC, G4212B for LC, Agilent Technologies), an autosampler (G4303A, Agilent Technologies), a degasser
(G4225A, Agilent Technologies), a thermostated column compartment (G1316C, Agilent Technologies) and a flexible cube
module (G4227, Agilent Technologies). A 2-position/4-port-duo
valve (5067–4214, Agilent Technologies) is controlled by one of
the two drives inside the flexible cube module. The scheme of the
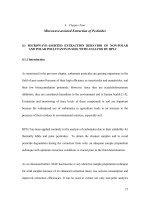
2D RPLC × SFC system is shown in Fig. 1. The system was controlled
by an Agilent Openlab CDS Chemstation C.01.07 software. All the
one dimension data were evaluated with Agilent Chemstation software. All the 2D data were processed using GC Image software (GC
Image, Lincoln, NE, USA).
2.3. Trapping column performance evaluation
2.3.1. Trapping capacity
Three trapping columns were tested: Agilent Eclipse Plus C18,
2.1*5 mm, 1.8 m (EC-C18), Agilent Eclipse Plus phenyl-hexyl,
2.1*5 mm, 1.8 m (EC-PH) and Waters VanGuard Torus Diol,
2.1*5 mm, 1.7 m (VG-Diol). No temperature control was applied
on the trapping columns. The separation column used in the first
dimension RPLC was an Agilent Zorbax Eclipse Plus C18 column
(2.1*100 mm, 1.8 m). For the evaluation of the three different trapping columns, three flow rates 0.03, 0.05 and 0.08 mL/min were
applied in the first dimension. The mobile phase consisted of H2 O
(A) and acetonitrile (ACN) (B) in a gradient that was set to start
from 10% (vol.) of B to 50% (vol.) of B in different lengths of time
depending on the flow rate. For all experiments in this section, the
first dimension LC column temperature was set to 50 ◦ C. A standard mixture composed of 4-hydroxybenzoic acid, acetosyringone
and veratraldehyde (all 200 mg/L) dissolved in 9:1 water:ACN (volumetric ratio) was used and the first dimension injection volume
was 5 L.
A Waters Torus Diol (3.0*50 mm, 1.7 m) column was used in
the second dimension SFC separation. The column temperature was
set at 50 ◦ C and the backpressure regulator (BPR) at 130 bar. The
flow rate was 1.5 mL/min, the mobile phase consisted of CO2 (A)
and acetonitrile (B) and the gradient was set to start from 3% (vol.)
of B to 30% (vol.) of B in 2.0 min.
M. Sun et al. / J. Chromatogr. A 1541 (2018) 21–30
23
Fig. 1. Scheme of 2D RPLC × SFC system. A: the eluent from the first dimension is being collected by trapping column A and the content in trapping column B is being flushed
into the second dimension column for analysis (back-flush). B: vice versa.
One of the trapping columns installed in the interfacing switching valve was replaced with one short tubing connecting the LC flow
path when no compound peak was eluting. The trapping column
was switched to the LC flow path to collect eluents of interest. Different volumes of the first dimension eluent across the peak apexes
flow through the trapping column and then transferred to the second dimension for analysis by setting different valve switching
times (Fig. 2).
was eluting. The trapping column was switched to the LC flow path
to collect 0.8 min of eluent across the analyte peaks, and then it was
switched back to the SFC flow path for analysis of the analytes collected. The repeatability tests were done by 6 successive injections
of the mixture in one day and injections of the same mixture in 3
non-consecutive days.
2.3.2. The influence of sample matrix on trapping capacity
Agilent EC-PH 2.1*5 mm, 1.8 m trapping column was used
for evaluation of the influence of sample matrix on the trapping
capacity. The chromatographic conditions were kept the same
as described in the previous section, except that 0.05 mL/min
was used as the 1st dimension flow rate. For the assessment
of the impact of sample matrix, the same depolymerised lignin
matrix was spiked with 4-hydroxybenzoic acid, acetosyringone
and veratraldehyde of different concentrations. Standard mixtures
composed of 4-hydroxybenzoic acid, acetosyringone and veratraldehyde of different concentrations dissolved in 9:1 water:ACN
(volumetric ratio) were also used for comparison.
One-dimension stand-alone SFC was used in this section. Different volumes (1–10 L) of a veratraldehyde (200 mg/L) solution
dissolved in different compositions of acetonitrile:water (9:1, 1:1,
1:9, all volumetric ratios) were injected. The separation column
used was a Waters UPC2 Torus Diol (3.0*50 mm, 1.7 m). The column temperature was set to 50 ◦ C and the BPR at 130 bar. The
mobile phase consisted of CO2 (A) and acetonitrile (B) and the gradient was set to start from 10% (vol.) of B to 35% (vol.) of B in 1 min
and the flow rate was set at 3.0 mL/min.
2.3.3. Repeatability test
The same mixture used in the previous section was used for
repeatability tests, the injection volume was 5 L. The column
used in the first dimension was an Agilent Zorbax Eclipse Plus C18
column (2.1*100 mm, 1.8 m). 0.05 mL/min was applied as flow
rate in the first dimension. The column temperature was set to
50 ◦ C. The mobile phase consisted of H2 O (A) and acetonitrile (B)
and the gradient was set to starting from 10% (vol.) of B to 70%
(vol.) of B in 45 min. The second dimension conditions were the
same as described in the previous section. One Agilent Eclipse Plus
phenyl-hexyl, 2.1*5 mm, 1.8 m trapping column was installed in
the interface with a short tubing installed on the other position of
the interface connecting the LC flow path when no compound peak
2.4. SFC injection volume study
2.5. First dimension RPLC peak capacity study
The 40 lignin model compounds standards mixture was used for
the peak capacity study of the first dimension RPLC. The column
used in the first dimension was an Agilent Zorbax Eclipse Plus C18
column (2.1*100 mm, 1.8 m). The mobile phase consisted of H2 O
(A) and acetonitrile (ACN) (B). The study consists of two parts: linear
gradients from 10 to 70% B at different gradient time/void time
ratios (tg /t0 ), using a flow rate 0.05 mL/min; and linear gradients
from 10 to 70% B with a constant tg /t0 of 12 were applied with
varied flow rates.
2.6. Second dimension SFC column selection
The 40 standard mixture was used for column screening. Four columns were screened for the second dimension
24
M. Sun et al. / J. Chromatogr. A 1541 (2018) 21–30
Fig. 2. Chromatogram showing the collection time of different volumes of eluent across the peak apex. Analyte: acetosyringone (dissolved in 90:10 water:ACN, 200 mg/L).
SFC separation: Waters UPC2 Torus 2-PIC (2-Picolylamine,
3.0*50 mm, 1.7 m); Waters UPC2 Torus Diol (High density diol, 3.0*50 mm, 1.7 m); Waters UPC2 Torus 1-AA (1Aminoanthracene, 3.0*50 mm, 1.7 m); Waters UPC2 BEH (Silica,
3.0*50 mm, 1.7 m). The column temperature was set to 50 ◦ C and
the BPR was set at 130 bar. The modulation time was 0.8 min. The
second dimension was run at 3.0 mL/min. Gradient elution was
applied for all experiments. The mobile phase used in the second
dimension consisted of CO2 (A) and acetonitrile (B). The gradient
was set to start from 3% (vol.) of B to 30% (vol.) of B in 0.5 min; 30%
(vol.) of B to 3% (vol.) of B in 0.01 min and then hold at 3% B for
0.29 min. For the first dimension RPLC separation, an Agilent Zorbax Eclipse Plus C18 column (2.1*100 mm, 1.8 m) was used. The
column temperature was set to 50 ◦ C. The mobile phase consisted
of H2 O (A) and acetonitrile (B) and the gradient was set to starting
from 10% (vol.) of B to 70% (vol.) of B in 45 min. The flow rate was
set at 0.05 mL/min and the injection volume was 5 L.
in 60 min. The flow rate was set at 0.05 mL/min and the injection
volume was 5 L.
A Waters UPC2 Torus Diol (3.0*50 mm, 1.7 m) column was used
in the second dimension SFC separation. The column temperature
was set at 55 ◦ C and the BPR at 130 bar. The second dimension was
run at 3.0 mL/min, the mobile phase consisted of CO2 (A) and a
mixture of methanol (25 vol.%) and acetonitrile (75 vol.%) (B) and
the gradient was set to start from 7% (vol.) of B to 32% (vol.) of B
in 0.49 min; 32% (vol.) of B to 2% (vol.) of B in 0.01 min, then hold
at 2% for 0.20 min and increases from 2% (vol.) of B to 7% (vol.) of
B in 0.1 min. The second-dimension gradient started already in the
previous modulation, in order to compensate for the comparatively
large gradient delay volume of the system. Two Agilent Eclipse Plus
phenyl-hexyl, 2.1*5 mm, 1.8 m trapping columns were used in the
interface and the modulation time was 0.8 min.
2.7. RPLC × SFC of lignin sample using trapping columns
The same Agilent Zorbax Eclipse Plus C18 (2.1*100 mm, 1.8 m)
was used in the first dimension. The column temperature was 50 ◦ C.
The mobile phase consisted of H2 O (A) and acetonitrile (B) and the
gradient was set to starting from 10% (vol.) of B to 90% (vol.) of B
in 60 min and maintain 90% (vol.) of B for another 20 min. The flow
rate was set at 0.012 mL/min.
An Agilent Zorbax Eclipse Plus C18 (2.1*100 mm, 1.8 m) was
used in the first dimension. The column temperature was 50 ◦ C.
The mobile phase consisted of H2 O (A) and acetonitrile (B) and the
gradient was set to starting from 10% (vol.) of B to 90% (vol.) of B
2.8. RPLC × SFC of lignin sample using collection loops
M. Sun et al. / J. Chromatogr. A 1541 (2018) 21–30
25
The second dimension conditions were the same as described in
Section 2.7. Two short capillaries of 10 L were used in the interface
and the modulation time was 0.8 min.
2.9. Chromatographic calculations
Experimental peak capacities for both dimensions were calculated based on:
j
n=
tn − t1
w
(1)
j represents the number of the dimension (1 or 2). tn and t1 are
the retention times of the last and first peak respectively, w is the
average 4 peak width.
Conditional 2D peak capacity was calculated according to [27]:
nco = ˇ × f × 1 n × 2 n
(2)
ˇ is the undersampling factor, which was calculated from [27]:
ˇ=
1
1 + 0.21 tm ⁄
(3)
2
1
tm is the modulation time. 1 is the time variance of the first dimension peak.
The coverage factor f was calculated using the ratio between
occupied retention space and theoretically available retention
space, which has been introduced in detail in reference [27].
3. Results and discussion
SFC has been applied in our previous work to the targeted analysis of lignin-derived phenolic compounds [28]. As the complexity of
depolymerised lignin samples is far beyond the resolving power of
any one-dimensional technique, a comprehensive 2D chromatography system is needed in order to separate the major components
in such complex samples for non-target profiling purposes. The
high efficiency and speed of SFC makes it suitable to be placed in
the second dimension. In addition, a high degree of orthogonality
may also be generated by a 2D RPLC × SFC design. The use of trapping columns in the interface can potentially retain and transfer the
analyte without introducing excessive amount of first dimension
mobile phase into the second dimension separation.
3.1. Trapping column capacity
In general, compounds are presented as bands of different
lengths after they are partially or completely trapped in a short
column. The length of the band largely depends on the width of the
compound peak in the first dimension, the elution strength of the
first dimension eluent and the specific interactions between the
compound and the trapping stationary phase [29].
The three trapping columns investigated here have similar internal volume (∼10 L), but will interact with lignin-derived phenols
differently. The C18 trapping column retains phenolic compounds
mainly by dispersion force. The retention of the phenyl-hexyl trapping column is a mixture of hydrophobic interaction and -
interaction of the benzene rings. The DIOL trapping column offers
hydrogen bonding and dipole-dipole interaction with the phenolic
compounds. Another important factor that determines the retention of the compounds is the elution strength and transfer volume
of the 1st dimension eluent after a compound is transferred into
the trapping column until the valve switches. The three phenolic
compounds selected for assessing the trapping capacity represents
three categories of lignin-derived phenols that are prevalent in
depolymerised lignin samples: phenolic acids (4-hydroxybenzoic
acid), phenolic ketones (acetosyringone) and phenolic aldehydes
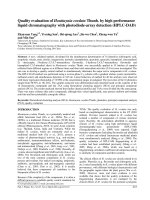
Fig. 3. Trapping capacity of trapping column interface for representative ligninderived phenolic compounds.
(veratraldehyde), which were well spread in the first dimension
chromatogram with a gradient elution.
In general, all three trapping columns showed only limited trapping capacity for the three compounds, which can be attributed to
the small volumes of the columns. However, the three trapping
columns showed quite different retaining behavior of the three
phenol types. Fig. 3 shows the retention of the compounds when
the first dimension flow rate was set at 0.05 mL/min. Under this first
dimension conditions, 4-hydroxybenzoic acid, acetosyringone and
veratraldehyde eluted at approximately 24%, 34% and 43% (vol.) of
26
M. Sun et al. / J. Chromatogr. A 1541 (2018) 21–30
Table 1
Retention time repeatability of trapping column assisted modulation.
Parameter
1st dimension RSD (RT)
Compound
Within-day (%)
Between-day (%)
4HA
0.23
0.59
AC
0.10
0.10
1st dimension RSD (A)
VE
0.06
0.11
4HA
0.23
2.5
AC
0.23
2.4
2nd dimension RSD (RT)
VE
0.22
2.5
4HA
0.10
1.1
AC
0.39
0.57
2nd dimension RSD (A)
VE
1.0
7.9
4HA
2.6
3.5
AC
1.7
2.7
VE
1.7
2.4
RT stands for retention time; A stands for peak area; 4HA stands for 4-hydroxybenzoic acid; AC stands for acetosyringone and VE stands for veratraldehyde.
ACN respectively and the peak width at the base of all three analytes detected in the first dimension DAD is approximately 0.6 min.
It can be seen from Fig. 3(b) that the C18 column retains acetosyringone and veratraldehyde better than 4-hydroxybenzoic acid.
The elution strength of the 1st dimension eluent was relatively
higher when acetosyringone and veratraldehyde eluted, compared
with 4-hydroxybenzoic acid. However, acetosyringone and veratraldehyde have three and two methyl moieties respectively, which
can contribute to the retention. The amount of acetosyringone and
veratraldehyde trapped in the short C18 trapping column kept
increasing up to a collection time of 0.8 min and 1.0 min respectively. However, 4-hydroxybenzoic acid appeared to be poorly
retained by the C18 column, significant breakthrough occurred at
collection times >0.6 min. This can be attributed to the fact that 4hydroxybenzoic acid lacks in alkyl moieties that can interact with
C18 strongly and a significant part of the 4-hydroxybenzoic acid
molecules (pKa = 4.54) were in anionic form and preferred strongly
to stay in the mobile phase.
Compared with the other two trapping columns, the DIOL
column showed apparently a lower retention of veratraldehyde.
Fig. 3(c) showed that apparent breakthrough of veratraldehyde
started to occur (0.8 min) shortly after most of it was trapped in
the column (∼0.6 min). Veratraldehyde eluted at the lowest water
content of the 1st dimension eluent compared with the other two
compounds tested. As water has good H-bonding and is regarded
as a strong solvent with a DIOL column, the low retention of veratraldehyde can only be explained by the absence of hydroxyl
or carboxyl groups in the veratraldehyde molecular structure,
which makes it less favored to be retained by the DIOL stationary phase, compared with 4-hydroxybenzoic acid ( COOH) and
acetosyringone ( OH).
The phenyl-hexyl column exhibited good trapping capacity
of all three compounds with veratraldehyde being slightly more
retained than the other two (Fig. 3(a)). This indicated that the -
interaction of the benzene rings combined with the hydrophobic
interactions with the hexyl chain can effectively retain phenolic
compounds regardless of their differences in substituted functional
groups. The trapping capacity of the compounds largely depends on
the accessibility of the benzene ring, the number of alkyl moieties
and the number of double bonds on substituents. 4-hydroxybenzoic
acid eluted in 1st dimension C18 column at comparatively low
percent of ACN owning to the two polar substituents on the benzene ring. Its retention in the EC-PH trap can be attributed to the
higher accessibility of the benzene ring compared with the other
two compounds with more than two substitution groups. For acetosyringone and veratraldehyde that eluted in 1st dimension eluent
with relatively higher elution strength, their retention could be
from the combinational effect of - interaction with the benzene
rings and hydrophobic interactions with the hexyl chain. It was also
found out that the retention time of 4-hydroxybenzoic acid in the
second dimension SFC with EC-PH trapping column is slightly lower
than with the other two trapping columns. This can be regarded as
beneficial for performing online RPLC × SFC of lignin-derive compounds, as the length of the modulation time is largely decided by
the elution of the most retained phenolic acids in certain modulations. Thus, the EC-PH trapping column was selected for further 2D
method development.
As the EC-PH trapping column showed only limited retention
of the compounds, the presence of matrix in real samples might
likely decrease the trapping capacity. The impact of matrix on
the trapping capacity of the chosen EC-PH column was therefore
investigated. For all three compounds tested, the EC-PH column
exhibited similar trapping capacity for a standard mixture and
a spiked depolymerised lignin sample at the collection time of
0.8 min (Fig. S1). However, it can be observed that the trapping
capacity became relatively lower for the spiked depolymerised
lignin matrix when the collection time exceeded 1.0 min. This trend
is especially apparent for 4-hydroxybenzoic acid, which is comparatively the least retained compound on this column among the
three compounds tested. This can be correlated to the presence
of other compounds in the matrix competing with the targeted
analytes on the limited trapping sites, causing faster and more
significant breakthrough at longer collection times.
As is shown in Fig. S2, the matrix also had a slight negative
impact on the trapping of compounds present at different concentrations, resulting in a relatively higher standard deviation for the
2nd dimension peak areas of the trapped compounds compared
with the standard mixture. When peak areas are plotted against
compound concentration, the linear relationship is slightly better
with the standard mixture points for all three compounds included
in the study.
A possible way to improve the trapping capacity can be active
modulation [23], which involves mixing of the first dimension eluent and a flow of weak solvent before the trapping column interface
to decrease the eluent strength and increase the trapping capacity.
One of the major concerns when using trapping column assisted
modulation is repeatability. As can be seen from Table 1, the retention times of 4-hydroxybenzoic acid and acetosyringone exhibited
comparable RSD values (within-day and between-day) in both
dimensions. The retention time RSD values of veratraldehyde in
the second dimension were higher than those in the first dimension. This is likely explained by the early elution of veratraldehyde
in the second dimension (k < 1). However, the RSD values are still in
the acceptable range. The second dimension peak area RSD values
of 4-hydroxybenzoic acid were higher than those of the other two
compounds. This can be the consequence of the limited trapping
capacity of 4-hydroxybenzoic acid on the EC-PH trapping column.
A slight shift of the first dimension peak retention time can cause
either incomplete trapping or breakthrough of the analyte, which
leads to second dimension peak area fluctuation.
3.2. The influence of transfer eluent volume and water content on
the second dimension SFC separation
It is apparent that larger-volume trapping columns can provide
higher trapping capacity, which would be beneficial in a RPLC × SFC
interface set-up. However, a large transfer volume can have detrimental effects on the second dimension SFC separation at the same
time, since a large volume of transferred organic-rich eluent can
lead to distorted early eluting peaks in the SFC. Furthermore, the
transfer of large volumes of water-rich eluent has been proven to
cause significant SFC pressure increase and accumulation at the
beginning of the modulations [21].
M. Sun et al. / J. Chromatogr. A 1541 (2018) 21–30
27
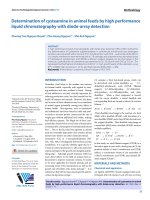
Fig. 4. Influence of injection volume and water content on SFC performance.
a) veratraldehyde in ACN:H2 O 1:9, different injection volumes; b) veratraldehyde in ACN:H2 O 1:1, different injection volumes; c) veratraldehyde in ACN:H2 O 9:1, different
injection volumes; d) veratraldehyde in different ACN:H2 O mixture, 5 L injection; e) pump pressure curves of different injections. See experimental section for specific
chromatographic conditions.
In order to investigate the influence of injection volume and
water content on SFC separation performance, different volumes
of veratraldehyde in sample diluents of high, medium and low
amount of water were injected. Veratraldehyde was chosen as it
elutes early in all four SFC columns screened in this study and is
more prone to peak distortion caused by the sample diluent [30].
As can be seen in Fig. 4, injections containing relatively high amount
of water lead to good peak shape up to 10 L (Fig. 4a). However, the
peak shape started to deteriorate at 10 L and 5 L respectively for
injection of medium and low percentages of water (Fig. 4b and c).
Another general observation is that the retention time of the analyte seemed to increase with increasing injection volume between
1 and 5 L for all three sample diluents. Furthermore, for the same
injection volume, increasing water content in the sample diluent
seems to prolong the analytes retention. Interestingly, sample diluents containing water has been proven to cause peak distortion for
relatively large injection volumes in SFC, which has been attributed
to demixing effect of water with mobile phase, strong solvent effect
and viscous fingering [30]. A plausible explanation for the good
peak shape with large volume of high water composition sample
injections in this study could be that for this short column with
relatively high mobile phase flow rate, the water containing injection solvent plug travels through the column in a very short time,
so that the extent of demixing of water in the mobile phase and
viscous fingering is minimal. Another very important factor that
has to be considered for 2D RPLC × SFC application is the pressure
increase caused by large volume injection of a water containing
solution. Fig. 4e shows that immediately after the injection, a pressure increase occurs before the normal pressure ramp caused by the
gradient (red circle). And the more water the injection solvent contains, the higher the pressure increase is. Moreover, Fig. 4d shows
that with the same injection volume, retention is decreased with
less water injected. Our hypothesis on these findings is that a temporary water layer is formed on the diol stationary phase at the
front end of the column after the sample plug reaches the inlet of
the column. The thickness of the water layer is determined by the
amount of water injected. This suggested water layer could perti-
nently increase the retention power of the stationary phase which
might be one of the reasons why retention increases with increasing
injection volume for the same sample diluent and with increasing water content in sample diluent of the same injection volume.
Also, the mobile phase channels in the column are narrowed by
the water layer, which causes a pressure spike right after injection.
The system pressure difference among different injections might
be another cause of different retention times observed, considering the compressibility of supercritical CO2 . Although it is not the
focus of this study, the effect of water as sample diluent on SFC
certainly deserves a thorough and systematic investigation in the
future.
Based on these results, trapping columns with larger volume
than 10 L are not favored in the 2D RPLC × SFC system, even
though it may offer higher trapping capacities. Also, the usage of
the selected trapping column in this study requires that the first
dimension LC separation should be controlled in a way that most
of the analytes are eluted before the gradient reaches very high
organic solvent percentage. Furthermore, the gradient in the first
dimension should be set as gradual as possible to avoid mismatch
of retention times of different fractions of the same peak.
3.3. First dimension RPLC peak capacity study
The influences of flow rate and gradient time/void time (tg /t0 )
on the first dimension RPLC peak capacity were investigated.
As can be seen in Fig. 5(a), the first dimension peak capacity
shows a seemingly positive logarithmic relationship with the ratio
between gradient time and void time, when the flow rate was kept
unchanged at a relatively low value. This indicated that when the
first dimension is only running at a relatively low flow rate, the
increase of gradient time is unnecessary for elevating the peak
capacity after a certain point as only limited increase of peak capacity can be achieved with much lengthened analysis time. Although
the first dimension LC still has to be run at low flow rates considering the limited trapping capacity of the trapping column, the
importance of increasing the flow rate as much as possible is illus-
28
M. Sun et al. / J. Chromatogr. A 1541 (2018) 21–30
Fig. 5. Influence of: (a) the gradient time/void time ratio (tg /t0 ) and (b) flow rate on
the first dimension LC peak capacity of lignin phenolic compound standard mixture.
Conditions: mobile phase A: H2 O, B: ACN. (a) Linear gradient from 10 to 70% B at
different speed, flow rate was kept at 0.05 mL/min. (b) Linear gradient from 10 to
70% B with constant tg /t0 of 12, with varied flow rates.
trated in Fig. 5(b). When the ratio between gradient time and void
time was kept constant, peak capacity increases nearly proportionally with the flow rate in the tested range (Fig. 5(b)).
Although higher flow rates can lead to higher first dimension
peak capacity, this impact can be gradually evened out by the
increasing undersampling effect. This is because the first dimension peaks will become narrower with higher flow rates, but the
modulation time has to be long enough to make sure all the compounds transferred in one modulation are eluted before the next
modulation. Taking this and the trapping column retention capacity into consideration, 0.05 mL/min was finally selected as the first
dimension flow rate and the first dimension LC method was then
improved accordingly.
3.4. Second dimension column screening and 2D method
development
Preliminary experiments (data not shown) revealed that phenolic compounds in depolymerised lignin samples showed a wide
variety of retention behavior in SFC analysis due to their structural complexity. In order to achieve complete elution of analytes
in every modulation and taking into consideration the results of the
trapping column test, 0.8 min was chosen as the modulation time.
It has been reported that a large volume (>5 L) water-containing
injection into SFC in an online comprehensive RPLC × SFC system can result in significant accumulative pressure increase at the
beginning of every modulation depending on the water content,
the injection volume and the SFC stationary phase [21]. This was
claimed to be caused by water accumulation before the narrow column inlet. Based on these findings and the internal volume of the
trapping column in this study (∼10 L), different SFC columns with
relatively polar stationary phases and slightly wider internal diameter (3.0 mm i.d.) were screened as compared with the ones used
in the previous study (2.1 mm i.d.) [21].
Fig. 6 shows the screening results of the four columns. The performances of all columns were quite similar, with analyte peaks
distributed over large portions of the separation space. The BEH
column exhibited a slightly lower coverage factor of 0.64, compared with the other three columns (f = 0.70 for DIOL, 0.72 for 2-PIC
and 0.68 for 1-AA). This indicates that for the separation of ligninderived phenolic compounds in a 2DLC system with reversed-phase
LC separation in the first dimension, - and H-bonding interaction in the second dimension SFC can both provide high degrees of
orthogonality. The comparatively lower coverage factor of the BEH
column could be related to the ethylene bridged hybrid particle
which decreases the H-bonding capability of the silica stationary
phase. However, one advantage of the BEH column is that it had
the lowest pressure spike at the beginning of each modulation
(20 bar compared with 30 to 40 bar for the other three columns).
This observation could also be related to the hypothesis of water
layer formation on the stationary phase. As ethylene-bridged silica
is far less acidic than normal silica, the weakened hydrogen bonds
between the stationary phase and H2 O can reduce the thickness
of the water layer. The highly orthogonal separation demonstrated
by the combination of RPLC and SFC indicated that hydrophobic
interaction which determines the elution of the first dimension
RPLC plays a weak role in deciding the compound elution of the
second dimension SFC. The DIOL column was picked for further
experiments as it provided relatively better separation of the early
eluting peaks from the first dimension, medium pressure spike and
Fig. 6. RPLC × SFC second dimension column screening. Sample: 40 lignin phenolic compound standard mixture. Chromatographic conditions can be found in the Experimental
section. See Table S1 for peak identities.
M. Sun et al. / J. Chromatogr. A 1541 (2018) 21–30
29
Fig. 7. 2D separation of a lignin depolymerised sample with the final RPLC × SFC methods with interface using A: two trapping columns; B: two collection loops. Chromatographic conditions can be found in the Experimental section. See Table S1 for peak identities. Due to the software limitation of the home-built instrument, only limited
number of modulations could be programmed and performed for one analysis. Consequently, 2D analysis was only applied with the maximum number of modulation allowed
by the software during the periods of time when most compounds eluted in both A and B, including the same fractions of peaks eluting from the 1st dimension column.
comparatively better second dimension peak shape and less noisy
background.
For the improvement of the 2D separation, different co-solvents,
column temperatures, back pressures and gradients were tested
for the second dimension SFC. Additionally, the second dimension gradient was tuned so that it started already in the previous
modulation, in order to compensate for the comparatively large
gradient delay volume of the system. The final RPLC × SFC method
was then applied for the separation of a lignin depolymerised sample (Fig. 7A).
3.5. Comparison of trapping columns and loops in the RPLC × SFC
system
For the comparison of using trapping columns and collection
loops as interface in the RPLC × SFC system, the developed method
was modified by replacing trapping columns with loops of similar volume (∼10 L). Even though the modulation time was kept
the same, the first dimension LC flow rate had to be significantly
decreased (4 times) considering the amount of eluent transferred
into the second dimension.
The comparison of 2D chromatograms generated from using
collection loops and trapping columns can be visualized in Fig. 7.
In general, the combination of RPLC and SFC shows high degree
of orthogonality. The coverage factor was calculated to be 0.79
and 0.77 for trapping column interface and loop interface respectively. The usage of trapping column in the interface reduced the
total analysis time by 2 times, as compared to interface with loops.
Four compounds could be detected and tentatively identified both
with the trapping column interface and collection loop interface
based on the separation of the mixture of the 40 standards. However, vanillic acid (peak 11) can only be detected with the usage
of trapping columns in the interface. This demonstrated another
advantage of using trapping columns: some analytes of relatively
low concentration can be detected as they are concentrated in the
trapping column before transferred into the second dimension. This
is not possible with traditional loop interfaces. However, the total
conditional peak capacity obtained with trapping column is 277,
which is lower than that with loops (340). This is caused by more
severe undersampling (ˇ = 0.26 for trapping column; ˇ = 0.57 for
loops) when trapping column is used as interface. What is also worthy to be pointed out is that even though no wrap-around peaks
were observed during the 2nd dimension optimization with the
standard mixture, as the variety of compounds in the real depolymerised lignin sample is very wide, a few peaks eluted at the end of
or after the end of one modulation. If these wrap-arounds are to be
eliminated, the gradient has to end with a high percent of co-solvent
or an extra hold-up time at a relatively high percent of co-solvent
has to be added. Either way, the 2nd dimension separation or the
trapping of the compounds would have to be significantly compromised. Therefore, in this study the 2nd dimension gradient was set
in a way that the number of wrap-around peaks were reduced to
minimum and the remaining wrap-around peaks all eluted very
early in the next modulation before the solvent peak without overlapping with the peaks in the following modulation period.
In our previous research we have developed an ultra-high performance supercritical fluid chromatography method (UHPSFC) for
the analysis of lignin-derived phenolic compounds [31]. The same
depolymerised lignin sample in this study was also analysed using
the UHPSFC method (see chromatogram in Fig. S1). In comparison, the RPLC × SFC method developed had a more than three times
higher peak capacity than the UHPSFC method (277 for RPLC × SFC
and 81 for UHPSFC). The disadvantage of the RPLC × SFC method is
the longer analysis time, which was 6 times longer than that of the
UHPSFC method. In order to shorten the 2D analysis time without
a sacrifice of the peak capacity, future work should focus on developing more effective interface sample focusing techniques to allow
higher flow rate to be used in the first dimension and achieve faster
SFC separation to remedy the undersampling issue.
4. Conclusion
A novel comprehensive online two-dimensional RPLC × SFC
method was developed for the analysis of depolymerised lignin
samples with trapping column assisted modulation. A Phenyl-hexyl
trapping column was picked based on a trapping capacity evaluation of 3 different trapping columns. Although the RSD values
were within acceptable ranges, the repeatability of the trapping
column assisted RPLC × SFC system was shown to be undermined
by the limited trapping capacity. Active modulation or a more thorough search for columns specifically designed for the retention of
small phenolic compounds could potentially improve the system.
No demixing effects were observed when injecting large volumes
of water containing samples in SFC when using a high flow rate
and a short column, possibly due to fast travel of intact sample
diluent plug through the column. Water as sample diluent turned
out to enable good peak shapes, even at as large injection volumes
as 10 L. When the first dimension LC flow is kept relatively low
(e.g. ≤0.05 mL/min in this study), an increase in the first dimension flow rate can raise the first dimension peak capacity more
30
M. Sun et al. / J. Chromatogr. A 1541 (2018) 21–30
than an increase in gradient time. RPLC × SFC showed a high degree
of orthogonality for all four SFC columns screened, with coverage factors ranging from 0.64 to 0.72 for the standard mixture of
40 compounds and 0.79 for a real depolymerised lignin sample
with the diol SFC column. A comparison between trapping column assisted modulation and traditional loop based modulation
revealed that the former has the advantage of shorter analysis time
and better detectability due to the analyte concentrating effect.
However, the disadvantage lies in the fact that higher first dimension flow rates led to more severe undersampling.
Acknowledgement
The authors would like to thank the Swedish Research Council Formas (2016-00604) and the Swedish Foundation for Strategic
Research (SSF, RBP 14-0052) for financial support of this work.
We thank Professor Gunnar Lidén for the kind help in revising the
manuscript. We are grateful to Joseph Samec and Maxim Gulkin for
providing the depolymerised lignin samples.
Appendix A. Supplementary data
Supplementary data associated with this article can be found, in
the online version, at doi:10.1016/j.chroma.2018.02.008.
References
[1] P. Gallezot, Conversion of biomass to selected chemical products, Chem. Soc.
Rev. 41 (2012) 1538–1558.
[2] O.Y. Abdelaziz, D.P. Brink, J. Prothmann, K. Ravi, M.Z. Sun, J. Garcia-Hidalgo, M.
Sandahl, C.P. Hulteberg, C. Turner, G. Liden, M.F. Gorwa-Grauslund, Biological
valorization of low molecular weight lignin, Biotechnol. Adv. 34 (2016)
1318–1346.
[3] M.P. Pandey, C.S. Kim, Lignin depolymerization and conversion: a review of
thermochemical methods, Chem. Eng. Technol. 34 (2011) 29–41.
[4] J.S. Lupoi, S. Singh, R. Parthasarathi, B.A. Simmons, R.J. Henry, Recent
innovations in analytical methods for the qualitative and quantitative
assessment of lignin, Renew. Sust. Energ. Rev. 49 (2015) 871–906.
[5] X.P. Ouyang, Z.L. Chen, X.Q. Qiu, Determination of monophenolic compounds
from lignin oxidative degradation using ultra performance liquid
chromatography/high resolution mass spectrometry, Chin. J. Anal. Chem. 42
(2014) 723–728.
[6] T.M. Jarrell, C.L. Marcum, H.M. Sheng, B.C. Owen, C.J. O’Lenick, H. Maraun, J.J.
Bozell, H.I. Kenttamaa, Characterization of organosolv switchgrass lignin by
using high performance liquid chromatography/high resolution tandem mass
spectrometry using hydroxide-doped negative-ion mode electrospray
ionization, Green. Chem. 16 (2014) 2713–2727.
[7] T. Michailof, S. Sfetsas, K. Stefanidis, G. Kalogiannis, A. Theodoridis,
Quantitative and qualitative analysis of hemicellulose, cellulose and lignin
bio-oils by comprehensive two-dimensional gas chromatography with
time-of-flight mass spectrometry, J. Chromatogr. A 1369 (2014) 147–160.
[8] M. Windt, D. Meier, J.H. Marsman, H.J. Heeres, S. de Koning, Micro-pyrolysis of
technical lignins in a new modular rig and product analysis by GC–MS/FID
and GC x GC-TOFMS/FID, J. Anal. Appl. Pyrol. 85 (2009) 38–46.
[9] A. Le Masle, D. Angot, C. Gouin, A. D’Attoma, J. Ponthus, A. Quignard, S.
Heinisch, Development of on-line comprehensive two-dimensional liquid
chromatography method for the separation of biomass compounds, J.
Chromatogr. A 1340 (2014) 90–98.
[10] M. Gilar, P. Olivova, A.E. Daly, J.C. Gebler, Orthogonality of separation in
two-dimensional liquid chromatography, Anal. Chem. 77 (2005) 6426–6434.
[11] I. Francois, K. Sandra, P. Sandra, Comprehensive liquid chromatography:
fundamental aspects and practical considerations-a review, Anal. Chim. Acta.
641 (2009) 14–31.
[12] D.R. Stoll, X.P. Li, X.O. Wang, P.W. Carr, S.E.G. Porter, S.C. Rutan, Fast,
comprehensive two-dimensional liquid chromatography, J. Chromatogr. A
1168 (2007) 3–43.
[13] P. Jandera, Column selectivity for two-dimensional liquid chromatography, J.
Sep. Sci. 29 (2006) 1763–1783.
[14] E. Lesellier, Retention mechanisms in super/subcritical fluid chromatography
on packed columns, J. Chromatogr. A 1216 (2009) 1881–1890.
[15] L. Novakova, A. Grand-Guillaume Perrenoud, I. Francois, C. West, E. Lesellier,
D. Guillarme, Modern analytical supercritical fluid chromatography using
columns packed with sub-2 mu m particles: a tutorial, Anal. Chim. Acta 824
(2014) 18–35.
[16] C. West, E. Lesellier, A unified classification of stationary phases for packed
column supercritical fluid chromatography, J. Chromatogr. A 1191 (2008)
21–39.
[17] I. Francois, P. Sandra, Comprehensive supercritical fluid chromatography x
reversed phase liquid chromatography for the analysis of the fatty acids in
fish oil, J. Chromatogr. A 1216 (2009) 4005–4012.
[18] I. Francois, A.D. Pereira, F. Lynen, P. Sandra, Construction of a new interface for
comprehensive supercritical fluid chromatography x reversed phase liquid
chromatography (SFC x RPLC), J. Sep. Sci. 31 (2008) 3473–3478.
[19] I. Francois, A.D. Pereira, P. Sandra, Considerations on comprehensive and
off-line supercritical fluid chromatography x reversed-phase liquid
chromatography for the analysis of triacylglycerols in fish oil, J. Sep. Sci. 33
(2010) 1504–1512.
[20] C.J. Venkatramani, M. Al-Sayah, G.N. Li, M. Goel, J. Girotti, L.S. Zang, L.
Wigman, P. Yehl, N. Chetwyn, Simultaneous achiral-chiral analysis of
pharmaceutical compounds using two-dimensional reversed phase liquid
chromatography-supercritical fluid chromatography, Talanta 148 (2016)
548–555.
[21] M. Sarrut, A. Corgier, G. Cretier, A. Le Masle, S. Dubant, S. Heinisch, Potential
and limitations of on-line comprehensive reversed phase liquid
chromatography x supercritical fluid chromatography for the separation of
neutral compounds: an approach to separate an aqueous extract of bio-oil, J.
Chromatogr. A 2015 (1402) 124–133.
[22] L.A. Gao, J. Zhang, W.B. Zhang, Y.C. Shan, Z. Liang, L.H. Zhang, Y.S. Huo, Y.K.
Zhang, Integration of normal phase liquid chromatography with supercritical
fluid chromatography for analysis of fruiting bodies of Ganoderma lucidum, J.
Sep. Sci. 33 (2010) 3817–3821.
[23] A.F.G. Gargano, M. Duffin, P. Navarro, P.J. Schoenmakers, Reducing dilution
and analysis time in online comprehensive two-dimensional liquid
chromatography by active modulation, Anal. Chem. 88 (2016) 1785–1793.
[24] M. Verstraeten, M. Pursch, P. Eckerle, J. Luong, G. Desmet, Thermal
modulation for multidimensional liquid chromatography separations using
low-thermal-mass liquid chromatography (LC), Anal. Chem. 83 (2011)
7053–7060.
[25] B.W.J. Pirok, A.F.G. Gargano, P.J. Schoenmakers, Optimizing separations in
online comprehensive two-dimensional liquid chromatography, J. Sep. Sci. 41
(2018) 68–98.
[26] P. Cesla, J. Krenkova, Fraction transfer process in on-line comprehensive
two-dimensional liquid-phase separations, J. Sep. Sci. 40 (2017) 109–123.
[27] D.R. Stoll, X.L. Wang, P.W. Carr, Comparison of the practical resolving power
of one- and two-dimensional high-performance liquid chromatography
analysis of metabolomic samples, Anal. Chem. 80 (2008) 268–278.
[28] M. Sun, G. Liden, M. Sandahl, C. Turner, Ultra-high performance supercritical
fluid chromatography of lignin-derived phenols from alkaline cupric oxide
oxidation, J. Sep. Sci. 39 (2016) 3123–3129.
[29] J. De Vos, S. Eeltink, G. Desmet, Peak refocusing using subsequent retentive
trapping and strong eluent remobilization in liquid chromatography: a
theoretical optimization study, J. Chromatogr. A 1381 (2015) 74–86.
[30] V. Desfontaine, A. Tarafder, J. Hill, J. Fairchild, A. Grand-Guillaume Perrenoud,
J.L. Veuthey, D. Guillarme, A systematic investigation of sample diluents in
modern supercritical fluid chromatography, J. Chromatogr. A 2017 (1511)
122–131.
[31] J. Prothmann, M. Sun, P. Spegel, M. Sandahl, C. Turner,
Ultra-high-performance supercritical fluid chromatography with
quadrupole-time-of-flight mass spectrometry (UHPSFC/QTOF-MS) for
analysis of lignin-derived monomeric compounds in processed lignin
samples, Anal. Bioanal. Chem. 409 (2017) 7049–7061.