Comprehensive comparative compositional study of the vapour phase of cigarette mainstream tobacco smoke and tobacco heating product aerosol
Bạn đang xem bản rút gọn của tài liệu. Xem và tải ngay bản đầy đủ của tài liệu tại đây (1.79 MB, 11 trang )
Journal of Chromatography A, 1581–1582 (2018) 105–115
Contents lists available at ScienceDirect
Journal of Chromatography A
journal homepage: www.elsevier.com/locate/chroma
Comprehensive comparative compositional study of the vapour phase
of cigarette mainstream tobacco smoke and tobacco heating product
aerosolଝ
Benjamin Savareear a , Juan Escobar-Arnanz a , Michał Brokl b , Malcolm J. Saxton b ,
Chris Wright b , Chuan Liu b , Jean-Franc¸ois Focant a,∗
a
b
Centre for Analytical Research and Technologies (CART), University of Liege, Belgium
Research and Development, British American Tobacco, Southampton, UK
a r t i c l e
i n f o
Article history:
Received 20 August 2018
Received in revised form 12 October 2018
Accepted 16 October 2018
Available online 19 October 2018
Keywords:
Mainstream tobacco smoke
Vapour phase
Tobacco heating (heat-not-burn tobacco)
product
Thermal desorption
Comprehensive two-dimensional gas
chromatography
High resolution time-of-flight mass
spectrometry
a b s t r a c t
A simple direct sample collection/dilution and introduction method was developed using quartz wool and
Tenax/sulficarb sorbents for thermal desorption and comprehensive two-dimensional gas chromatography (TD-GC × GC) analyses of volatile organic compounds from vapour phase (VP) fractions of aerosol
produced by tobacco heating products (THP1.0) and 3R4F mainstream tobacco smoke (MTS). Analyses were carried out using flame ionisation detection (FID) for semi-quantification and both low and
high resolution time-of-flight mass spectrometry (LR/HR-TOFMS) for qualitative comparison and peak
assignment. Qualitative analysis was carried out by combining identification data based on linear retention indices (LRIs) with a match window of ±10 index units, mass spectral forward and reverse library
searches (from LR and HRTOFMS spectra) with a match factor threshold of >700 (both forward and
reverse), and accurate mass values of ± 3 ppm for increased confidence in peak identification. Using this
comprehensive approach of data mining, a total of 79 out of 85 compounds and a total of 198 out of 202
compounds were identified in THP1.0 aerosol and in 3R4F MTS, respectively. Among the identified analytes, a set of 35 compounds was found in both VP sample types. Semi-quantitative analyses were carried
out using a chemical class-based external calibration method. Acyclic, alicyclic, aromatic hydrocarbons
and ketones appeared to be prominent in 3R4F MTS VP, whereas larger amounts of aldehydes, ketones,
heterocyclic hydrocarbons and esters were present in THP1.0 aerosol VP. The results demontsrate the
capability and versatility of the method for the characterization and comparison of complex aerosol
samples and highlighted the relative chemical simplicity of THP1.0 aerosol in comparison to MTS.
© 2018 The Authors. Published by Elsevier B.V. This is an open access article under the CC BY-NC-ND
license ( />
1. Introduction
For the purpose of tobacco harm reduction, new generations
of tobacco heating (heat-not-burn - HnB) products (THPs) were
introduced in the market [1,2]. Such new electronically controlled
heating devices significantly impact the global chemical composition of the aerosols, compared to conventional cigarettes. Despite
the large amount of knowledge and standardised methods existing
for the analysis of conventional cigarettes, very little information
ଝ Selected paper from the 42nd International Symposium on Capillary Chromatography and 15th GCxGC Symposium, 13–18th May 2018, Italy.
∗ Corresponding Author at: University of Liège, Chemistry Department – CART,
Organic & Biological Analytical Chemistry, Allée du 6 Août B6c, B-4000, Liège,
Belgium.
E-mail address: (J.-F. Focant).
is currently available for THPs. In addition, some studies have
reported the scientific assessment of THP based on target analyses of compounds typically found in combustible products [1,2]
and only a few methods have been developed for the untargeted
analysis of THP and combustible samples [3,4].
The mainstream tobacco smoke (MTS) that exits the filter of
a cigarette is an extremely complex chemical mixture [5,6]. It
consists of liquid/solid droplets called the particulate phase (PP),
suspended in a mixture of gases and semi-volatiles called the
vapour phase (VP). Apart from the bulk gases (nitrogen, oxygen,
carbon oxides, nitrogen oxides, ammonia), VP also consists of VOCs
and their importance on product cytotoxicity and carcinogenicity
has been demonstrated in several cellular and animal systems [7].
Although it can be expected that THP aerosol is less complex than
MTS, at present the chemical composition of the VP of THP aerosol
has not been fully described [8]. Developing new qualitative and
/>0021-9673/© 2018 The Authors. Published by Elsevier B.V. This is an open access article under the CC BY-NC-ND license ( />0/).
106
B. Savareear et al. / J. Chromatogr. A 1581–1582 (2018) 105–115
quantitative analytical methodologies capable of VP analyses for
both THPs and MTS is therefore important to allow practical comparison.
MTS VP analyses require specific sampling strategies to ensure
representative collection of the whole chemical profile across a
very large dynamic range [5,9]. Various approaches, such as gas
sampling bags [5], solid phase microextraction (SPME) [7], solventfilled impinger trains [10], and cold traps [11] have been reported
for this purpose. Direct sampling of VP on specific adsorbents has
also been reported [12–14]. In the last few years, the use of adsorbents has increased in significance as thermal desorption (TD)
capability has become more widely applicable and robust. Such a
solvent-free technique offers several advantages over other solvent
extraction methods that involve more manual steps and often suffer from reduced sensitivity due to multiple dilution steps before
final measurement [15,16]. Amongst other applications [17,18] TD
has recently been successfully used for the analysis of MTS VP of
different cigarette types [5].
two-dimensional
gas
chromatography
Comprehensive
(GC × GC) coupled to time-of-flight mass spectrometry (TOFMS) is
the established method of choice for detailed analysis of VOCs in
medium-to-high complexity samples [17–19]. Advantages of the
state-of-art GC × GC-TOFMS instrumentation have been described
in several reports [17,20,21]. In the context of identification of
unknowns, an important advantage of GC × GC is the spatial
coordination of chemical classes in 2D chromatograms that provides a further identification point in addition to linear retention
indices (LRIs), fragment ion and accurate mass MS data during
the peak assignment process. In order to perform qualitative and
semi-quantitative untargeted analyses, the simultaneous use of
a flame ionisation detector (FID) and a TOFMS (dual detection)
has been reported [21,22]. Despite the potential benefits of this
approach in terms of speed and efficiency, relatively few reported
applications involve such dual detection GC × GC instrumentation
[23–28]. As GC × GC can now be more easily coupled to fast
acquisition HRTOFMS, which offers mass accuracy at the sub-ppm
level consistently on deconvoluted mass spectral signals, an
extra dimension of elemental composition is made available for
compound identification [29]. The utility of GC × GC-HRTOFMS
is however constrained by the size of the acquired data files and
associated data processing requirements [30,31]. Nevertheless, a
GC × GC-HRTOFMS approach was successfully used for collecting
accurate mass values ( ± 15 ppm) for increased confidence in peak
identification of different hop essential oils [32].
In this study, we developed an original analytical method for
the qualitative and semi-quantitative comparison of VOC constituents in the VP fraction of THP aerosol and combustible MTS. For
this purpose, TD-GC × GC-TOFMS/FID and TD-GC × GC-HRTOFMS
were used to maximize the identification confidence for the nontargeted screening approach.
2. Materials and methods
2.1. Analytical reagents and supplies
Saturated alkane standard solutions (C5 –C30 ) were purchased
from Sigma Aldrich (Diegem, Belgium). A custom standard mix
made of benzene, toluene, 2-hexanone, p-xylene, styrene, bromobenzene and o-cresol, was prepared at concentrations of 0.25
and 0.5 g/L for the optimization of the split ratio between FID
and TOFMS and the tuning of the recollection process. A custom
standard mix (Supplementary Table S1) was prepared for building the calibration curves for semi-quantification purposes. All
standards were purchased from Sigma-Aldrich (Diegem, Belgium),
purity was >99.5%. All solutions were prepared volumetrically
using methanol (Sigma-Aldrich) and stored at 4 ◦ C. Quartz wool
and Tenax/sulficarb stainless steel TD tubes were purchased from
Markes (Pontyclun, UK).
2.2. Blank analysis procedure
Blank analysis were performed to ensure analytical systems
were free from contaminations and that possible interferences
were under control. All TD tubes were conditioned prior their use
according to manufacturer’s instructions. A blank test was always
performed before use for each TD tube to check for possible carryover. The smoking machines were located in separate rooms to
avoid any interferences on the VOC profiles. Prior to sampling, air
blank analyses were conducted on each smoking machine. For this a
blank TD tube was placed in the smoking machine and the smoking
procedure was run without tobacco consumables. For each recollection process, a blank run was always performed using blank
TD tubes in the Unity-2 and recollection unit to check that the
instrument was free of contamination. After this a chromatographic
run sequence was made as follows: instrumental blank, smoking
machine air blank, recollection procedure blank, and an instrumental blank prior analyses of unknown samples. This procedure was
repeated for each sample and replicate analyses.
2.3. Sampling procedure
2.3.1. Samples and sample collection
TM
The THP1.0 (glo ) device and consumables were provided
by British American Tobacco (Southampton, UK). The description
of THP1.0 device and sampling procedure details are illustrated
in Fig. S1 (Supplementary Information). 3R4F research reference
cigarettes were acquired from the University of Kentucky College
of Agriculture (Kentucky Tobacco Research & Development Center,
USA). THP consumables and reference cigarettes were conditioned
in separate humidifier for at least 48 h at 60% relative air humidity and 22 ◦ C [25]. For THP1.0 samples, VP aerosol samples were
generated using a linear syringe drive system A14 (Borgwaldt KC
GmbH, Germany). As no standard puffing regime has been defined
for THP so far, all sample collections were conducted according to
modified Health Canada Intense (HCI) puffing regime for cigarettes
that consisted of bell-shaped puffs, each of 55 mL with puff duration of 2 s and with 30 s intervals between puffs [33] with air inlet
zone not occluded. The number of puffs corresponds to the heating
cycle available for THP1.0 used in the present study (8 puffs). One
THP consumable was used for each analysis. For the 3R4F reference
cigarette, MTS VP fraction was generated using a Borgwaldt RM20D
smoking machine (Borgwaldt KC GmbH, Germany). Smoking was
conducted according to the relevant ISO standards applying a 35 mL
puff of 2 s duration taken every 60 s with no blocking of filter ventilation holes [34]. One reference cigarette was used for each analysis.
Sampling procedure details are illustrated in supplementary Fig. S1.
Routine airflow and puff volume measurements were performed
prior to the smoke runs for each smoking machines. For TD sampling, two prepacked tubes (1st level) were connected in series,
quartz wool TD tubes for trapping the total particulate phase (PP)
fraction and Tenax/sulficarb TD tubes for trapping the VOC component of the vapour phase (VP) fraction. TD tubes were placed in
between the consumable and the corresponding syringe pump of
the smoking machines. The total volume of gas drawn through the
sorbents for THP sampling was 440 mL for each analysis. The total
volume of gas drawn through the sorbents for reference cigarette
sampling was 280 mL for each analysis. TD tubes were capped with
®
DiffLok caps (Markes Ltd) directly after the sampling procedure
was completed to preserve the integrity of samples.
B. Savareear et al. / J. Chromatogr. A 1581–1582 (2018) 105–115
2.3.2. VP fraction recollection/dilution process
The VP fraction of aerosol/smoke trapped on a TD tube was
split across three 2nd level TD tubes filled with the same sorbent
prior to the chromatographic injections to avoid overloading of
chromatograms and contamination of the TD unit and GC column.
For this purpose, a Recollect-10 device (SepSolve Analytical Ltd
(Peterborough, UK) connected to Unity-2 TD unit through a heated
transferline was used. This instrument is capable of recollecting
gaseous samples across up to ten TD tubes at a time. The dilution procedure details are illustrated in supplementary Fig. S2. 1st
level TD tubes were placed in the Unity-2 thermal desorber for two
stages of desorption process. The pre-desorption stage consisted
of 2 min of pre-purge of the sample tube at ambient temperature
with a flow rate of 50 mL min−1 . During the tube desorption stage,
the sample tube was desorbed at 320 ◦ C for 10 min with a flow
rate of 60 mL min−1 and the flow equally split across three tubes
placed in the manifold. The manifold, transferline and flow path
temperature were maintained at 200 ◦ C. TD tubes were capped with
®
DiffLok caps (Markes Ltd) directly after the recollection procedure
was completed and analysed immediately after using TD-GC × GCTOFMS/FID and TD-GC × GC-HRTOFMS instruments.
2.4. Instrumental analysis
TD-GC × GC-TOFMS/FID analyses were performed using a LECO
Pegasus 4D (LECO Corp., St. Joseph, MI, USA) GC × GC system
equipped with a quad jet LN2 Cooled Thermal Modulator, a
secondary GC oven, an Agilent Technologies (Santa Clara, CA,
USA) capillary flow technology splitter, a thermal desorption unit
(TD-100xr, Markes Ltd.), a LECO Pegasus time-of-flight mass spectrometer (TOFMS) and an Agilent Flame ionization detector (FID).
TD-GC × GC-HRTOFMS analyses were performed using a LECO
Pegasus GC-HRT 4D (LECO Corp.) system equipped with a quad jet
LN2 Cooled Thermal Modulator, a secondary GC oven, a thermal
desorption unit (TD-100xr, Markes Ltd.) and a LECO Pegasus high
resolution time-of-flight mass spectrometer (TOFMS). A schematic
overview of the TD-GC × GC-TOFMS/FID dual detection set-up and
the TD-GC × GC-HRTOFMS set-up is given in supplementary information, Fig. S3.
2.4.1. Thermal desorption procedure
Sample TD tubes underwent three stages of desorption process.
The pre-desorption stage consisted of 0.1 min of pre-purge of the
sample tube at ambient temperature with a flow rate of 50 mL
min−1 . During the tube desorption stage, the sample tube was desorbed at 300 ◦ C for 8 min with a flow rate of 50 mL min−1 . Samples
were recollected on a cold trap containing proprietary sorbent from
Markes (‘sulphur/labile’ carbon number C3 -C30 ) at a temperature of
25 ◦ C. The cold trap plus sample was purged for 2 min at a flow rate
of 50 mL min−1 to remove possible traces of undesirable water by
diverting them to the vent port prior to sample desorption into the
GC × GC instrument. The cold trap was desorbed at the maximum
heating rate of 24 ◦ C sec−1 from 25 ◦ C to 315 ◦ C, at which it was
held subsequently for another 6 min A transfer line of 1.5 m deactivated fused silica column was connected between the TD-100xr
and the GC column inlet and maintained at 200 ◦ C. The split ratio
for GC × GC-TOFMS/FID analysis was set to 1:50 and for GC × GCHRTOFMS analysis was set to 1:100.
2.4.2. GC × GC-TOFMS/FID analyses
For all analyses a non-polar, 5% diphenyl 95% dimethyl
polysiloxane phase (60 m × 0.25 mm i.d. × 0.5 m df) (Rtx-5SilMS,
Restek Corp., Bellefonte, PA, USA) was used as the first dimension
(1 D) column. Two 30 m columns were connected to make a 60 m
®
column. The second dimension (2 D) was a midpolar Crossbond
silarylene phase column exhibiting similar selectivity to 50%
107
phenyl/50% dimethyl polysiloxane (1 m × 0.25 mm i.d. ì 0.25 m
đ
df) (Rxi -17SilMS, Restek Corp.). All column connections, including the transfer line of TD to the 1 D column and two 30 m 1 D
columns and 2 D column were made using SilTiteTM -Unions (SGE
International, Victoria, Australia). The effluent of the 2 D column
was directed to an Agilent three-way capillary flow splitter and
the effluent was split via restrictors R1 and R2 to the TOFMS and
FID. A constant split pressure of 3.8 PSI was used for calculating
the 1:1 split between the TOFMS/FID setup, corresponding restrictors (deactivated fused silica) were R1 : 2.78 m × 0.15 mm i.d. and
R2 :0.53 m × 0.15 mm i.d. The carrier gas was helium at a corrected
constant flow rate of 1.2 mL min−1 . The main oven temperature
program started with an isothermal period at 40 ◦ C for 5 min, then
a ramp of 5 ◦ C min−1 up to 300 ◦ C, a final isothermal period at 300 ◦ C
for 3 min. The secondary oven was programmed with a 5 ◦ C offset
above the primary oven temperature. The modulation parameters
consisted of a 3 s modulation period (PM ) (0.7 s hot pulse and 0.8 s
cold pulse time) and a temperature offset of 15 ◦ C above the secondary oven temperature. The FID temperature was 350 ◦ C, using
an air flow of 400 mL min−1 , hydrogen flow of 40 mL min−1 and
a N2 make up gas flow of 30 mL min−1 . The TOFMS was operated in electron impact mode using 70 eV, detector voltage was
at 1800 V, ion source temperature was set at 230 ◦ C, transfer line
temperature was set at 250 ◦ C and mass scan range m/z 35–500 at
the acquisition rate of 100 spectra s−1 . Daily mass calibration and
auto tuning were performed using perfluorotributylamine (PFTBA).
®
Samples were acquired using ChromaTOF (LECO Corp.) software
version 4.50.8.
2.4.3. GC × GC-HRTOFMS analyses
1 D and 2 D columns were similar to TD-GC × GC-TOFMS/FID
setup except the 2 D column was 1.5 m long in the TD-GC × GCHRTOFMS setup. Since there was no splitter configuration in this
instrument, the 2 D column effluent was directed to the mass spectrometer. The main oven temperature program started with an
isothermal period at 40 ◦ C for 5 min, then a ramp of 2.2 ◦ C min−1 up
to 130 ◦ C, followed by a ramp of 2.8 ◦ C min−1 to 300 ◦ C and a final
isothermal period at 300 ◦ C for 3 min. Mass spectra were acquired
in the range m/z 35–500 at the acquisition rate of 100 spectra s−1 ,
in a high resolution mode with a resolving power >25,000 FWHM
®
for m/z 218.9851. Samples were acquired using LECO ChromaTOF HRT (LECO Corp.) software version 1.91. All other parameters were
the same as for GC × GC-TOFMS/FID analyses.
2.5. Data processing
The scheme of data production and processing is illustrated in
supplementary information, Fig. S4. TOFMS/FID data were exported
as. peg and. csv files for both TOFMS and FID, respectively. These
data were separately processed and summarised (retention times,
peak areas, library comparison etc.) using the pixel-based GC
ImageTM (ZOEX Corp., Houston, TX, USA) software package version R2.5. For the analysis of VP and the comparison of samples,
chromatograms were aligned following a procedure based on the
creation of a template chromatogram that records peak patterns
and carrying out resampling of the data to match retention times
TM
TM
using GC Project , part of the GC Image software package (Supplementary Fig. S5). The following blob detection criteria were
used: area 22, volume 300,000 and SN > 200 were applied on each
individual chromatogram for TOFMS and FID, based on a compromise between the number of detected signals and the quality of the
recorded signals, the later depending strongly on peak shapes over
the large dynamic range. For HRTOFMS data, peaks were matched
using mass spectral and GC × GC structured chromatogram pattern
(1 tR and 2 tR ) information (Supplementary Information, Fig. S6).
108
B. Savareear et al. / J. Chromatogr. A 1581–1582 (2018) 105–115
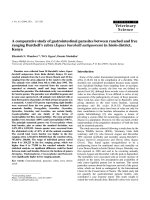
Fig. 1. Repeatability of the recollection process based on average peak area obtained from direct TD injection (Black), recollection over one TD tube (Grey), and three tubes
(White) (For interpretation of the references to colour in this figure legend, the reader is referred to the web version of this article).
Qualitative analysis was carried out using linear retention
indices C5 -C25 (LRI window ±10) and mass spectral similarity/reverse match (similarity/reverse > 700 MS spectra match)
against library spectra from LRTOFMS and HRTOFMS instruments.
In addition, an accurate mass value of < ± 3 ppm was applied to
give increased confidence for tentatively identified peaks as such
mass accuracy values allowed to univocally attribute a molecular formula to most compounds of molecular weights below
200 Da [35]. Library searches of blobs/compounds (both TOFMS
and HRTOFMS) were performed using NIST/EPA/NIH Mass Spectral Library (NIST 14) and Wiley Registry of Mass Spectral Data (9th
edition) with a match factor threshold of >700. Further analyses of
GC × GC–TOFMS/FID results using interactive LRI filters (±10 range)
were performed using NIST/EPA/NIH Mass Spectral Library (NIST
14) database. If not available in the NIST14 database, WEB based RI
collections (PubChem) information was used [36].
3. Results and discussion
3.1. Method development
3.1.1. Thermal desorption sampling
Based on a previous study [5] thermal desorption (TD) was
used as a unique approach to accommodate the chemical complexity and the large dynamic range covered by components of
MTS and THP samples. Despite the fact that sample production
from THP and combustible products requires different apparatus,
whole smoke/aerosol TD sampling was carried out by placing a set
of TD tubes in the output stream (Supplementary Fig. S1). At first,
a single TD tube (Tenax/sulficarb) was used but breakthrough was
observed (data not shown), even on a single puff basis. Based on
recent research [5], we included glass fiber filter pads (Cambridge
filter pads, CFP) which resolved the breakthrough issue (Supplementary Information, Fig. S7). To simplify the process the CFP was
replaced by a TD tube containing quartz wool, creating a sample
train that comprised a first level tube (Tube 1) containing quartz
wool for particulate phase (PP) trapping and another first level tube
(Tube 2) containing Tenax/sulficarb for VP trapping. The impact on
back pressure and airflow of two TD tubes between the product
and the puffing machine was minimized (<10 mL/min) by limiting
the quantity of packed quartz wool to 700 mg/tube. The efficiency
of sampling was evaluated by monitoring potential breakthrough
of compounds using a third tube placed after the Tube 2. Under the
above set up there was no breakthorugh for both THP1.0 V P and
3R4F MTS VP samples, which is a significant factor to consider for
comparison of the samples (Supplementary Information, Fig.S8).
The emissions from a whole consumable were collected in
order to manage known variations between individual puffs. This
resulted in highly concentrated samples that required dilution
before TD-GC × GC-TOFMS/FID analysis to prevent overloading
of instruments and carry-over between samples. The recollection/dilution procedure (Supplementary Information, Fig. S2) was
also optimized to prevent breakthrough on the recollection tubes
and to allow quantitative dilution of the samples. As illustrated in
Fig. 1 for a set of representative compounds, acceptable losses were
observed when a TD tube containing a sample was recollected onto
one or three TD tubes. The average loss based on peak areas was
9% and ranged between 4% (Benzene) and 19% (2-Hexanone), with
RSDs ranging between 4% (Toluene) and 13% (o-Cresol).
The potential impact on sample integrity of the storage of
TD tubes prior to analysis was evaluated by monitoring peak
areas of a set of selected analytes (2-Methylbutane, 2-Butanone,
Benzene, Dimethylfurane, 2-Hexanone, Pyridine, Ethylbenzene,
Styrene, Limonene) over time. Peak areas did not significantly
vary (<20%) over a period of five days. Nevertheless, samples were
always analysed within 48 h of collection on TD tubes. Tube desorption conditions were optimized to ensure the complete transfer
of all analytes from the TD tube to the 1 D GC column. This was systematically controlled by monitoring blank levels of TD tubes and
of the thermal desorber cold trap.
3.1.2. Chromatography
The TD-GC × GC-TOFMS/FID instrumental set-up (Supplementary information, Fig. S3) was optimized by using a constant split
pressure approach. The desired split ratio (1:1) was maintained
during the whole temperature program by calculating column
flows of both restrictors. The split ratio was validated by replicate
(n = 6) sequential analysis of a test mixture by single (FID) and dual
detection (FID and TOFMS). Ratio of average peak areas of the single and dual detection analysis demonstrated the efficient 1:1 split
ratio (Supplementary information, Fig. S9) with excellent repro-
B. Savareear et al. / J. Chromatogr. A 1581–1582 (2018) 105–115
109
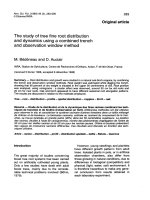
Fig. 2. Apex plot of vapour phase sample from 3R4F MTS and THP1.0 aerosol obtained from FID (top), LRTOFMS (middle) and HRTOFMS (bottom).
duciblity (average ratio of 0,496 ± 0,03; RSD values from 4,1% to
8,7%).
The chromatograms (three individual chromatograms from
three second level TD tubes) were processed for both FID and
LRTOFMS separately (Supplementary Information, Fig. S5). After
manually cleaning the images from column bleed, artifact peaks
and mutliple hits due to peak tailing effects for highly abundant
compounds, they were manually matched on a compound-bycompound basis using first and second dimension retention time
(1 tR and 2 tR ) matching. Under this approach, the total numbers of
peaks found to be present in the VP fraction of THP1.0 and MTS
were 88 and 207, respectively. Fig. 2 shows the reconstructed chromatograms (apex plots) obtained for TD-GC × GC-TOFMS/FID and
used for data processing.
In order to also combine high accuracy MS data to compound
identification, the TD- GC × GC-TOFMS/FID method was transposed
to TD-GC × GC-HRTOFMS. Although it might be considered a trivial step, the transposition of chromatographic methods between
vacuum outlet instruments from one that includes splitting of the
flow to another that uses a significantly longer transfer line (Supplementary Information, Fig. S3) was not straightforward. Despite
all efforts (variations of flows, column dimensions and coating, and
other GC × GC operational conditions) it appeared to be impossi-
ble to obtain chromatograms that align retention times between
LRTOFMS and HRTOFMS.
The TD-GC × GC-HRTOFMS apex plots shown in Fig. 2 for THP1.0
and 3R4F MTS represent the best compromise that could be
obtained in terms of run time and chromatographic resolution.
Each of the HRTOFMS signals was matched with the corresponding
FID/LRTOFMS signal. This required significant manual intervention to locate the corresponding peak based on first dimension
linear retention index, position of the peak in the second dimension retention plane and mass spectral data for each compound.
Despite the technical challenges explained above, the FID, LRTOFMS
and HRTOFMS signals of 88 and 207 compounds were matched for
THP1.0 and 3R4F MTS, respectively.
The developed analytical method was capable of analysing
molecules in the range of C4 -C25 . However, a limited number
of unresolved (Supplementary Information, Fig. S10) compounds
eluting before the C5 region were not considered further because of
the lack of linear retention index information and a lack of fragment
ions below m/z 35 giving inaccurate peak assignment against library
match. A dedicated analytical methodology coupled to the use of
standards would be required to consider analytes below the C5
region but was out of the scope of the present study. When considering the region above C5 , 85 and 202 compounds were selected for
110
Table 1
Qualitative and semi-quantitative results of vapour phase fraction of THP1.0 aerosol.
FID
HRTOFMS
LRTOFMS
Compound name
Chemical
formula
LRI
LRIlib.
Amount
(g/stick)
a
Mean ± SD
MS forward
match
MS
reverse
match
MS forward
match
MS
reverse
match
Mass
accuracy
(ppm)
Chemical
class
1
2
3
4
5
6
7
8
9
10
11
12
13
14
15
16
17
18
19
20
21
22
23
24
25
26
27
28
29
30
31
32
33
34
35
36
37
38
39
40
41
42
43
44
45
2-Propanone*
Acetic acid, methyl ester
Carbon disulfide
Propanal, 2-methyl-*
2-Propenal, 2-methyl-*
2,3-Butanedione*
2-Butanone* $
Furan, 2-methyl-*
Furan, 3-methyl-*
Unknown
Propanoic acid, methyl ester
1,3-Pentadiene, 3-methyl-, (E)-*
Butanal, 3-methyl-*
Butanal, 2-methyl1-Penten-3-one
2,3-Pentanedione*
Furan, 2,5-dimethyl-*
2-Butanone, 3-hydroxyThiocyanic acid, methyl ester*
2,4-Dimethylfuran*
2-Vinylfuran*
Propanoic acid, 2-oxo-, methyl ester
1-Butanol, 3-methylpyrazine
2-Pentanone, 4-methyl-*
1H-Pyrrole, 1-methyl-*
Unknown
Pyridine* $
Disulfide, dimethyl*
1H-Pyrrole
2-Pentenal, (E)1,4-Dioxin, 2,3-dihydroToluene* $
Thiophene, 3-methyl-*
3-Hexanone
2-Hexanone*$
Cyclopentanone*
Hexanal
2,4-Pentanedione
3(2 H)-Furanone, dihydro-2-methylFuran, 2-ethyl-5-methyl-*
1H-Pyrrole, 1-ethyl-*
2,5-Furandione
2-Vinyl-5-methylfuran*
2-Furancarboxaldehyde
C3 H6 O
C3 H6 O2
CS2
C4 H8 O
C4 H6 O
C4 H6 O2
C4 H8 O
C5 H6 O
C5 H6 O
–
C4 H8 O2
C6 H10
C5 H10 O
C5 H10 O
C5 H8 O
C5 H8 O2
C6 H8 O
C4 H8 O2
C2 H3 NS
C6 H8 O
C6 H6 O
C4 H6 O3
C5 H12 O
C4 H4 N2
C6 H12 O
C5 H7 N
–
C5 H5 N
C2 H6 S2
C4 H5 N
C5 H8 O
C4 H6 O2
C7 H8
C5 H6 S
C6 H12 O
C6 H12 O
C5 H8 O
C6 H12 O
C6 H12 O
C5 H8 O2
C7 H10 O
C6 H9 N
C5 H6 O2
C7 H8 O
C5 H4 O2
519
545
555
565
573
588
595
600
609
618
626
638
652
662
685
694
706
706
713
715
725
727
734
735
739
741
743
746
748
752
757
767
771
776
785
790
794
800
804
808
810
816
831
832
835
509
536
549
561
567
595
598
606
614
–
627
643
652
662
681
698
707
706
711
711
725
722
736
736
735
743
–
746
746
755
754
680#
770
776
784
790
791
800
795
809
802
821
830
826
833
13.3 ± 0.15
3.9 ± 0.28
0.3 ± 0.04
8.4 ± 0.13
5.4 ± 0.24
15.7 ± 0.21
1.2 ± 0.08
3.1 ± 0.09
0.7 ± 0.02
0.1 ± 0.00
0.3 ± 0.03
0.6 ± 0.05
7.4 ± 0.02
5.9 ± 0.24
0.3 ± 0.03
5.2 ± 0.09
trace
1.2 ± 0.14
1.6 ± 0.25
0.2 ± 0.01
0.3 ± 0.01
0.6 ± 0.06
0.1 ± 0.01
0.2 ± 0.01
0.1 ± 0.00
1.0 ± 0.01
trace
1.8 ± 0.25
2.1 ± 0.04
2.3 ± 0.31
1.8 ± 0.06
0.2 ± 0.01
0.4 ± 0.02
0.2 ± 0.01
0.3 ± 0.02
0.1 ± 0.01
0.1 ± 0.01
0.9 ± 0.14
0.1 ± 0.00
1.5 ± 0.17
0.2 ± 0.01
0.2 ± 0.01
0.6 ± 0.09
0.5 ± 0.06
15.7 ± 0.23
964
952
899
967
962
885
966
929
762
–
856
865
952
953
899
945
941
885
907
838
886
927
826
958
726
948
–
959
960
926
900
748
917
708
935
783
971
905
880
947
773
892
726
909
957
964
960
944
967
962
891
966
934
785
–
856
878
952
953
899
948
962
892
907
856
893
959
879
958
766
948
–
963
961
949
900
757
927
814
935
805
971
905
915
947
783
892
906
959
957
886
963
960
933
940
963
832
960
799
–
849
744
942
944
720
953
959
973
959
952
928
958
903
967
–
936
–
969
967
948
875
806
949
801
950
903
935
810
757
954
777
906
737
883
950
899
963
989
933
940
974
929
960
884
–
897
864
942
947
764
958
959
980
967
952
930
958
911
967
–
940
–
969
967
954
875
815
958
818
952
903
945
837
768
954
789
906
879
924
950
1.4
−1.1
−1.5
−1.0
−0.4
−1.4
−1.0
−1.0
−0.7
–
−0.3
−0.3
−0.4
−0.6
0.0
−0.5
−0.4
−0.2
−0.7
−0.8
−0.1
−0.1
1.5ˆ
−0.3
1.2
0.3
–
−0.8
−2.5
−1.4
−0.6
−0.6
−0.2
−0.4
−0.2
1.0
0.2
2.4ˆ
−0.3
−0.4
−0.8
−0.1
1.2ˆ
−0.5
−1.8
8
9
11
7
7
8
8
3
3
13
9
1
7
7
8
8
3
8
9
3
3
9
6
3
8
3
13
3
11
3
7
12
4
3
8
8
8
7
8
9
3
3
9
3
7
B. Savareear et al. / J. Chromatogr. A 1581–1582 (2018) 105–115
Peak No.
Vinyl crotonate
1,3-Cyclopentadiene, 5-(1,1dimethylethyl)2,5-Diethylfuran
2-Hexenal, (E)p-Xylene*$
1H-Pyrrole, 2,5-dimethyl2(3 H)-Furanone, 5-methylo-Xylene*
Bicyclo[3.1.0]hexan-2-one
Styrene* $
Heptanal
2-Methyl-5-isopropenylfuran
6,8-Dioxabicyclo[3.2.1]octane
Oxepine, 2,7-dimethyl1H-Pyrrole, 1-butyl2-Heptanone, 6-methylBenzaldehyde*
Dimethyl trisulfide*
beta-Myrcene
Furan, 2-pentylUnknown
Octanal
Unknown
delta-3-Carene*
o-Cymene*
Benzene, 1,2,3-trimethylBenzylamine
Limonene*
Cyclohexanone, 2,2,6-trimethyltrans-beta-Ocimene*
Benzeneacetaldehyde
4-tert-Butyltoluene
Unknown
Nonanal
1-Methoxyadamantane
Decanal
Unknown
Trimethyl-tetrahydronaphthalene
Triacetin
Naphthalene, 1,3-dimethyl-*
C6 H8 O2
C9 H14
C8 H12 O
C6 H10 O
C8 H10
C6 H9 N
C5 H6 O2
C8 H10
C6 H8 O
C8 H8
C7 H14 O
C8 H10 O
C6 H10 O2
C8 H10 O
C8 H13 N
C8 H16 O
C7 H6 O
C2 H6 S3
C10 H16
C9 H14 O
–
C8 H16 O
–
C10 H16
C10 H14
C9 H12
C7 H9 N
C10 H16
C9 H16 O
C10 H16
C8 H8 O
C11 H16
–
C9 H18 O
C11 H18 O
C10 H20 O
–
C13 H18
C9 H14 O6
C12 H12
836
849
855
857
869
870
873
877
897
900
904
938
939
949
953
957
978
986
989
992
997
1008
1012
1017
1035
1035
1036
1039
1048
1052
1061
1067
1079
1113
1198
1216
1247
1279
1343
1385
783#
839
888#
854
865
867
873
881
793#
893
901
933
839#
944
975#
953
971
984
991
993
–
1003
–
1011
1026
1033
1035
1030
1047
1049
1060
1066
–
1109
1179#
1214
–
1250#
1344
1385
0.3 ± 0.04
1.0 ± 0.01
0.1 ± 0.01
trace
trace
0.2 ± 0.02
0.6 ± 0.04
0.3 ± 0.00
0.1 ± 0.01
0.1 ± 0.01
0.1 ± 0.01
0.2 ± 0.00
0.2 ± 0.02
0.2 ± 0.00
0.1 ± 0.00
0.1 ± 0.00
0.1 ± 0.10
0.4 ± 0.03
0.4 ± 0.01
0.2 ± 0.01
trace
trace
trace
0.9 ± 0.05
trace
0.1 ± 0.00
trace
1.0 ± 0.01
0.1 ± 0.01
0.4 ± 0.06
1.6 ± 0.29
0.1 ± 0.01
trace
0.1 ± 0.01
0.1 ± 0.00
0.1 ± 0.00
trace
0.9 ± 0.02
0.1 ± 0.00
0.7 ± 0.01
755
777
854
864
758
772
907
936
763
797
730
854
834
786
855
753
936
941
929
924
–
831
–
850
874
776
753
860
759
812
808
802
–
766
786
–
–
906
785
–
815
845
854
969
889
828
933
947
778
911
782
854
850
786
867
832
936
941
965
924
–
851
–
891
952
871
829
885
848
891
929
816
–
779
796
–
–
940
902
–
765
863
777
918
880
864
931
953
831
889
892
847
796
782
812
931
898
919
873
909
–
894
–
847
950
923
855
880
815
–
952
–
–
888
766
844
–
832
915
899
850
864
856
923
880
867
935
953
835
919
911
921
796
782
849
933
919
924
877
912
–
905
–
851
950
923
855
880
905
–
956
–
–
888
786
875
–
845
915
899
0.1
−0.5
−0.0
0.2
0.3
−0.0
−0.1
−0.4
0.1
−0.4
−0.5ˆ
−0.8
−0.2
−0.6
−0.7
1.1ˆ
−0.3
−0.2
0.7ˆ
−0.4
–
0.8ˆ
–
−0.5
0.0
−0.0
−0.5
−0.2
0.1
2.6
−0.7
0.9
–
1.4ˆ
1.3
0.4ˆ
–
1.0
−1.0ˆ
−1.0
9
2
3
7
4
3
9
4
8
4
7
3
12
3
3
8
7
11
1
3
13
7
13
2
4
4
4
2
8
1
7
4
13
7
12
7
13
5
9
5
B. Savareear et al. / J. Chromatogr. A 1581–1582 (2018) 105–115
46
47
48
49
50
51
52
53
54
55
56
57
58
59
60
61
62
63
64
65
66
67
68
69
70
71
72
73
74
75
76
77
78
79
80
81
82
83
84
85
a
sample mean (n = 4) along with standard deviation of the measurements, * compounds found in reference cigarette smoke VP sample, compounds found in Hoffmann list, $ compounds were positively identified using their
respective standard, - information not available, trace- concentration below 0.1 g/stick, # estimated non-polar retention index from NIST database, but semi-standard column retention index information not available from
ˆ
peak or characteristics peak mass accuracy values due to the absence or weak molecular ion, chemical classes labelled herein numerical defined in Tables 2 or S1.
searched libraries database, base
111
112
B. Savareear et al. / J. Chromatogr. A 1581–1582 (2018) 105–115
qualitative and quantitative investigation in THP1.0 V P and 3R4F
MTS VP, respectively.
3.2. Comparisons of VP aerosol fraction from THP1.0 and 3R4F
MTS
3.2.1. Qualitative aspects using low and high resolution TOFMS
Qualitative analysis of the VP fraction of THP1.0 aerosol and MTS
was carried out using several identification criteria such as retention times (1 tR and 2 tR ) of available authentic reference standards,
1 t linear retention index matches (±10 window), and mass specR
tral forward and reverse similarity matches (>700) against spectral
libraries for both TOFMS and HRTOFMS data. In addition, accurate
mass information within ± 3 ppm window based on either parent ions or abundant fragments (limited cases) was employed to
improve the confidence of identification of compounds. As seen in
Tables 1 and S2, in some limited cases, either LRI data were not
available or the MS match factor was not obtained from either the
low or high resolution mass analyser because of interfering ions,
but peak assignment was always backed up by at least good MS
match (>700) on the other MS analyser and good mass accuracy
(< ± 3 ppm) values. In addition, the spatial coordination of homologous series of compounds in GC × GC chromatograms aided further
confirmation of identities.
As expected, reverse library matches (ranged 757–971 and
764–989 for LRTOFMS and HRTOFMS, respectively) were slightly
better than forward matches (ranged 708–971 and 720–973 for
LRTOFMS and HRTOFMS, respectively) and HRTOFMS matches
were globally better than LRTOFMS matches, even though MS
libraries are made of LRMS data sets. This can be explained partly
by the higher mass resolution of the HRTOFMS instrument, which
provides narrower mass windows and reduces the impact of interfering ions from co-eluting species and background noise [37].
Because of the operation of the HRTOFMS in electron impact
mode (70 eV) to provide the desired fragmentation for MS library
search purpose, for some compounds the abundance of the molecular ion was very low. This was particularly the case for alkanes,
aldehydes, alcohols and nitriles, for which the most abundant
fragment ion was used to estimate mass accuracy, as reported
earlier [32]. The use of a softer ionisation technique such as UVbased photo-ionisation (PI) is currently under investigation in other
projects and may improve MS data quality for fragment ions and
molecular ions [38]. In practice, 82% and 94% of the identified analytes presented a usable molecular ion for identification for THP1.0
and 3R4F MTS, respectively. Among these, 70% of the assigned peaks
exhibited a mass accuracy of ± 1 ppm, for both sample types while
15% and 25% of assigned peaks exhibited a mass accuracy between
±1 and ± 3 ppm for THP1.0 and 3R4F MTS, respectively. Despite the
high added value of accurate mass to MS library comparisons for
identification of compounds [39], the unequivocal identification of
compounds present in different isomeric forms still requires the
use of LRIs and ideally the analysis of pure standard compounds,
which is difficult to implement in non-targeted studies. By applying
the comprehensive data mining strategies described previously 79
(out of the 85) (Table 1) and 198 (out of the 202) compounds were
identified in the THP1.0 aerosol VP and 3R4F MTS VP (Supplementary Table S2), respectively. The remaining few compounds could
not be identified at this stage. Nevertheless, for both THP1.0 V P and
3R4F MTS VP samples, it constitutes the first comprehensive list of
VOCs composing their chemical profile. Previously, a TD-GC × GCTOFMS approach was able to tentatively identify 127 compounds
[5]. When compared to our current approach that was able to identify 181 compounds in the carbon number range C6 -C14 , a set of 56
compounds were found to be common to both studies (Table S2).
When we consider the identified compounds of THP1.0 V P and
3R4F MTS VP samples, 35 compounds were common to both THP1.0
aerosol VP and 3R4F MTS VP samples and are highlighted in Table 1
and in Supplementary information, Table S2. The identified compounds were further grouped in chemical classes (Table 2) to
highlight major chemical differences between the two types of
aerosol VP. It appeared that the higher chemical complexity of 3R4F
MTS samples (202 compounds versus 85 compounds for THP1.0
aerosol VP) was mainly due to the large number of acyclic, alicyclic
and monocyclic aromatic hydrocarbons. In 3R4F MTS VP, these
three chemical families accounted for 71% of the 202 compounds
found. For THP1.0 V P, these three chemical families accounted for
16% of the 85 compounds found, while heterocyclics, aldehydes and
ketones accounted for 53%. These data illustrate the chemical difference between the VP produced by combustion and pyrolysis of
tobacco and the VP of an aerosol produced by lower temperature
heating of tobacco [4]. Interestingly, it also appeared that, among
the so-called ‘Hoffmann list’ of 44 compounds of prime interest in
terms of toxicity, seven and six analytes were present in VP samples
generated in 3R4F MTS (Supplementary Information, Table S2) and
THP1.0 aerosol (Table 1), respectively. Among them, there were 5
common compounds (2-propanone, 2-butanone, pyridine, toluene
and styrene).
3.2.2. Semi-quantitative analysis using FID
FID/TOFMS dual detection was intended to facilitate semiquantitative analysis of the samples. Tobacco-related samples
contain hundreds of compounds over several orders of magnitude
of concentration [5,40]. This presents a challenge for mass analysers that have linear dynamic ranges limited to 3 or 4 decades. After
robust assignment of compound identities based on (HR)TOFMS,
FID signals were used for semi-quantification [21,22]. Because
of the non-targeted nature of analysis, a generic, external calibration was constructed using representative compounds from
thirteen chemical classes (Supplementary Information, Table S1).
The selection of standard compounds was based on the assigned
VOC chemical classes in VP fractions of THP1.0 aerosol and 3R4F
MTS samples. The calibration range was based on detectability
of both FID and TOFMS detectors (data not shown). The lowest
point was set at 0.1 g/L, lower concentrations were reported
as traces. The highest point (50 g/L) was set after measuring
THP1.0 V P samples. Three compounds in 3R4F MTS VP (Table S2)
were out of that range, thus these compounds concentrations were
estimated from an extention of the calibration plot. Compounds
were semi-quantified using the response factor obtained for the
representative substance of the same class in the calibration solution after normalisation between samples and calibration using
another external standard to address potential instrumental drift.
If no representative compound was included in calibration, nonclassified compounds (organosulfur, miscellaneous and unknowns)
were semi-quantified using the factors obtained for bromobenzene,
acetonitrile and p-xylene, respectively.
The results of the external 9-point calibration (n = 4) at the
g/L level demonstrated acceptable reproducibility (RSD% < 6%,
range 3–6%) for all compounds (Supplementary Information, Table
S1). Semi-quantitative results for chemical classes identified in the
vapour phase fractions of THP1.0 aerosol and 3R4F MTS are presented in Table 2.
Fig. 3 illustrates the differences in chemical composition
and abundance between THP1.0 V P and 3R4F MTS VP samples.
THP1.0 V P generally contained lower abundances of the less
volatile components of chemical classes, which would be expected
when considering the temperatures at which the aerosols were
formed. The major THP1.0 V P classes were aldehydes, ketones,
esters and heterocyclic compounds. In 3R4F MTS VP, hydrocarbons, ketones, and heterocyclic compounds were more abundant
and spanned a wider range of volatility.
B. Savareear et al. / J. Chromatogr. A 1581–1582 (2018) 105–115
113
Table 2
Summary of qualitative and semi-quantitative information for VP samples of THP1.0 aerosol and 3R4F cigarette smoke with their respective relative percentage.
THP1.0 V P
3R4F MTS VP
Chemical
class
Chemical class name
No. of
analytes
Relative
% of
analyte
Amount
(g/stick)
Relative
% of
amount
No. of
analytes
Relative
% of
analyte
Amount
(g/stick)
Relative
% of
amount
1
2
3
4
5
6
7
8
9
10
11
12
13
Acyclic hydrocarbons
Alicyclic hydrocarbons
Heterocyclic compounds
Monocyclic aromatic
hydrocarbons
Polycyclic aromatic
hydrocarbons
Alcohols
Aldehydes
Ketones
Esters
Nitriles
Organosulfur compounds
Miscellaneous compounds
Unknowns
3
3
18
9
2
1
14
14
9
ND
3
3
6
4
4
21
11
2
1
16
16
11
ND
4
4
7
1.4
2.8
11.9
1.1
1.6
0.1
48.3
37.9
9.5
0.0
2.8
0.2
0.1
1
2
10
1
1
0
41
32
8
0
2
0
0
70
41
17
33
3
ND
7
14
1
8
2
2
4
35
20
8
16
1
ND
3
7
0
4
1
1
2
496.8
173.1
69.4
119.0
2.4
0.0
57.6
264.4
2.5
36.8
4.7
1.2
1.0
40
14
6
10
0
0
5
22
0
3
0
0
0
ND-not detected.
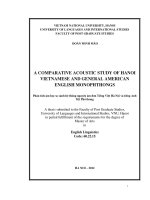
Fig. 3. TD-GC × GC-LRTOFMS two-dimensional apex bubble plot illustrating the difference in relative chemical complexity between 3R4F MTS (top) and THP1.0 aerosol (bottom). Bubble sizes are related to levels of analytes. For data visualisation purpose, bubble sizes were rescaled based on concentration intervals: <0.1 g = 1; 0.1-0.25 g = 2.5;
0.25-0.5 g = 5; 0.5–1 g = 10; 1–2.5 g = 15; 2.5–5 g = 20; 5–10 g = 25; 10–25 g = 30; 25–50 g = 35; 50–100 g = 40; >100 g = 60 (see Tables 1 and S2 for detailed values).
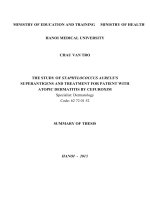
Fig. 4. Illustrating the distribution of chemical concentration based on their chemical classes for compounds found in both THP1.0 V P and 3R4F MTS VP samples.
114
B. Savareear et al. / J. Chromatogr. A 1581–1582 (2018) 105–115
Fig. 5. Differences of chemical concentration of 35 overlapping compounds found in both 3R4F MTS VP and THP1.0 V P samples. Y-axis inserted as logarithmic scale for data
visualisation purpose (actual values are provided in Tables 1 and S2).
The total abundance of compounds present in the VP fraction of 3R4F MTS was estimated to be ten times greater than in
THP1.0 aerosol VP. In 3R4F MTS VP, acyclic, alicyclic and monocyclic aromatic hydrocarbons accounted for 64% in terms of the
total estimated concentration. For THP1.0 V P, these three chemical
families represented less than 4% of the total estimated concentration. Aldehydes, ketones, and heterocyclics accounted for 41%,
32% and 10% respectively of the total estimated concentration of
analytes in THP1.0 V P. Table 1 (and Supplementary information,
Table S2) provides individual semi-quantitative values in g per
consumable (stick) for each assigned compound. Fig. 4 illustrates
the chemical distribution of the 35 compounds present in both sample types. The summed concentration of these 35 compounds was
six times higher in 3R4F MTS VP (457.5 g/stick) than in THP1.0 V P
(73.7 g/stick). When considering relative amounts, of the 35 common compounds found in THP1.0 and 3R4F MTS products, higher
concentrations were systematically measured in MTS, on a whole
product basis, except for pyridine and dimethyl trisulfide (Fig. 5).
In these two cases, the levels in THP1.0 appeared to be marginally
higher but confirmation of any difference would require quantitative analysis. Finally, in terms of semi-quantification, 2-propanone
(one of the ‘Hoffmann list’ toxicants) was present at significantly
lower concentrations in THP1.0 V P samples (13.3 g/stick) than in
3R4F MTS VP (152 g/stick). Similarly, the concentrations of other
Hoffmann list compounds (e.g. toluene, 2-butanone and styrene)
were significantly reduced in THP1.0 V P compared to 3R4F MTS VP
(see Tables 1 and Table S2 for detailed values). Results were also
compared to Li et al. data [3], despite the fact that they used a target approach using different THP 2.2 product to compare to MTS
VP. They studied the percentage reduction of analytes concentration between THP2.2 and MTS samples. The percentage reduction
rate of toluene and 2-propanone were 97% and 87%, respectively.
Almost similar results were found in the present work for toluene
(99%) and 2-propanone (91%). The reduction rate of 2-butnaone
was found to be 41% in their study [3] although a 97% reduction
rate was observed for THP1.0 V P sample. The present work was
based on a preliminary semi-quantitative approach that requires
further validtion using specific calibration solutions, ideally using
stable isotope dilution.
4. Conclusions
A novel characterization approach based on the use of
independent and complementary TD-GC × GC-TOFMS/FID and TDGC × GC-HRTOFMS methods have been developed for the analysis
of the VP aerosol fraction of THP1.0 and 3R4F MTS. Compounds
were identified using LRIs, MS matches against spectral libraries
using both LRTOFMS and HRTOFMS data, and accurate mass values.
This comprehensive data mining approach permitted the assignment of chemical identity for more than 90% of the detected
constituents for both sample types. The chemical composition of
the VP of THP1.0 aerosol was observed to be much less complex
than 3R4F MTS VP. The GC × GC-FID semi-quantitative data indicated that the total abundance of analytes in the THP1.0 V P was ten
times lower than in the 3R4F MTS VP. In conclusion, the present
study provides data that contribute to a more extensive chemical characterisation of the aerosols generated by tobacco heating
products.
Appendix A. Supplementary data
Supplementary material related to this article can be found, in
the online version, at doi: />10.035.
References
[1] J.-P. Schaller, D. Keller, L. Poget, P. Pratte, E. Kaelin, D. McHugh, G. Cudazzo, D.
Smart, A.R. Tricker, L. Gautier, M. Yerly, R.R. Pires, S. Le Bouhellec, D. Ghosh, I.
Hofer, E. Garcia, P. Vanscheeuwijck, S. Maeder, Evaluation of the tobacco
heating system 2.2. Part 2: chemical composition, genotoxicity, cytotoxicity,
and physical properties of the aerosol, Regul. Toxicol. Pharmacol. 81 (2016)
S27–S47.
[2] M. Forster, S. Fiebelkorn, C. Yurteri, D. Mariner, C. Liu, C. Wright, K. McAdam, J.
Murphy, C. Proctor, Assessment of novel tobacco heating product THP1.0. Part
3: Comprehensive chemical characterisation of harmful and potentially
harmful aerosol emissions, Regul. Toxicol. Pharmacol. 93 (2018) 14–33.
[3] X. Li, Y. Luo, X. Jiang, H. Zhang, F. Zhu, S. Hu, H. Hou, Q. Hu, Y. Pang, Chemical
analysis and simulated pyrolysis of tobacco heating system 2.2 compared to
conventional cigarettes, Nicotine Tob. Res. (2018) 1–8.
[4] B. Savareear, R. Lizak, M. Brokl, C. Wright, C. Liu, J.-F. Focant, Headspace
solid-phase microextraction coupled to comprehensive two-dimensional gas
chromatography-time-of-flight mass spectrometry for the analysis of aerosol
from tobacco heating product, J. Chromatogr. A 1520 (2017) 135–142.
B. Savareear et al. / J. Chromatogr. A 1581–1582 (2018) 105–115
[5] B. Savareear, M. Brokl, C. Wright, J.-F. Focant, Thermal desorption
comprehensive two-dimensional gas chromatography coupled to time of
flight mass spectrometry for vapour phase mainstream tobacco smoke
analysis, J. Chromatogr. A 1525 (2017) 126–137.
[6] M. Brokl, L. Bishop, C.G. Wright, C. Liu, K. McAdam, J.F. Focant, Multivariate
analysis of mainstream tobacco smoke particulate phase by headspace
solid-phase micro extraction coupled with comprehensive two-dimensional
gas chromatography-time-of-flight mass spectrometry, J. Chromatogr. A 1370
(2014) 216–229.
[7] Q. Ye, Development of solid-phase microextraction followed by gas
chromatography-mass spectrometry for rapid analysis of volatile organic
chemicals in mainstream cigarette smoke, J. Chromatogr. A 1213 (2008)
239–244.
[8] E. Simonavicius, A. McNeill, L. Shahab, L.S. Brose, Heat-not-burn tobacco
products: a systematic literature review, Tob. Control 0 (2018) 1–13.
[9] J.-Z. Dong, J.N. Glass, S.C. Moldoveanu, A simple GC–MS technique for the
analysis of vapor phase mainstream cigarette smoke, J. Microcolumn Sep. 12
(3) (2000) 142–152.
[10] T. Miyake, T. Shibamoto, Quantitative analysis by gas chromatography of
volatile carbonyl compounds in cigarette smoke, J. Chromatogr. A 693 (1995)
376–381.
[11] K.G. Darrall, J.A. Figgins, R.D. Brown, G.F. Phillips, Determination of benzene
and associated volatile compounds in mainstream cigarette smoke, Analyst
123 (1998) 1095–1101.
[12] G. Barrefors, G. Petersson, Assessment of ambient volatile hydrocarbons from
tobacco smoke and from vehicle emissions, J. Chromatogr. A 643 (1993)
71–76.
[13] S.M. Charles, S.A. Batterman, C. Jia, Composition and emissions of VOCs in
main- and side-stream smoke of research cigarettes, Atmos. Environ. 41
(2007) 5371–5384.
[14] S. Uchiyama, T. Tomizawa, Y. Inaba, N. Kunugita, Simultaneous determination
of volatile organic compounds and carbonyls in mainstream cigarette smoke
using a sorbent cartridge followed by two-step elution, J. Chromatogr. A 1314
(2013) 31–37.
[15] E. Woolfenden, Sorbent-based sampling methods for volatile and
semi-volatile organic compounds in air. Part 1: sorbent-based air monitoring
options, J. Chromatogr. A 1217 (2010) 2674–2684.
[16] P.-H. Stefanuto, K. Perrault, S. Stadler, R. Pesesse, M. Brokl, S. Forbes, J.-F.
Focant, Reading cadaveric decomposition chemistry with a new pair of
glasses, ChemPlusChem 79 (2014) 786–789.
[17] S. Stadler, P.-H. Stefanuto, M. Brokl, S.L. Forbes, J.-F. Focant, Characterization
of volatile organic compounds from human analogue decomposition using
thermal desorption coupled to comprehensive two-dimensional gas
chromatography–time-of-flight mass spectrometry, Anal. Chem. 85 (2013)
998–1005.
[18] S.L. Forbes, K.A. Perrault, P.-H. Stefanuto, K.D. Nizio, J.-F. Focant, Comparison
of the decomposition VOC profile during winter and summer in a moist,
mid-latitude (Cfb) climate, PLoS One 9 (2014).
[19] M. Brokl, L. Bishop, C.G. Wright, C. Liu, K. McAdam, J.F. Focant, Analysis of
mainstream tobacco smoke particulate phase using comprehensive
two-dimensional gas chromatography time-of-flight mass spectrometry, J.
Sep. Sci. 36 (2013) 1037–1044.
[20] J. Dallüge, R.J.J. Vreuls, J. Beens, U.A.Th. Brinkman, Optimization and
characterization of comprehensive two-dimensional gas chromatography
with time-of-flight mass spectrometric detection (GC×GC-TOF MS), J. Sep. Sci.
25 (2002) 201–214.
[21] R. Shellie, P. Marriott, P. Morrison, Comprehensive two-dimensional gas
chromatography with flame ionization and time-of-flight mass spectrometry
detection : qualitative and quantitative analysis of west Australian
sandalwood oil, J. Chromatogr. Sci. 42 (2004) 417–422.
[22] Z.L. Cardeal, M.D.R. Gomes da Silva, P.J. Marriott, Comprehensive
two-dimensional gas chromatography/mass spectrometric analysis of pepper
volatiles, Rapid Commun. Mass Spectrom. 20 (2006) 2823–2836.
[23] T. Dijkmans, M.R. Djokic, K.M. Van Geem, G.B. Marin, Comprehensive
compositional analysis of sulfur and nitrogen containing compounds in shale
oil using GC×GC – FID/SCD/NCD/TOF-MS, Fuel 140 (2015) 398–406.
115
[24] L. Nicolotti, C. Cordero, D. Bressanello, C. Cagliero, E. Liberto, F. Magagna, P.
Rubiolo, B. Sgorbini, C. Bicchi, Parallel dual secondary column-dual detection:
a further way of enhancing the informative potential of two-dimensional
comprehensive gas chromatography, J. Chromatogr. A 1360 (2014) 264–274.
[25] D. Bressanello, E. Liberto, M. Collino, S.E. Reichenbach, E. Benetti, F. Chiazza, C.
Bicchi, C. Cordero, Urinary metabolic fingerprinting of mice with diet-induced
metabolic derangements by parallel dual secondary column-dual detection
two-dimensional comprehensive gas chromatography, J. Chromatogr. A 1361
(2014) 265–276.
[26] P.Q. Tranchida, S. Salivo, I. Bonaccorsi, A. Rotondo, P. Dugo, L. Mondello,
Analysis of the unsaponifiable fraction of lipids belonging to various
milk-types by using comprehensive two-dimensional gas chromatography
with dual mass spectrometry/flame ionization detection and with the support
of high resolution time-of-flight mass, J. Chromatogr. A 1313 (2013) 194–201.
ˇ
[27] J. Krupˇcík, R. Gorovenko, I. Spánik,
P. Sandra, D.W. Armstrong,
Flow-modulated comprehensive two-dimensional gas chromatography with
simultaneous flame ionization and quadrupole mass spectrometric detection,
J. Chromatogr. A 1280 (2013) 104–111.
[28] D. Turner, G.H. Morgan, B. White, A matter of taste . . ..flavour profiling by
GCxGC-qMS / FID, Chromatogr. Today (2012) 40–43,
flavour profiling by gcxgc-qmsfid/1136/. (Accessed online on 12/04/2018)
/>turner dr g.h. morgan bryan white/a matter of taste.
[29] P.-H. Stefanuto, K.A. Perrault, R.M. Lloyd, B. Stuart, T. Rai, S.L. Forbes, J.-F.
Focant, Exploring new dimensions in cadaveric decomposition odour
analysis, Anal. Methods 7 (2015) 2287–2294.
[30] Y. Duan, F. Zheng, H. Chen, M. Huang, J. Xie, F. Chen, B. Sun, Analysis of
volatiles in dezhou braised chicken by comprehensive two-dimensional gas
chromatography/high resolution-time of flight mass spectrometry, LWT –
Food Sci. Technol. 60 (2015) 1235–1242.
[31] J.D. Byer, K. Siek, K. Jobst, Distinguishing the C3 vs SH4 mass split by
comprehensive two-dimensional gas chromatography-high resolution
time-of-flight mass spectrometry, Anal. Chem. 88 (2016) 6101–6104.
[32] D.D. Yan, Y.F. Wong, L. Tedone, R.A. Shellie, P.J. Marriott, S.P. Whittock, A.
Koutoulis, Chemotyping of new hop (Humulus lupulus L.) genotypes using
comprehensive two-dimensional gas chromatography with quadrupole
accurate mass time-of-flight mass spectrometry, J. Chromatogr. A 1536
(2017) 110–121.
[33] J. Gee, K. Prasad, S. Slayford, A. Gray, K. Nother, A. Cunningham, E.
Mavropoulou, C. Proctor, Assessment of tobacco heating product THP1.0. Part
8: study to determine puffing topography, mouth level exposure and
consumption among Japanese users, Regul. Toxicol. Pharmacol. 93 (2018)
84–91.
[34] ISO, 3308, Routine Analytical Smoking Machine-Definition and Standard
Conditions, International Organisation for Standardisation, Geneva, 2000.
[35] T. Kind, O. Fiehn, Metabolomic database annotations via query of elemental
compositions: Mass accuracy is insufficient even at less than 1 ppm, BMC
Bioinform. 7 (2006) 1–10.
[36] Linear Retention Indices database onlines: />pccompound?cmd=search (Accessed 20 March 2018).
[37] P. Ausloos, C.L. Clifton, S.G. Lias, A.I. Mikaya, S.E. Stein, D.V. Tchekhovskoi, O.D.
Sparkman, V. Zaikin, D. Zhu, The critical evaluation of a comprehensive mass
spectral library, J. Am. Soc. Mass Spectrom. 10 (1999) 287–299.
[38] A. Giri, M. Coutriade, A. Racaud, K. Okuda, J. Dane, R.B. Cody, J.-F. Focant,
Molecular characterization of volatiles and petrochemical base oils by
photo-ionization GC×GC-TOF-MS, Anal. Chem. 89 (2017) 5395–5403.
[39] E. Rathahao-Paris, S. Alves, C. Junot, J.-C. Tabet, High resolution
massspectrometry for structural identification of metabolites in
metabolomics, Metabolomics 12 (2016) 10.
[40] J. Dallüge, L.L.P. van Stee, X. Xu, J. Williams, J. Beens, R.J.J. Vreuls, U.A.Th.
Brinkman, Unravelling the composition of very complex samples by
comprehensive gas chromatography coupled to time-of-flight mass
spectrometry, J. Chromatogr. A 974 (2002) 169–184.