Development and validation of a method for quantification of two tobacco-specific nitrosamines in indoor air
Bạn đang xem bản rút gọn của tài liệu. Xem và tải ngay bản đầy đủ của tài liệu tại đây (1.14 MB, 10 trang )
Journal of Chromatography A, 1580 (2018) 90–99
Contents lists available at ScienceDirect
Journal of Chromatography A
journal homepage: www.elsevier.com/locate/chroma
Development and validation of a method for quantification of two
tobacco-specific nitrosamines in indoor air
María Gómez Lueso a , Maya I. Mitova a,∗ , Nicolas Mottier a,b , Mathieu Schaller a ,
Michel Rotach a , Catherine G. Goujon-Ginglinger a
a
b
PMI R&D, Philip Morris Products S.A., Quai Jeanrenaud 5, CH-2000 Neuchâtel, Switzerland
Service de la Consommation et des Affaires Vétérinaires, Chemin des Boveresses 155, 1066 Epalinges, Switzerland
a r t i c l e
i n f o
Article history:
Received 13 July 2018
Received in revised form
28 September 2018
Accepted 17 October 2018
Available online 23 October 2018
Keywords:
Tobacco-specific nitrosamines
Validation
Accuracy profile
Environmental aerosol
Tobacco heating system
e-Cigarette
a b s t r a c t
A sensitive and accurate method for the quantification of 1 -Demethyl-1 -nitrosonicotine (NNN) and
4-(methylnitrosamino)-1-(3-Pyridyl)-1-butanone (NNK) in indoor air was developed and validated.
To this aim, a novel approach for the collection of two tobacco-specific nitrosamines, using silica
sorbent cartridges followed by simplified sample preparation and isotope dilution liquid chromatography/electrospray ionization tandem mass spectrometry, was applied. This procedure led to a substantial
improvement in terms of sensitivity and sample throughput as compared with methods using conventional trapping. For the validation, a matrix-based approach using an accuracy profile procedure was
selected. The evaluated matrices were background air samples, environmental aerosols of a heat-not®
burn tobacco product (Tobacco Heating System [THS] 2.2, commercialized under the brand IQOS ), a
®
rechargeable electronic cigarette (Solaris ), and the environmental tobacco smoke (ETS) of a conven®
tional cigarette (Marlboro Gold ). The method showed excellent recoveries, sensitivity, and precision. The
limits of detection of the method for NNN and NNK were 0.0108 ng/m3 and 0.0136 ng/m3 , respectively.
The calibration range of the instrument spanned 0.2–60 ng/mL. The calculated lower working range limit
(LWRL) of the method for NNN was 0.126 ng/m3 , and the LWRL for NNK was 0.195 ng/m3 . The method was
applied to evaluate surrogate environmental aerosols generated using smoking machines. This model is
reliable but gives a large overestimation of the possible impact of THS 2.2 and e-cigarettes on indoor air,
because the retention of NNN and NNK in the body of the consumers is not taken into account. As a consequence, the values reported do not reflect a real-life setting. The contents of the two target compounds
in the surrogate environmental aerosols were 0.0830 ± 0.0153 ng/m3 of NNN and 0.0653 ± 0.0138 ng/m3
of NNK for THS 2.2, 0.0561 ± 0.0296 ng/m3 of NNN for e-cigarettes, and 0.816 ± 0.109 ng/m3 of NNN and
4.13 ± 1.04 ng/m3 NNK for cigarettes. These values correspond to 10% of the measured ETS concentration
for NNN in environmental aerosols of THS 2.2 and 7% for those of e-cigarettes. For NNK, the value for the
environmental aerosol of THS 2.2 was 2% of the ETS value.
© 2018 PMI R&D, Philip Morris Products S.A., Quai Jeanrenaud 5, 2000 Neuchâtel, Switzerland.
Published by Elsevier B.V. This is an open access article under the CC BY license (http://
creativecommons.org/licenses/by/4.0/).
1. Introduction
Tobacco-specific nitrosamines (TSNA) are carcinogens known
to be specifically associated with tobacco, tobacco smoke,
and related nicotine-containing products [1]. In 1964, 1 demethyl-1 -nitrosonicotine; 1-nitroso-2-(3-pyridyl)pyrrolidine;
N-nitrosonornicotine (NNN) was proven to cause pulmonary
cancer in mice, as was 4-(methylnitrosamino)-1-(3-Pyridyl)-
∗ Corresponding author.
E-mail address: (M.I. Mitova).
1-butanone;
4-(N-methyl-N-nitrosamino)-1-(3-pyridyl)-1butanone; nicotine-derived nitrosamine ketone (NNK) in 1980 [2].
Further investigations demonstrated that both NNN and NNK are
carcinogens inducing several types of cancer in laboratory animals,
with NNK being more active than NNN [3,4]. Both compounds are
included on the U.S. Food and Drug Administration (FDA) list of
harmful and potentially harmful constituents in tobacco products
and tobacco smoke [5] and are classified as carcinogens of Group
1 by the International Agency for Research on Cancer [6].
TSNAs are present at trace levels in freshly harvested tobacco;
however, their concentration might vary depending on the type
of tobacco and the fertilizers used during the tobacco plant grow-
/>0021-9673/© 2018 PMI R&D, Philip Morris Products S.A., Quai Jeanrenaud 5, 2000 Neuchâtel, Switzerland. Published by Elsevier B.V. This is an open access article under the
CC BY license ( />
M. Gómez Lueso et al. / J. Chromatogr. A 1580 (2018) 90–99
ing [7]. NNN and NNK are mainly formed by nicotine nitrosation,
although NNN can also be generated by nornicotine nitrosation
[3,4]. This process occurs mostly during the processing, curing,
and storage of tobacco and tobacco products [3,7]. In mainstream
cigarette smoke, NNK and NNN derive partially from the distillation of these nitrosamines, which are pre-formed in the tobacco,
and NNK is also the result of thermal release of the matrix-bound
form, while another fraction is pyrosynthesized by nitrosation of
the respective alkaloid precursors, possibly with nitrogen oxides
originating from the nitrate, present in high concentrations in some
tobacco types [3,8,9]. NNK and NNN are also present in sidestream
smoke, and their yields are at the same level or two to five times
higher than those found in mainstream smoke [10,11]. The formation of NNK is favored during the smoldering of cigarettes when
sidestream smoke is generated [10]. As a consequence, indoor air
enriched with environmental tobacco smoke (ETS), defined as an
aged and diluted mixture of exhaled smoke and sidestream smoke,
contains NNN and NNK. Published data on ETS in real-life and
simulated environments indicate concentrations of both NNN and
NNK in the low ng/m3 range (NNN: not detected − 23 ng/m3 ; NNK
1–29 ng/m3 ) [10–13].
Studies of TSNA content in tobacco leaf [14,15] and in mainstream [14,16–19] and sidestream [20] cigarette smoke have been
conducted over the years using different methodologies. However,
more recently, the liquid chromatography coupled to tandem mass
spectrometry (LC–MS/MS) technique has become the reference
methodology for TSNA analysis [21]. An interlaboratory comparison of the performance of several methods for the quantification
of TSNAs in mainstream smoke was published [19], but overall, few
publications about TSNA content in ETS exist [11–13,22,23].
In recent years, the impact of new products, such as electronic
cigarettes [24–30] or heated tobacco systems [13,31–34], on indoor
air quality has been evaluated. Tricker et al. [13] reported NNN
concentrations at background levels (0.250 ng/m3 ), while NNK concentrations were in the range of 0.300–0.691 ng/m3 (background
levels 0.300–0.602 ng/m3 ) during indoor use in simulated “Office”
and “Hospitality” environments of a product developed in the
1980s. The detected presence of TSNAs in background air was not
explainable and might have been due to cross-contamination.
NNN and NNK were reported in the exhaled breath of e-cigarette
users who vaped e-liquids that had been contaminated with TSNAs
[35]. However, to the best of our knowledge, NNN and NNK have
not been investigated in the environmental aerosols of e-cigarettes.
Furthermore, and again to the best of our knowledge, since 1992
[12] there have been no publications reporting on improvements
in TSNA trapping and analyses in air samples. Recent publications on the quantification of airborne TSNAs describe approaches
which applied procedures developed for mainstream smoke analyses [13,24,34,36]. As a consequence, methods with LLOQ above
0.3 g/m3 have been reported [24,34]. Other publications describe
approaches where the lowering of the reporting limits of the methods was achieved by laborious sample preparation procedures
[13,36].
As the concentrations of NNN and NNK in the environmental
aerosols of heat-not-burn products and e-cigarettes are foreseen to
be much lower than those in ETS [13,31–34,37,38], a new method
aiming at improving both the sensitivity and sample throughput
was developed in order to ensure quantification of NNN and NNK
in air in a reliable manner. A validation applying accuracy profiles was undertaken to allow rigorous evaluation of the method
performance and any possible matrix effect on the quantification
of the target compounds. For the development and the validation
of the method, the samples were collected in an environmentally controlled room. Surrogate environmental aerosols and ETS
were generated with smoking machines to improve reproducibility
between experiments.
91
2. Material and methods
2.1. Chemicals
The following compounds were purchased from Sigma-Aldrich:
NNN certified solution (1 mg/mL in methanol), NNK certified solution (1 mg/mL in methanol), tetrahydrofuran (HPLC grade), water
®
with 0.1% formic acid CHROMASOLV (LC–MS grade), methanol
CHROMASOLV (LC–MS grade), formic acid (eluent additive for
LC–MS) and ethyl acetate.
The following compounds were purchased from Chemie Brunschwig AG: 4-(methylnitrosamino)-1-(3-pyridyl-D4 )-1-butanone
(NNK-D4 , 0.1 mg/mL in methanol) and rac N’-NitrosonornicotineD4 (NNN-D4 , 0.1 mg/mL in methanol).
The Sep-Pak Silica 690 mg sorbent cartridges were purchased
from Waters.
2.2. Test items
For the validation of the TSNA method, four matrices were generated. Ambient air of an empty, environmentally controlled room
without consumption of any product was used as the background
matrix. Ambient air enriched with the mainstream aerosol of
Tobacco Heating System (THS) 2.2 (marketed under the IQOS brand
®
name) or a cig-a-like e-cigarette (marketed under the Solaris
®
brand name in Spain and under the MarkTen brand name in the
U.S.) were used as surrogate environmental aerosols of a heat-notburn product and e-cigarette, respectively. Regular THS 2.2 was
used for the experiments. A detailed description of the THS 2.2
(Fig. S1) has been presented by Smith et al. [39]. The Solaris KS
type is an e-cigarette with a cartomizer and a rechargeable battery
of 90 mA. The cartomizer contains 0.4 mL of a tobacco-flavored liquid consisting of 20.3 mg/mL nicotine. (Fig. S1). The cigarettes used
for generation of the surrogate ETS (aged and diluted sidestream
smoke) were Marlboro Gold retailed on the Swiss market (characterized by 6 mg tar, 0.5 mg nicotine, and 7 mg carbon monoxide
(CO) under International Organization for Standardization testing
conditions). The Marlboro Gold cigarettes and THS 2.2 were manufactured by Philip Morris Products S.A, Neuchâtel, Switzerland. The
®
Solaris items were manufactured by Numark LLC, Richmond, VA,
USA. The items were not conditioned before use in order to simulate
real-life usage.
2.3. Sample generation and environmentally controlled room
All of the indoor air samples were collected in the environmentally controlled room located at the Philip Morris International
Research and Development facilities in Neuchâtel, Switzerland (Fig.
S2). This room has been described in detail in previous publications [31]. All of the samples (except the background sample)
were generated by means of three single-channel, programmable,
dual-syringe pumps (PDSP, Burghart, Wedel, Germany). The TSNA
validations were undertaken using a simulation of “Residential”
environmental conditions (category I adapted from the EN standard
15251:2007) [40], characterized by a ventilation of 121 m3 /h corresponding to 1.67 air changes per hour. Two fans were used to mix
and distribute the air in the room. The humidity was monitored,
and the temperature was set to 23 ◦ C ± 3 ◦ C. The environmental
aerosols of THS 2.2 and the ETS samples were generated under
the Health Canada Intense machine-smoking regime with 12 and
10 puffs for the THS 2.2 tobacco stick and cigarette, respectively
() [41]. Three test items were used per hour, for a total of 12 test
items used over the four hours of sample trapping. The environmental aerosol of the e-cigarette samples was generated under the
CORESTA machine-smoking regime () [42]. One test item (50 puffs)
was used per hour, for a total of four test items used over the four
92
M. Gómez Lueso et al. / J. Chromatogr. A 1580 (2018) 90–99
hours of sample trapping. During the ETS generation sessions, the
cigarette sidestream smoke was delivered to the environmentally
controlled room while the mainstream smoke was drawn out of the
room (surrogate ETS). For THS 2.2 and e-cigarettes, the entire mainstream aerosol was delivered to the environmentally controlled
room (surrogate environmental aerosol).
2.4. Internal standards and standards (calibration and spiking)
preparation
The internal standard solution was prepared by adding 100 L
of NNN-D4 and NNK-D4 commercial solutions to a 1000 mL volumetric flask containing 990 mL of MeOH and diluting the mixture
to the volumetric flask volume.
The NNN and NNK stock solutions were produced independently by transferring 800 L of the certified reference material to
25 mL volumetric flasks containing 20 mL of MeOH and diluting the
mixtures to the volumetric flask volume. Standard level 8 was prepared by transferring 190 L of NNK and NNN stock solution into a
100 mL volumetric flask containing 90 mL of internal standard solution and diluting the mixture to the volumetric flask volume. The
calibration standards from level 7 to level 1, as well as the spiking
standards, were prepared by dilution of the higher-concentration
standard solutions. The typical concentration for the NNN calibration standards ranged from 0.196 ng/mL of level 1 to 60.2 ng/mL
of level 8, and for the NNK calibration, the standards ranged from
0.197 ng/mL of standard 1 to 60.6 ng/mL of standard 8 (Tables S1
and S2).
Two sets of spiking standards were prepared, each one intended
for the expected concentration of the target compounds to be measured in the different matrices. The spiking concentrations were
determined during the prevalidation phase, based on the type of
matrix to be evaluated.
The first set of spiking solutions was in the range of 0.23 ng/mL
to 5 ng/mL for both NNN and NNK. This set was used for the background and environmental aerosols of THS 2.2 and e-cigarettes. A
second set of spiking solutions was prepared for ETS (0.99 ng/mL
to 30.3 ng/mL). 100 L of each spiking solution was added to each
cartridge, containing one of the four matrices of interest (Table S3).
2.5. Determination of TSNA
2.5.1. Description of the analytical method
The procedure for running the method in routine is as follows:
NNN and NNK are collected for two to four hours at a nominal
flow-rate of 1.5 L/min on Sep-Pak Silica 690 mg sorbent cartridges
(Waters Corporation). Post-collection, an amount of 100 L of the
NNN-D4 and NNK-D4 internal standard solution is added to the cartridges. The TSNAs are eluted from the cartridges through a 0.2 m
polyvinylidene fluoride filter (Millipore Corporation) with 3.5 mL
ethyl acetate and collected in 2 mL cryogenic vials (Corning Inc.).
The cryogenic vials containing the TSNA solution are placed on a
thermal concentrator (Stuart), and the solvent is evaporated to dryness under a nitrogen flush over a period of approximately 35 min.
The residuals are dissolved by addition of 100 L of methanol to the
cryogenic vial that, once capped, is vortexed briefly. The obtained
solutions are transferred into inserts, placed in amber LC vials, and
then capped (Fig. S3).
Two L of the solutions are injected and analyzed by liquid chromatography coupled with a triple quadrupole mass spectrometer
(LC-ESI–MS/MS 5500 QQQ, ABSciex, Framingham, Massachusetts,
USA) equipped with a heated nebulized interface in positive
ionization mode. A gradient separation is performed on a Kinetex pentafluorophenyl propyl (PFP) column (50 × 2.1 mm, 1.9 m)
HPLC column (Phenomenex), using 0.1% formic acid in water
as mobile phase A and 1 mL of formic acid into 90% methanol
LC–MS grade/10% tetrahydrofuran (THF) as mobile phase B. The
details are presented in Table S4. The analytes are detected by
multiple-reaction-monitoring using compound-dependent parameters (Table S5). The source temperature is set at 600 ◦ C, the ion
source gas is set at 30 [AU], the nebulizer current is set at 5500 V,
the collision gas is set at 5 [AU], and target scan time is set at 0.27 s
(Table S6).
The method is accredited under ISO 17025 by the Swiss Accreditation Service (SAS) (STS 0045, SAS, Bern, Switzerland).
2.5.2. Validation design
The validation was designed to assess all the method performance parameters as a function of the matrices. The evaluated
parameters were selectivity, linearity, and integrity of the response
function; instrumental limit of detection (LOD), lower limit of
quantification (LLOQ), and upper limit of quantification (ULOQ);
repeatability limit and instrumental repeatability; intermediate
precision (IP) limit; critical difference (CD); recovery; working
range; and uncertainty. To evaluate the matrix effect on the performance of the method, the use of spiked samples was selected.
The validation data were acquired by using unspiked homogenized and non-homogenized samples as well as spiked homogenized samples. All of the samples were collected over a period
of four hours and extracted, as described in 2.5.1. Four cartridges
were used for the preparation of two different types of solutions:
homogenized or non-homogenized samples. For the homogenized
samples, the eluents from four different cartridges were collected
in a larger container and mixed well; the solution was subsequently
split among four different cryogenic vials (Fig. S3). The extract of
each cartridge was collected individually for the non-homogenized
samples.
To prepare the samples with internal standard (homogenized
and non-homogenized), an amount of 100 L of the NNN-D4 and
NNK-D4 internal standard solution was added to the cartridges.
For the samples without internal standard (homogenized and nonhomogenized), 100 L of MeOH were added instead. The spiked
samples were produced by spiking 100 L of the different spiking
standards (containing internal standard) directly on the cartridges
(see section 2.4).
Four series for each type of sample were collected per compound
and matrix. To be able to obtain sufficient measurement solutions to
prepare all necessary samples, two days of sampling were required
to complete one series. Each day, 26 test portions were collected on
the cartridges. On the first day of each series, the samples collected
were used to produce the homogenized matrix, non-homogenized
matrix, and spiking levels 1–3. On the second day of the series, the
samples collected were used to prepare the homogenized matrix
and spiking levels 4–6. Four replicates were analyzed per sample
type or level of spike. The spiking ranges were adapted according
to the samples’ endogenous content of each TSNA, as they differed
substantially in the four different matrices (Table S7).
The sample preparation and the analysis were performed by two
trained operators.
A summary of all formulas used for the statistical computations
is given in Table S8.
3. Results and discussion
The following section is divided into two parts. The first is related
to the method development phase, and the second is focused on the
validation of the TSNA quantification method.
3.1. Method development
3.1.1. Analytical method
The development was initiated based on an internal method for
mainstream aerosol analysis and several publications [13,15–18].
M. Gómez Lueso et al. / J. Chromatogr. A 1580 (2018) 90–99
The instrument chosen for the analysis was an LC-20A
Prominence Shimadzu HPLC system coupled with an ABSciex LCESI–MS/MS 5500 QQQ. Electrospray ionization mode provided
increased sensitivity for NNN and NNK compared with the use of
atmospheric pressure chemical ionization.
For the chromatographic separation, a C18 reverse phase column, as described previously [13,16–18], was initially evaluated.
Although the chromatographic separation was relatively satisfactory, and the baseline separation of NNN and NNK with ␣ = 1.07
was achieved (Table S9 and Fig. S4), additional columns were
tested to further improve the peak separation and reduce the total
run time. As previously reported, columns with a PFP stationary
phase give promising results in the analysis of TSNAs [15]. The initial choice was to select the Pinnacle DB PFP (50 mm x 2.1 mm,
1.9 m) column with base-deactivated spherical silica, as it demonstrated good retention for amine-containing compounds as well as
efficiency with acidic mobile phases and highly aqueous mobile
phases. Indeed, the test showed an improvement in the peak separation (␣ = 1.64) and a significant reduction in the total run time
(Table S10 and Fig. S5). However, further tests demonstrated that
the column deteriorated quickly, with a decrease in analytes retention. After evaluation of several columns with the same type of
phase (Nucleodur PFP 50 mm × 2.0 mm, 1.8 m; Discovery HS F5
50 mm × 2.1 mm, 3 m; Luna PFP (2) 50 mm × 2.0 mm, 3 m; Kinetex PFP 50 mm × 2.1 mm, 1.7 m; Express F5 50 mm × 2.1 mm,
2.7 m), a Kinetex PFP 100A 50 mm × 2.1 mm, 1.9 m column was
finally selected.
As mobile phase, water/methanol solutions with 5 mM ammonium acetate or using formic acid as modifier were tested, and
isocratic and gradient conditions were evaluated. Using acidified
mobile phases A and B (0.1% formic acid in water as mobile phase
A and 0.1% of formic acid in methanol as mobile phase B) led to a
substantial increase in the peak intensities of NNN and NNK. The
addition of THF to mobile phase B increased the resolution between
the NNN and NNK peaks.
The best chromatographic performance in terms of peak resolution (between 2.66 and 5.66), peak symmetry (peak width at 50%
height between 0.0477 and 0.0915 for NNN and between 0.0782
and 0.102 for NNK), and duration of the analytical run (11 min with
column purge and equilibration) was achieved with the parameters
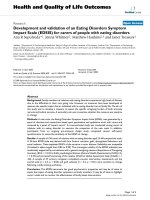
given in Table S4. A typical chromatogram is presented in Fig. 1.
3.1.2. Aerosol collection and sample preparation
The commonly used process of trapping on glass fiber Cambridge filter pads was the initial approach selected for trapping.
Tests based on the aerosol collection process and the sample preparation published by Tricker et al. [13] and Wu et al. [16] were
performed. This procedure included conditioning of the Cambridge
filter pads, treatment with ascorbic acid, and irradiation with UV
light. After sampling, a triple extraction of each Cambridge filter pad
was conducted, followed by combination of the extracts, evaporation, and reconstitution. After dissolving the residue, liquid–liquid
extraction with neutralization of the water phase was performed,
followed by solid-phase extraction with evaporation of the solvent,
and again reconstitution. The main disadvantage of this approach
was the laborious sample preparation, which adversely affected
sample throughput. In addition, as the peak intensities of NNN and
NNK in the matrix samples were very low, some recovery inefficiencies were suspected. To verify this, the Cambridge filter pads
were spiked with the calibration solutions (containing the NNN and
NNK standards as well as the deuterated compounds) to evaluate
the recovery. Very poor yields (under 37%) were obtained (Table
S11). Different tests were subsequently carried out to improve and
shorten the process. Nevertheless, even with improved recoveries
(75–80%), the sample preparation remained time-consuming.
93
Fig. 1. Typical chromatogram for NNN and NNK. The blue trace represents the
NNN transition used as quantifier (178/148). The red trace represents the NNN
transition used as qualifier (178/120). The green trace represents the NNN-D4 transition (182/152). The grey trace represents the NNK transition used as quantifier
(208.1/121.7). The light blue trace represents the NNK transition used as qualifier
(208.1/79). The pink trace represents the NNK-D4 transition (211.8/126).
To resolve this issue, a novel approach for TSNA sample collection was evaluated. The following considerations were taken
into account. TSNAs are present in the particulate phase of mainstream aerosol [11] and suspected to be distributed between the
particulate phase and gas phase of environmental aerosols [11,43].
Considering that TSNAs are polar compounds with an affinity for
polar sampling media, silica traps were evaluated. Sep-Pak Silica
Classic Cartridges (690 mg) from Waters were tested. The main
advantages of using this alternative trapping were the possible
reduction in the solvent volume used for the extraction, the possibility of removing the solid phase extraction process, and the
overall simplification of the sample preparation procedure. The first
comparative test included trapping of ETS on Cambridge filter pads
and on silica cartridges, both at 1 L/min for four hours. The results
were encouraging and indicated yields in ETS in the same order of
magnitude for both NNN and NNK (Table S12). To optimize this new
trapping procedure, further investigations were performed. Different collection flow-rates and times were considered to evaluate
breakthrough and define the best trapping conditions. No breakthrough occurred with trapping for four hours at 1.5 L/min, and
the amount of constituents increased proportionally with respect
to the values obtained for two hours of trapping. Several extraction solvents were evaluated (Table S13). Ethyl acetate was selected
due to its high volatility and the improved recovery compared with
the other solvents (Table S13). In addition, 120 mg Sep-Pak Silica
Classic Cartridges from Waters were also tested. They were discarded due to back-pressure issues at a flow-rate of 1.5 L/min (Table
S14 and Fig. S6). Moreover, higher recoveries were achieved by
filtration during elution of the sampling cartridge instead of the
reconstituted solution before conducting instrumental analysis.
3.2. Method validation
3.2.1. Selectivity
To assess the selectivity of the method for the internal standard
(NNN-D4 and NNK-D4 ), a comparison was made of the chromatograms of different blank samples (solvent and cartridges),
calibration standards, and indoor air samples (background environ-
94
M. Gómez Lueso et al. / J. Chromatogr. A 1580 (2018) 90–99
mental aerosols of THS 2.2 and e-cigarettes, and the ETS of Marlboro
Gold) with and without internal standard. For the evaluation of the
method selectivity for the target compounds, solvent and cartridge
blank chromatograms were compared with those of standard 1. To
identify unequivocally the chromatographic signals corresponding
to NNN and NNK in the matrices, spiking experiments were carried
out to assess the increase in the signal. In all of the solutions without
internal standard, the possible interference peak area signals were
below 10% of the internal standard peak area (Figs. S7–S11). Furthermore, the measurement of blank samples (e.g., solvents) and
blank collection trap signals in the area of the target compounds
never exceeded the first calibration standard concentration (Figs.
S7 and S8). A linear increase in the signals for NNN and NNK in the
chromatograms of the matrices was observed when adding spiking solutions at different concentrations (Figs. S12 and S13), and
the deviation in the retention time of the peaks for NNN and NNK,
as well as the NNN-D4 and NNK-D4 through the sequences, was
within the established acceptance range of ±0.20 min.
Thus, selectivity proved to be satisfactory for all target compounds and internal standards.
3.2.2. Linearity and integrity of the response function
For both compounds, the response function was determined by
an examination of all calibration curves injected during the validation (one calibration curve per sequence, 32 in total). The standards
used for the calibration curves contained both internal standards
(NNN-D4 and NNK-D4 ). A weighted (1/concentration), not forcedthrough-origin, quadratic response of the type y = ax2 + bx + c was
the most suitable to describe the relationship between the measured concentration (x) and the area ratio between each target
compound and the respective internal standard (y) based on the
results obtained for the residuals (Table S15; Figs. S14 and S15).
All the calculated determination coefficients were above 0.9989,
and the residuals, per level of concentration, measured during the
whole validation never exceeded ± 20% (Table S16; Figs. S16–S23).
To evaluate the integrity of the response function, a vial of standard
level 3 was injected several times through each sequence, and the
results remained within ± 20% of the theoretical concentrations for
all the sequences.
3.2.3. Instrumental LOD, LLOQ, and ULOQ
The values of the LLOQ were calculated by multiplying
the standard deviation of all the concentrations measured
for standard 1 during the validation by 10 (0.129 ng/mL
for NNN and 0.162 ng/mL for NNK) [44]. The results for
both compounds were lower than their respective standard 1 concentrations; therefore, standard 1 values were
defined as the method LLOQ (0.196 ng/mL/0.0544 ng/m3
for NNN and 0.197 ng/mL/0.0547 ng/m3 for NNK). The values of the LOD were calculated by dividing the calculated
LLOQ by 3.3 (0.0390 ng/mL/0.0108 ng/m3 for NNN and
0.0491 ng/mL/0.0136 ng/m3 for NNK). The ULOQ was set as
the highest calibration standard tested for which the respective
calibration fulfils the acceptance criteria related to the linearity of
the response function [44]. All level 8 working standards analyzed
during the validation fulfilled the acceptance criteria set for the
response function; therefore, the concentration of standard 8 was
considered as method ULOQ (60.2 ng/mL/16.7 ng/m3 for NNN and
60.6 ng/mL/16.8 ng/m3 for NNK) (Table S17).
The method described here proved superior in terms of sensitivity as illustrated by comparison with the LOD and LLOQ of
published methods (Table S18 in Supporting Information). Indeed,
both the LOD and LLOQ were one to two orders of magnitude below
those reported for the analyses of NNN (LOD: 0.625 ng/m3 ; LLOQ:
2.06 ng/m3 ) and NNK (LOD: 0.750 ng/m3 ; LLOQ: 2.48 ng/m3 ) in air
(see details in Table S18 in the Supporting Information) [13].
3.2.4. Instrumental repeatability and repeatability limit r
The measurement of the instrumental repeatability was performed by injecting the same calibration standard level (standard
3) six times through all of the sequences run for the analysis of
every single matrix. The coefficient of variation (CV) obtained for
standard 3 was compared with the value set forth in the FDA guidelines [44]. For the assessment of the repeatability limit of the whole
process, the CV obtained for the four non-homogenized samples of
the different matrices per day of analysis was also compared with
the reference values set forth in the FDA guidelines [44].
The maximum repeatability coefficients of variation (withinday coefficient of variation, CV) measured per day for NNN and
NNK were 5.8% and 7.4%, respectively, which fulfilled the 22% CVr
set as acceptance criterion for the validation [44]. The CVr (per day
of analysis) was also measured for the matrix samples. This parameter could not be evaluated for either background samples or NNK
in the environmental aerosol of e-cigarettes. CVr values for NNN in
the environmental aerosol of THS 2.2, the environmental aerosol of
e-cigarettes, and ETS were 6%, 18%, and 5%, respectively. For NNK,
the CVr was 8% for the environmental aerosol of THS 2.2 and 5%
for ETS. For both compounds, CVr never exceeded the maximum of
22% set as acceptance criterion [44].
The repeatability limit (r) was determined by analysis of four
matrix samples per day of analysis. This parameter could not
be assessed for background samples. The r values for NNN in
the environmental aerosol of THS 2.2, the environmental aerosol
of e-cigarettes, and ETS were 0.0511 ng/mL, 0.102 ng/mL, and
0.397 ng/mL, respectively. For NNK, the r values were 0.0459 ng/mL
for the environmental aerosol of THS 2.2, and 1.96 ng/mL for ETS
(Table S21).
3.2.5. Working range
3.2.5.1. Trueness. Accuracy is the sum of two parameters: precision (determined by the intermediate precision, IP) and trueness
(closeness between measured and reference values) [46]. As no reference materials were available, evaluation of these parameters
was performed by spiking experiments. The cartridges containing the aerosol collection replicates were spiked with a known
concentration of NNN and NNK and then extracted and analyzed.
The concentrations of the solutions used for spiking were aligned
according to the Association Franc¸aise de Normalisation (AFNOR)
norm [45] when the quantities for producing the spiking solutions
varied from one day to another. The endogenous content of NNN
and NNK already measured in the matrices (if any) was subtracted
from the content measured for the spiked samples to calculate the
recoveries.
As this endogenous content measured for the matrices varied
between spiking levels (spike levels 1–3 were analyzed on day 1,
levels 4–6 were analyzed on day 2) and from one series to another,
the endogenous content of the non-spiked homogenized matrix
collected the same day was subtracted for the recoveries calculation. The average endogenous content of NNN and NNK in the
background matrix was below LOD. NNN average measured values for the environmental aerosol of THS 2.2, the environmental
aerosol of e-cigarettes, and ETS were 0.306 ng/mL, 0.201 ng/mL, and
2.95 ng/mL, respectively. For NNK, the average endogenous content
values were 0.246 ng/mL for the environmental aerosol of THS 2.2
and 14.8 ng/mL for ETS.
The average recoveries in the background matrix were between
102% and 131% for NNN and between 106% and 125% for NNK. In the
environmental aerosol of THS 2.2, the average recoveries for both
compounds were between 96% and 99%. NNN average recoveries
M. Gómez Lueso et al. / J. Chromatogr. A 1580 (2018) 90–99
95
Table 1
Data used to build the accuracy profiles for NNN.
Matrix1
BKG
EA of THS2.2
ETS
EA fo e-cig
1
Spiking level
Level 1
Level 2
Level 3
Level 4
Level 5
Level 6
Level 1
Level 2
Level 3
Level 4
Level 5
Level 6
Level 1
Level 2
Level 3
Level 4
Level 5
Level 6
Level 1
Level 2
Level 3
Level 4
Level 5
Level 6
Spiking concentration
[g/mL]
0.229
0.514
0.883
1.66
3.41
4.97
0.229
0.514
0.883
1.66
3.41
4.97
0.989
1.977
4.945
7.97
15.93
30.10
0.229
0.514
0.883
1.66
3.41
4.97
Trueness values per series
1
2
3
4
Average
142
107
117
109
103
103
131
101
113
103
103
102
89
91
98
104
106
100
94
96
96
106
103
104
107
101
95
109
104
101
30
64
70
93
94
94
119
101
95
97
99
99
123
118
110
109
103
105
144
126
114
106
103
103
135
114
113
95
96
96
103
106
99
103
98
98
93
103
101
105
101
102
131
113
107
105
100
100
90
112
100
93
95
96
130
93
90
94
99
97
72
96
100
105
104
105
131
112
108
107
103
102
96
98
99
96
97
97
110
97
95
99
101
98
95
103
102
106
103
104
CVr
CVR
7
4
3
2
2
2
14
7
4
2
2
2
9
4
2
1
2
2
16
10
6
3
3
2
18
11
10
2
2
2
50
24
20
5
5
4
20
8
4
5
4
2
25
14
8
3
3
2
80% Tolerance Interval
Lower limit
Upper limit
100
93
90
104
99
99
7
56
62
87
90
91
78
84
88
91
94
95
56
83
90
102
99
101
161
131
126
111
106
105
186
139
136
105
105
103
143
110
103
108
107
102
135
124
113
111
107
107
BKG: Background, EA: Environmental Aerosol, ETS: Environmental Tobacco Smoke.
in the environmental aerosol of e-cigarettes were in the range of
95%–106% for NNN and in the range of 99%–114% for NNK. The
average recoveries measured in ETS were between 95% and 110%
for NNN and between 96% and 130% for NNK (Tables S22 and S23).
3.2.5.2. Intermediate precision limit (IP) and critical difference (CD).
The evaluation of the repeatability and IP was performed by analyzing the matrix samples collected on four different days. According
to the FDA guidelines [44] and AFNOR NF V 03-110 [45], the acceptance criterion was set as concentration-dependent. Therefore, for
concentrations lower than 10 ppb, no limit was set, and for concentrations in the range of 10 ppb, an initial limit of ±35% was set
[44,45].
The measured concentrations of the non-homogenized matrices
injected on different days were compared with the values set forth
the in the FDA guidelines [44] and AFNOR NF V 03-110 [45] per
level of concentration. The critical difference was calculated based
on these values.
If the concentrations of NNN and NNK were below LOD or
standard 1, CD values could not be calculated (NNN and NNK in
the background matrix, NNK in the environmental aerosol of ecigarettes). The CD values for NNN in the environmental aerosol
of THS 2.2, the environmental aerosol of e-cigarettes, and ETS
were 0.162 ng/mL/0.0449 ng/m3 , 0.268 ng/mL/0.0744 ng/m3 , and
1.23 ng/mL/0.343 ng/m3 , respectively. For NNK, the CD values were
0.135 ng/mL/0.0374 ng/m3 in the environmental aerosol of THS 2.2
and 14.1 ng/mL/3.92 ng/m3 in ETS (Table S24).
3.2.5.3. Accuracy profiles. Validation of the TSNA method was
performed using the accuracy profile procedure [44–46]. This validation procedure was considered as the most appropriate to
evaluate the analytical method performance in each matrix under
investigation (background, environmental aerosol of THS 2.2 and
e-cigarettes, and ETS) per target compound.
The trueness (recovery) per level of spike was calculated and,
together with the intermediate precision and the tolerance interval,
was used to build the accuracy profiles per compound and matrix
[44–46]. The lower working range limit (LWRL) and upper working
range limit (UWRL) were calculated after evaluation of the obtained
accuracy profiles.
For the validation of NNN and NNK in the four matrices, the
-expectation tolerance intervals and the acceptance limits were
set at 80% and ± 25%, respectively. One graph was generated for
each target compound and matrix combining the corresponding
tolerance interval and acceptance limit.
On every graph, the ± 25% acceptance limits are represented by
horizontal, red, dotted lines. The trueness is represented by an
orange, small-striped line connecting the average percentage of
recovered concentration per spiking level, depicted by dots. The
uncertainty per spike level is presented by interval (black vertical
lines), and the two solid blue lines at both sides of the trueness are
the representation of the 80% -expectation tolerance limits. The
vertical, green-striped, dotted line indicates the cut point between
the 80% -expectation tolerance limits and the ± 25% acceptance
limits. This cutting point corresponds to the LWRL per compound
and matrix.
The average measured concentrations per matrix type (endogenous amount) are represented by green, square dots.
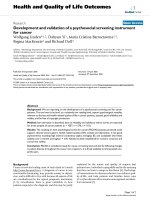
Fig. 2 presents the NNN accuracy profiles per matrix type and
Table 1 contains the data used to build the accuracy profiles.
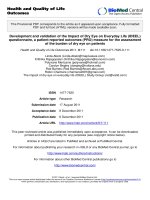
Fig. 3 presents the NNK accuracy profiles per matrix type and
Table 2 contains the data used to build the accuracy profiles.
The impact of the matrices (background, environmental
aerosols of THS 2.2 and e-cigarettes, and ETS) on the performance of
the methods was negligible, as similar performances (e.g., comparable -tolerance intervals and a lack of bias) between all matrices
were observed.
3.2.5.4. Working range limits. The LWRL and UWRL for the two target compounds in each matrix were determined using the accuracy
profiles. In all cases, the LWRL was defined by the intersection point
between the -tolerance interval and the acceptance limits [46].
At higher concentrations (spiking levels 4–6), the -tolerance
interval remained between the acceptance limits for all four matrices. Therefore, the UWRL was defined as the highest calibration
level fulfilling the criteria for linearity of the response function
(60.2 ng/mL for NNN and 60.6 ng/mL for NNK, see section 3.2.3).
96
M. Gómez Lueso et al. / J. Chromatogr. A 1580 (2018) 90–99
Table 2
Data used to build the accuracy profiles for NNK.
Matrix1
BKG
EA of THS2.2
ETS
EA fo e-cig
1
Spiking level
Level 1
Level 2
Level 3
Level 4
Level 5
Level 6
Level 1
Level 2
Level 3
Level 4
Level 5
Level 6
Level 1
Level 2
Level 3
Level 4
Level 5
Level 6
Level 1
Level 2
Level 3
Level 4
Level 5
Level 6
Spiking concentration
[g/mL]
Trueness values per series
0.230
0.517
0.889
1.67
3.43
5.00
0.230
0.517
0.889
1.67
3.43
5.00
0.995
1.989
4.975
8.01
16.03
30.28
0.230
0.517
0.889
1.67
3.43
5.00
1
2
3
4
Average
127
107
119
114
110
108
110
86
106
105
104
104
131
66
106
95
105
98
122
123
113
104
96
102
89
92
90
110
105
105
87
94
91
101
98
97
169
129
103
104
107
102
129
121
111
103
99
104
163
142
126
112
109
106
110
121
110
96
98
101
59
127
79
95
90
92
112
87
93
115
107
105
121
104
100
104
101
103
76
92
87
92
94
97
163
166
113
92
99
99
92
104
109
95
93
95
125
111
109
110
106
106
96
98
99
98
99
99
130
122
100
96
101
98
114
109
107
104
99
101
CVr
CVR
7
6
7
3
2
2
11
6
5
2
3
2
42
13
8
7
5
3
21
17
12
3
3
2
31
22
18
5
4
3
20
16
12
6
5
4
62
43
16
8
9
5
25
22
14
9
7
5
80% Tolerance Interval
Lower limit
Upper limit
70
72
78
102
99
102
64
70
78
88
91
93
34
47
73
86
86
90
79
76
87
90
88
93
180
150
139
118
113
110
127
126
119
109
106
106
226
198
127
107
115
106
149
141
127
119
110
109
BKG: Background, EA: Environmental Aerosol, ETS: Environmental Tobacco Smoke.
Table 3
Lower Working Range Limits (LWRL) and Upper Working Range Limits (UWRL) for
NNN and NNK.
Matrix1
BKG
EA of THS2.2
ETS
EA of e-cig
Min
Max
Target
compound
NNN
NNK
NNN
NNK
NNN
NNK
NNN
NNK
NNN
NNK
LWRL2
UWRL2
3
ng/mL
ng/m
ng/mL
ng/m3
0.919
1.30
1.16
0.702
1.37
5.24
0.453
0.994
0.453
0.702
0.255
0.362
0.322
0.195
0.379
1.46
0.126
0.276
0.126
0.195
60.2
60.6
60.2
60.6
60.2
60.6
60.2
60.6
60.2
60.6
16.7
16.8
16.7
16.8
16.7
16.8
16.7
16.8
16.7
16.8
1
BKG: Background, EA: Environmental Aerosol, ETS: Environmental Tobacco
Smoke.
2
Conversion from ng/mL to ng/m3 using 1.5 L/min sampling flow-rate and four
hours of collection (0.36 m3 ), and final solution volume of 0.1 mL.
The LWRL for NNN in the background matrix, the environmental
aerosol of THS 2.2, the environmental aerosol of e-cigarettes, and
ETS were 0.919 ng/mL, 1.16 ng/mL, 0.453 ng/mL, and 1.37 ng/mL,
respectively. For NNK, LWRL was 1.30 ng/mL in background,
0.702 ng/mL in the environmental aerosol of THS 2.2, 0.994 ng/mL
in the environmental aerosol of e-cigarettes, and 5.24 ng/mL in ETS.
Table 3 presents the LWRL and UWRL for the two target compounds in the four matrices under investigation.
3.3. Application of the quantification method
NNN and NNK have attracted considerable research interest
due to their demonstrated carcinogenicity in animal models and
their assumed contribution to the overall carcinogenic potential
of tobacco smoke [2,46–48]. The World Health Organization study
group on Tobacco Product Regulation has identified NNN and NNK
as two of the nine priority smoke components of regulatory interest [49]. In view of this, the use of a sensitive and accurate method
for the measurement of these compounds is of key importance.
NNN and NNK are emitted at the same concentrations as in
mainstream smoke or even at two to four times higher concentrations in cigarette sidestream smoke, which is the predominant
component of ETS [11]. According to published data, 84%–97%
of NNN and 63%–84% of NNK present in mainstream smoke
of cigarettes are retained in the lungs of the consumers [50].
The environmental aerosols of heat-not-burn products and ecigarettes have different origin and characteristics compared with
ETS, because by design, these products do not have a smoldering tip
releasing sidestream smoke resulting from combustion of organic
material. The main component of their environmental aerosols is
thus the exhaled breath of the users. Accordingly, considering the
high retention in the body of these compounds from mainstream
smoke, it is anticipated that air concentrations of NNN and NNK
will be very low following the use of heat-not-burn products and
e-cigarettes.
This newly developed and validated method was put into use
for the quantification of NNN and NNK in indoor air enriched with
surrogate environmental aerosols generated by smoking machines.
Thus, aged and diluted mainstream aerosols of heat-not-burn
products and e-cigarettes were released in the environmentally
controlled exposure room, while for cigarettes, aged and diluted
sidestream smoke was released. In such an experimental setup, the
environmental impact of heat-not-burn products and e-cigarettes
is overestimated.
In ETS samples, NNK and NNN were quantified during all the
sessions with values between the LWRL and the UWRL (NNN:
0.816 ng/m3 , NNK: 4.13 ng/m3 ) (Tables 4, S25).
Table 4 presents the average NNN and NNK matrix endogenous
content for homogenized and non-homogenized samples of the
four matrices under investigation.
The concentrations of NNN and NNK in indoor air during cigarette smoking were investigated in experimental rooms
[12,13,22,23,34] as well as in real-life conditions [12]. In experiments with cigarette smokers, the quantified indoor levels for NNN
ranged from not detected to 23 ng/m3 , and those for NNN ranged
from not detected up to 29 ng/m3 ; however, most of the values
measured were below 10 ng/m3 [12,13,22,23,34]. For example, in
M. Gómez Lueso et al. / J. Chromatogr. A 1580 (2018) 90–99
97
Table 4
Average content of NNN and NNK in Background, environmental aerosol of THS 2.2 and e-cigarette, and environmental tobacco smoke (smoking machine model).
Matrix1
BKG
EA of THS2.2
EA of e-cig
ETS
1
2
3
Average
STDEV
Average
STDEV
Average
STDEV
Average
STDEV
Average endogenous content
in homogenized matrix
Average endogenous content
in non- homogenized matrix
Average endogenous content
per matrix type (all values)
NNN
ng/m3
NNK
ng/m3
NNN
ng/m3
NNK
ng/m3
NNN
ng/m3
NNK
ng/m3
<0.01083
–
0.08492
0.0155
0.05572
0.0319
0.819
0.108
<0.01363
–
0.06832
0.0136
<0.01363
–
4.121
0.941
<0.01083
–
0.07922
0.0149
0.05702
0.0252
0.811
0.114
<0.01363
–
0.05932
0.0125
<0.01363
–
4.140
1.253
<0.01083
–
0.08302
0.0153
0.05612
0.0296
0.816
0.109
<0.01363
–
0.06532
0.0138
<0.01363
–
4.127
1.042
BKG: Background, EA: Environmental Aerosol, ETS: Environmental Tobacco Smoke.
Average values are between the LLOQ and the LWRL of the method, accuracy outside ±25% threshold.
Average values under LOD (the displayed value corresponds to the LOD).
Fig. 2. Accuracy profiles obtained for NNN in a) the background air sample, b) EA of
THS 2.2, c) EA of e-cig, and d) ETS of Marlboro Gold samples. Legend: average recovered concentration per spiking level (black circle), trueness expressed as recoveries
(orange spots line), upper and lower -expectation tolerance intervals (blue continuous lines), upper and lower acceptance limits set at 25% (red dashed lines), average
NNK nominal concentration (green square), LWRL (green vertical dashed line).
Fig. 3. Accuracy profiles obtained for NNK in a) the background air sample, b) EA of
THS 2.2, c) EA of e-cig, and d) ETS of Marlboro Gold samples. Legend: average recovered concentration per spiking level (black circle), trueness expressed as recoveries
(orange spots line), upper and lower -expectation tolerance intervals (blue continuous lines), upper and lower acceptance limits set at 25% (red dashed lines), average
NNK nominal concentration (green square), LWRL (green vertical dashed line).
98
M. Gómez Lueso et al. / J. Chromatogr. A 1580 (2018) 90–99
the experiments of Adlkofer et al. [22] run in a 45 m3 office for
eight to nine hours with a very high number of cigarettes to reach
CO concentrations of 20 ppm, the concentrations measured had
mean values of 4.5 ng/m3 and 7.5 ng/m3 . These data are in the same
range as our experiments and indicate representative experiments
in terms of number of sticks and ventilation conditions.
In our measurements of background air, unsurprisingly, neither NNN nor NNK were detected. The surrogate environmental
aerosol of THS 2.2, generated with a smoking machine to maximize the target compound concentrations, contained NNN and
NNK at estimated values of 0.0830 and 0.0653 ng/m3 , respectively
(Table 4). These concentrations corresponded to values between
the LLOQ and the LWRL, where the method does not have sufficient
accuracy, and significant uncertainty is associated with the quantifications. NNN and NNK are present in the low nanogram range in
the mainstream aerosol of THS 2.2 [37,51]. Therefore, when surrogate environmental aerosols of THS 2.2 are generated with smoking
machines, it could be expected that these would be detected or
quantified. Thus, if the experiments are run with panelists instead
of using machine smoking, considering the high rate of retention in
the body of NNN and NNK, even when applying a sensitive method,
it might be very difficult to detect NNN and NNK indoors when using
the THS 2.2.
In the case of the environmental aerosols of e-cigarettes, NNK
was detected on one single day with values between LOD and LLOQ.
In contrast, NNN was measured on all of the days, with estimated
concentrations at 0.0561 ng/m3 between the LLOQ and the LWRL
for three of the days and a single one at LOD < x < LLOQ.
It should be noted that the method presented here might well
be applicable not only to the quantification of NNN and NNK in air,
but also for the analyses of other airborne volatile nitrosamines.
Such application should be investigated in the future.
4. Conclusions
A sensitive and accurate method for the analysis of two TSNAs
(NNN and NNK) in indoor air was developed and validated. The
reduction of the steps during sample preparation as well as the
efficient concentration of the target compounds before the analysis
was achieved through a novel approach for the collection using silica sorbent cartridges with simplified posterior sample preparation.
The extracts were then analyzed by isotope dilution LC–MS/MS.
This procedure improved recoveries during the sample preparation compared with the conventional methods with trapping on
Cambridge filters. Furthermore lowering of the LOD and LLOQ by
one to two orders of magnitude compared to those of published
methods on analyses of TSNAs in air was achieved.
The accuracy profile procedure allowed assessment of the
method performance as a function of the matrices. The working
ranges of the method allowed quantification of the target analytes
with an accuracy of ±25% in the matrices under investigation.
The validation results demonstrated the fitness-for-purpose of
the method for prospective comparative assessments of the environmental aerosol of THS 2.2 and e-cigarettes as well as the ETS of
cigarettes.
Conflict of interest
All authors were employees of Philip Morris International.
Funding
Philip Morris International is the sole source of funding and
sponsor of this project.
Appendix A. Supplementary data
Supplementary data associated with this article can be found,
in the online version, at />037.
References
[1] S.S. Hecht, D. Hoffmann, Tobacco-specific nitrosamines, an important group
of carcinogens in tobacco and tobacco smoke, Carcinogenesis 9 (6) (1988)
875–884, />[2] S.S. Hecht, Biochemistry, biology, and carcinogenicity of tobacco-specific
N-nitrosamines, Chem. Res. Toxicol. 11 (6) (1998) 559–603, />10.1021/tx980005y.
[3] S. Fisher, B. Spiegelhalder, J. Eisenbarth, R. Preussmann, Investigations on the
origin of tobacco-specific nitrosamines in mainstream smoke of cigarettes,
Carcinogenesis 11 (5) (1990) 723–730, />723.
[4] S.S. Hecht, C.B. Chen, R.M. Ornaf, D. Hoffman, Chemical studies on tobacco
smoke LVI. Tobacco specific nitrosamines: origins: carcinogenicity and
metabolism, IARC Sci. Publ. 19 (1978) 395–413.
[5] Harmful and potentially harmful constituents in tobacco products and
tobacco smoke; established list., federal register 77 FR 20034, Food Drug Adm.
77 (64) (2012) 20034–20037 (Accessed 31 May 2018) https://www.
federalregister.gov/d/2012-7727.
[6] International Agency for Research on Cancer, IARC Monographs on the
Evaluation of Carcinogenic Risk to Humans. List of Classifications 1–120.
classif.php, 2018
(Accessed 31 May 2018).
[7] Centers for Disease Control and Prevention (US); 2010 Surgeon General’s
Report—How Tobacco Smoke Causes Disease: The Biology and Behavioral
Basis for Smoking-Attributable Disease, 3 Chemistry and Toxicology of
Cigarette Smoke and Biomarkers of Exposure and Harm. i.
nlm.nih.gov/books/NBK53014/ (Accessed 31 May 2018).
[8] S.C. Moldoveanu, M. Borgerding, Formation of tobacco specific nitrosamines
in mainstream cigarette smoke; part 1, FTC Smoking, Contrib. Tobacco Res. 23
(1) (2008) 19–31, />[9] G. Lang, A. Vuarnoz, Matrix-bound
4-(methylnitrosamino)-1-(3-pyridyl)-1-butanone in tobacco: quantification
and evidence for an origin from lignin-Incorporated alkaloids, J. Nat. Prod. 78
(1) (2014) 85–92, />[10] K.D. Brunnemann, B. Prokopczyk, M.V. Djordjevic, D. Hoffmann, Formation
and analysis of tobacco-specific N-nitrosamines, Crit. Rev. in Toxicol. 26 (2)
(1996) 121–137, />[11] R.A. Jenkins, M.R. Guerin, B.A. Tomkins, The Chemistry of Environmental
Tobacco Smoke: Composition and Measurements, second ed., CRC Press LLC,
Boca Raton, 2000.
[12] K.D. Brunnemann, J.E. Cox, D. Hoffmann, Analysis of tobacco-specific
N-nitrosamines in indoor air, Carcinogenesis 13 (12) (1992) 2415–2418,
/>[13] A.R. Tricker, M.K. Schorp, H.J. Urban, D. Leyden, H.W. Hagedorn, J. Engl, M.
Urban, K. Riedel, G. Gilch, D. Janket, G. Scherer, Comparison of environmental
tobacco smoke (ETS) concentrations generated by an electrically heated
cigarette smoking system and a conventional cigarette, Inhal. Toxicol. 21 (1)
(2009) 62–77, />[14] K.D. Brunnemann, D. Hoffmann, Analytical studies on tobacco-specific
N-nitrosamines in tobacco and tobacco smoke, Crit. Rev. Toxicol. 21 (4) (2008)
235–240, />[15] J.A. Mathis, P.Y. Yeung, TSNA Method Comparison Using UHPLC-MS/MS,
Poster from Global Laboratory Services Inc., Wilson, NC, TSRC (Toronto
Science Research Conference), 2009 />uhplc tsna.pdf.
[16] W. Wu, D.L. Ashley, C.H. Watson, Simultaneous determination of five
tobacco-specific nitrosamines in mainstream cigarette smoke by isotope
dilution liquid chromatography/electrospray ionization tandem mass
spectrometry, Anal. Chem. 75 (18) (2003) 4827–4832, />1021/ac030135y.
[17] K.A. Wagner, N.H. Finkel, J.E. Fossett, I.G. Gillman, Development of a
quantitative method for the analysis of tobacco-specific nitrosamines in
mainstream cigarette smoke using isotope dilution liquid
chromatography/electrospray ionization tandem mass spectrometry, Anal.
Chem. 77 (4) (2005) 1001–1006, />[18] J. Wu, P. Joza, M. Sharifi, W.S. Rickert, J.H. Lauterbach, Quantitative method for
the analysis of tobacco-specific nitrosamines in cigarette tobacco and
mainstream cigarette smoke by use of isotope dilution liquid
chromatography tandem mass spectrometry, Anal. Chem. 80 (4) (2008)
1341–1345, />[19] M. Intorp, S. Purkis, W. Wagstaff, Determination of tobacco specific
nitrosamines in cigarette mainstream smoke: the CORESTA 2011
collaborative study, Contrib. Tobacco Res. 25 (4) (2011) 2012, .
org/10.2478/cttr-2013-0926.
[20] D. Hoffmann, J.D. Adams, K.D. Brunnemann, S.S. Hecht, Assessment of
tobacco-specific N-nitrosamines in tobacco products, Cancer Res. 39 (7)
(1979) 2505–2509.
M. Gómez Lueso et al. / J. Chromatogr. A 1580 (2018) 90–99
[21] ISO 19290:2016: Cigarettes–Determination of Tobacco Specific Nitrosamines
in Mainstream Cigarette Smoke by LC-MS/MS. International Organization for
Standardization, 2016.
[22] F. Adlkofer, G. Scherer, C. Conze, J. Angerer, G. Lehnert, Significance of
exposure to benzen and other toxic compounds through environmental
tobacco smoke, J. Cancer Res. Clin. Oncol. 116 (6) (1990) 591–598, http://dx.
doi.org/10.1007/BF01637079.
[23] H. Klus, H. Begutter, G. Scherer, A.R. Tricker, F. Adlkofer, Tobacco-specific and
volatile N-nitrosamines in environmental tobacco smoke of offices, Indoor
Environ. 1 (6) (1992) 348–350, />1420326x9200100606.
[24] G. O’Connell, S. Colard, X. Cahours, J.D. Pritchard, An assessment of indoor air
quality before, during and after unrestricted use of E-cigarettes in a small
room, Int. J. Environ. Res. Public Health 12 (2015) 4889–4907, .
org/10.3390/ijerph120504889.
[25] J. Czogala, M.L. Goniewicz, B. Fidelus, W. Zielinska-Danch, M.J. Travers, A.
Sobczak, Secondhand exposure to vapors from electronic cigarettes, Nicotine.
Tob. Res. 16 (6) (2014) 655–662, />[26] O. Geiss, I. Bianchi, F. Barahona, J. Barrero-Moreno, Characterization of
mainstream and passive vapours emitted by selected electronic cigarettes,
Int. J. Hyg. Environ. Health 218 (2015) 169–180, />ijheh.2014.10.001.
[27] J. Liu, Q. Liang, M.J. Oldham, A.A. Rostami, K.A. Wagner, I.G. Gillman, P. Patel, R.
Savioz, M. Sarkar, Determination of selected chemical levels in room air and
on surfaces after the use of cartridge- and tank-based e-vapor products or
conventional cigarettes, Int. J. Environ. Res. Public Health 14 (9) (2017) 969,
/>[28] T.R. McAuley, P.K. Hopke, J. Zhao, S. Babaian, Comparison of the effects of
e-cigarette vapor and cigarette smoke on indoor air quality, Inhal. Toxicol. 24
(12) (2012) 850–857, />[29] W. Schober, K. Szendrei, W. Matzen, H. Osiander-Fuchs, D. Heitmann, R.A.
Th.Schettgen, H. Fromme Joerres, Use of electronic cigarettes (e-cigarettes)
impairs indoor air quality and increases FeNO levels of e-cigarette consumers,
Int. J. Hyg. Environ. Health 217 (2014) 628–637, />ijheh.2013.11.003.
[30] T. Schripp, D. Markewitz, E. Uhde, T. Salthammer, Does e-cigarette
consumption cause passive vaping? Indoor Air 23 (2013) 25–31, .
org/10.1111/j.1600-0668.2012.00792.x.
[31] N. Mottier, M. Tharin, C. Cluse, J.-R. Crudo, M. Gómez Lueso, C.G.
Goujon-Ginglinger, A. Jaquier, M.I. Mitova, E.G.-R. Rouget, M. Schaller, J.
Solioz, Validation of selected analytical methods using accuracy profiles to
assess the impact of a Tobacco Heating System on indoor air quality, Talanta
158 (2016) 165–178, />[32] M.I. Mitova, P.B. Campelos, C.G. Goujon-Ginglinger, S. Maeder, N. Mottier,
E.G.R. Rouget, M. Tharin, A.R. Tricker, Comparison of the impact of the Tobacco
Heating System 2.2 and a cigarette on indoor air quality, Regul. Toxicol.
Pharmacol. 80 (2016) 91–101, />[33] A.A. Ruprecht, C. De Marco, A. Saffari, P. Pozzi, R. Mazza, C. Veronese, G.
Angellotti, E. Munarini, A.C. Ogliari, D. Westerdahl, S. Hasheminassab, M.M.
Shafer, J.J. Schauer, J. Repace, C. Sioutas, R. Boffi, Environmental pollution and
emission factors of electronic cigarettes, heat-not-burn tobacco products, and
conventional cigarettes, Aerosol Sci. Technol. 51 (6) (2017) 674–684, http://
dx.doi.org/10.1080/02786826.2017.1300231.
[34] M. Forster, J. McAughey, K. Prasad, E. Mavropoulou, C. Proctor, Assessment of
tobacco heating product THP1. 0. Part 4: Characterization of indoor air quality
and odour, Regul. Toxicol. Pharmacol. 93 (2018) 34–51, />1016/j.yrtph.2017.09.017.
[35] RIVM, RIVM Report 2016-0036, The health risks of e-cigarettes for bystanders,
W., Visser, L., Geraets, P., Bos, R., Ramlal, P., Fokkens, W., Klerx, H., Cremers, P.,
Schwillens, R. Talhout, and publications/
Scientific/Reports/2016/juli/The health risks of e cigarettes to bystanders,
2016.
99
[36] K.A. Moon, H. Magid, C. Torrey, A.M. Rule, J. Ferguson, J. Susan, Z. Sun, S.
Abubaker, V. Levshin, A. C¸arkoglu, G.N. Radwan, M. El-Rabbat, J. Cohen, P.
Strickland, A. Navas-Acien, P.N. Breysse, Secondhand smoke in waterpipe
tobacco venues in Istanbul, Moscow, and Cairo, Environ. Res. 142 (2015)
568–574, />[37] J.P. Schaller, D. Keller, L. Poget, P. Pratte, E. Kaelin, D. McHugh, G. Cudazzo, D.
Smart, A.R. Tricker, L. Gautier, M. Yerly, R. Reis Pires, S. Le Bouhellec, D. Ghosh,
I. Hofer, E. Garcia, P. Vanscheeuwijck, S. Maeder Evaluation of the Tobacco
Heating System 2.2. Part 2: chemical composition, genotoxicity, cytotoxicity,
and physical properties of the aerosol, Regul. Toxicol. and Pharmacol., 81, (2),
(2016), s27–s47, 10.1016/j.yrtph.2016.10.001.
[38] M.L. Goniewicz, J. Knysak, M. Gawron, L. Kosmider, A. Sobczak, J. Kurek, A.
Prokopòwicz, M. Jablonska-Czapla, C. Rosik-Dulewska, C. Havel, P. Jacob III, N.
Benowitz, Levels of selected carcinogens and toxicants in vapour from
electronic cigarettes, Tob. Control 23 (2) (2014) 133–139, />10.1136/tobaccocontrol-2012-050859.
[39] M.R. Smith, B. Clark, F. Luedicke, J.P. Schaller, P. Vanscheeuwijck, J. Hoeng, M.C.
Peitsch, Evaluation of the Tobacco Heating System 2. 2. Part 1: Description of
the system and the scientific assessment program, Regul. Toxicol. Pharmacol.
81 (2) (2016) s17–s26, />[40] EN 15251–2007: Indoor environmental input parameters for design and
assessment of energy performance of buildings addressing indoor air quality,
thermal environment, lighting and acoustics, Comité Européen de
Normalisation, 2007.
[41] Health Canada Method: Method T-115. Determination of “Tar, Nicotine and
Carbon Monoxide in Mainstream Tobacco Smoke, Health Canada, Ottawa,
1999.
[42] CORESTA, Reference Method 81:Routine Analytical Machine for E-cigarette
Aerosol Generation Collection − Definitions Standard Conditions, CORESTA,
2015.
[43] J.M. Daisey, Tracers for assessing exposure to environmental tobacco smoke:
what are they tracing? Environ. Health Perspect. 107 (2) (1999) 319–327,
/>[44] FDA, Guidelines for the validation of chemical methods for the FDA FVM
Program, 2nd Ed., />FieldScience/UCM273418.pdf, 2015 (Accessed 31 May 2018).
[45] AFNOR, NF V03-110: Analyse des produits agricoles et alimentaires −
Protocole de caractérisation en vue de la validation d’une méthode d’analyse
quantitative par construction du profil d’exactitude AFNOR 2010.
[46] M. Feinberg, Validation of analytical methods based on accuracy profiles, J.
Chromatogr. A, 1158, (1–2), (2007), 174–183, 10.1016/j.chroma.2007.02.021.
[47] Some Tobacco-specific N-Nitrosamines, in: IARC Monograph on the
evaluation of carcinogenic risks to Humans; 89, Smokeless Tobacco and Some
Tobacco-specific N-Nitrosamines. IARC, Lyon, 2007, pp. 419–592. https://
monographs.iarc.fr/wp-content/uploads/2018/06/mono89.pdf.
[48] S.S. Hecht, Progress and challenges in selected areas of tobacco carcinogenesis,
Chem. Res. Toxicol. 21 (2008) 160–171, />[49] World Health Organization: The scientific basis of tobacco product regulation,
Second Report of a WHO Study Group (TobReg), WHO Technical Report Series
951, interaction/tobreg/publications/
9789241209519.pdf, 2008 (Accessed 31 May 2018).
[50] F.K. St. Charles, J. McAughey, C.J. Shepperd, Methodologies for the
quantitative estimation of toxicant dose to cigarette smokers using physical,
chemical and bioanalytical data, Inhal. Toxicol. 25 (2013) 383–397, http://dx.
doi.org/10.3109/08958378.2013.794177.
[51] J.P. Schaller, J.P.M. Pijnenburg, A. Ajithkumar, A.R. Tricker, Evaluation of the
Tobacco Heating System 2. 2. Part 3: influence of the tobacco blend on the
formation of harmful and potentially harmful constituents of the Tobacco
Heating System 2. 2 aerosol, Regul. Toxicol. Pharmacol. 8 (2) (2016) s48–s58,
/>