Factorization of preparative protein chromatograms with hard-constraint multivariate curve resolution and second-derivative pretreatment
Bạn đang xem bản rút gọn của tài liệu. Xem và tải ngay bản đầy đủ của tài liệu tại đây (1.81 MB, 9 trang )
Journal of Chromatography A, 1585 (2019) 152–160
Contents lists available at ScienceDirect
Journal of Chromatography A
journal homepage: www.elsevier.com/locate/chroma
Factorization of preparative protein chromatograms with
hard-constraint multivariate curve resolution and second-derivative
pretreatment
Matthias Rüdt, Sebastian Andris, Robin Schiemer, Jürgen Hubbuch ∗
Institute of Engineering in Life Sciences, Section IV: Biomolecular Separation Engineering, Karlsruhe Institute of Technology, Fritz-Haber-Weg 2, 76131
Karlsruhe, Germany
a r t i c l e
i n f o
Article history:
Received 10 September 2018
Received in revised form
21 November 2018
Accepted 23 November 2018
Available online 26 November 2018
Keywords:
Chromatography
Process analytical technology
UV–vis spectroscopy
Chemometrics
Biopharmaceuticals
Multivariate curve resolution
a b s t r a c t
Current biopharmaceutical production heavily relies on chromatography for protein purification.
Recently, research has intensified towards finding suitable solutions to monitoring the chromatographic
steps by multivariate spectroscopic sensors. Here, hard-constraint multivariate curve resolution (MCR)
was investigated as a calibration-free method for factorizing bilinear preparative protein chromatograms
into concentrations and spectra. Protein elutions were assumed to follow exponentially modified Gaussian (EMG) curves. In three case studies, MCR was applied to chromatograms of second-derivative
ultraviolet and visible (UV–vis) spectra. The three case studies consisted of the separation of a ternary mixture (ribonuclease A, cytochrome c, and lysozyme), multiple binary chromatography runs of cytochrome c
and lysozyme, and the separation of an antibody–drug conjugate (ADC) from unconjugated immunoglobulin G (IgG). In all case studies, good estimates of the elution curves were obtained. R2 values compared
to off-line analytics exceeded 0.90. The estimated spectra allowed for protein identification based on a
protein spectral library. In summary, MCR was shown to be well able to factorize protein chromatograms
without prior calibration. The method may thus substantially simplify analysis of multivariate protein
chromatograms with multiple co-eluting species. It may be especially useful in process development.
© 2018 The Authors. Published by Elsevier B.V. This is an open access article under the CC BY-NC-ND
license ( />
1. Introduction
In modern biopharmaceutical protein purification, preparative chromatography is the method of choice for capturing and
polishing steps [1]. Chromatography is popular because it can
simultaneously deliver high purity and high yield. To achieve the
necessary performance, chromatographic steps need to be welldesigned. Already slight process changes can influence the quality
profile of the product [2]. The situation is further complicated due to
the necessity of complex off-line analytical methods for assessing
the quality of biopharmaceuticals. As a means to improve process monitoring, control and understanding in development and
production, process analytical technology (PAT) has raised a lot
of interest [3–7]. The goal of PAT is to develop and implement
sensors which allow for (near) real-time monitoring of quality
attributes. Most frequently, on-line and at-line high performance
liquid chromatography (HPLC) has been used for different appli-
∗ Corresponding author.
E-mail address: (J. Hubbuch).
cations including the monitoring of capture and polishing steps
[8–13].
Recently, spectroscopic approaches in combination with multivariate data analysis (MVDA) for the retrieval of overlapping peaks
have become more popular [7]. Spectroscopic methods are often
non-invasive, fast, and robust [3]. They have been used for the selective in-situ quantification of proteins in multi-well plates [14,15]
and selective in-line quantification in preparative chromatography [7,16–19]. These applications have in common that they use
spectroscopic data and partial-least squares (PLS) modeling for
selective protein quantification. As PLS regression generates correlative models, a calibration has to be performed prior to application.
Furthermore, the model may be susceptible to degeneration and
needs to be tested regularly.
As an alternative method for evaluating spectra, MCR has been
widely discussed [20–22]. MCR maximizes the explained variance
of factors while physically or chemically meaningful constraints
are imposed on the behavior of the pure components. Predominantly employed in analytical chemistry, the evolution of MCR is
still ongoing, regarding both theory and application [21]. Nevertheless, it has already been used for the resolution of complex chemical
/>0021-9673/© 2018 The Authors. Published by Elsevier B.V. This is an open access article under the CC BY-NC-ND license ( />0/).
M. Rüdt et al. / J. Chromatogr. A 1585 (2019) 152–160
mixtures since the 1980s [23,24]. Since then, different algorithms
have been developed for various applications [21]. Regarding the
application of MCR for the resolution of protein chromatograms,
literature is scarce. Compared to small molecules, different protein spectra exhibit a lower degree of variability [15], which makes
resolution more challenging. Additionally, observed ‘pure’ protein spectra are often combinations of multiple heterogeneities.
During a chromatographic elution, these heterogeneities may be
separated resulting in a variation of the spectra even for ‘pure’
components. Vandeginste et al. published a method for threecomponent curve resolution of proteins in 1985 [25]. More recently,
a hybrid-MCR algorithm was shown to be able to determine accurate retention times of simulated size-exclusion chromatography
(SEC) chromatograms for up to four co-eluting proteins [26]. Due
to the interesting findings of the above study and the efforts necessary for calibrating a statistical model, a further evaluation of MCR
for preparative protein chromatography is of interest.
In this study, we investigated the factorization of UV–vis spectral data from preparative protein chromatography. To increase
spectral differences of proteins, second derivative spectral pretreatment was applied. The obtained spectra were analyzed by an
EMG-constrained MCR algorithm. The factorization was based on
the pure component decomposition (PCD) algorithm originally proposed by Neymeyr et al. [27]. In a first case study, three model
proteins (ribonuclease A, cytochrome c, and lysozyme) were separated by cation-exchange chromatography (CEX). A second case
study factorized an augmented data matrix from multiple binary
elutions of the model proteins cytochrome c and lysozyme. A
third case study monitored the separation of a surrogate ADC from
its unconjugated IgG by hydrophobic-interaction chromatography
(HIC). In all case studies, the estimated concentration profiles were
compared to off-line analytics. The estimated spectra of the three
case studies were compared to a protein spectral library.
2. Theory
2.1. MCR by PCD
Considering a spectroscopic transmission measurement, the
absorbance generally follows the Lambert–Beer law. For a multiwavelength and multi-component case, it reads:
A = CS T + E,
(1)
where A ∈ Rn×m is the absorbance matrix, C ∈ Rn×o is the concentration matrix, S ∈ Rm×o is the spectral matrix, and E ∈ Rn×m is
the residual matrix. n, m, and o refer to the number of samples, the
number of wavelengths, and the number of species, respectively.
The goal of MCR is to retrieve approximate C and S from A under
certain constraints such as the chromatographic elution profile. As
proposed by Sawall et al. [28], this can be formulated by adapting
the PCD algorithm [27] as a minimization problem of the function
F(C, S, p) =
||A − CS T ||2F
+ fhard (C, S, p).
an easy-to-compute matrix factorization scheme such as singular
value decomposition (SVD) [29,27,28] or principal component analysis (PCA) [30]. SVD factorizes the original absorbance matrix into
∈ Rn×m , and V ∈ Rm×m according to
the matrices U ∈ Rn×n ,
A = U VT.
(3)
is a rectangular diagonal
U and V are orthonormal matrices.
matrix with the singular values si on the diagonal. The entries are
ordered according to their magnitude, i.e. s1 ≥ s2 ≥ · · · ≥0. The original matrix A can now be low-rank approximated with only a small
number of q singular values ˜ = (1 : q, 1 : q) and singular vectors
˜ = U(:, 1 : q), V˜ = V (:, 1 : q). The number of included factors needs
U
to be evaluated depending on the experiment. Often, q is equal to
the number of species in the mixture o. Importantly, the low-rank
approximation by SVD captures the maximum possible amount of
variance from A with the given number of factors q.
The concentration matrix C and spectral matrix S can now be
approximated as a rotation of the singular vectors by T ∈ Ro×q .
˜ =U
˜ ˜ V˜ T = U
˜ ˜ T −1 T V˜ T
A
=C
(4)
=S T
T−1
denotes the matrix inverse. If o =
/ q, T−1 is replaced by pseudo
+
inverse T . Neymeyr et al. proved that a perfect reconstruction of C
and S in Eq. (4) is possible in the absence of noise [27]. The objective
function is now reformulated to
˜ ˜ T −1 , V˜ T T , p).
G(T, p) = F(U
(5)
Through the low-rank approximation of A, the matrix factorization
problem is thus simplified to estimating o × q rotational parameters
and p.
2.2. Formulation of the EMG hard constraint
It is worth noting that Eq. (1) and the Frobenius norm in Eqs. (2)
and (5) do not take into account any time correlation of the concentration. Thus, any intended time correlation needs to be captured
by fhard (C, S, p). In chromatography, the elution of different components is often empirically described as EMG curves [1]. An EMG
describes a Gaussian peak convoluted with a continuously stirred
tank reactor. It is selected as a hard constraint on the columns of C. A
similar approach was recently taken by Arase et al. who factorized
analytical chromatograms of small molecules by MCR with a bidirectional EMG constraint [31]. In this work, the EMG computation
c(t;h, , , ) proposed by Kalambet et al. is used [32].
⎧
⎪
h·
⎪
⎪
⎪
⎪
⎪
⎪
⎪
⎨
h·
c(t; h, , , )=
(2)
The first part on the right-hand side consists of the squared Frobenius matrix norm of the residual matrix E. It thus describes the
deviation of the product of the computed matrices C and S from the
absorbance data. For a good solution, the Frobenius norm should
be close to zero. The second part fhard (C, S, p) defines an error term
for additional hard constraints which are discussed in Section 2.2.
p are the parameters for the hard constraints. For the current application, fhard (C, S, p) was multiplied by a weighting factor = 100 to
penalize deviations from the hard constraints strongly [28].
Estimating C and S can be difficult, as both matrices may contain
a large number of entries. It was previously proposed to retrieve
estimates of C and S by rotating a limited number of factors from
153
·
2
·
⎪
⎪
⎪
⎪
exp
⎪
⎪
⎪
⎪
⎩ h·
2
−
1+
(
(
−t
· exp
−
· exp
− )
2 2
− t) ·
(
+
− t)
2 2
2
2
2
· erfc(z), if z ≤ 0,
2
· erfcx(z),
if 0 < z≤6.71 · 107 ,
2
,
else,
2
(6)
1
z= √
2
−t
+
.
(7)
and
Here, t refers to the time. h is a scaling factor of the EMG.
denote the mean value and standard deviation of a Gaussian
peak before convolution. is the decay constant of the continuously
stirred tank reactor. Additionally, fronting can be implemented by
reflecting t at
for negative , i.e. tˆ = 2 − t and c(tˆ; , , − ) if
< 0.
154
M. Rüdt et al. / J. Chromatogr. A 1585 (2019) 152–160
Table 1
All proteins used for this study are listed with their respective manufacturers.
Protein
Manufacturer
Ribonuclease A from bovine pancreas
Cytochrome c from bovine heart
Lysozyme from chicken egg
IgG1
IgG2
Ovomucoid
Bovine serum albumin
apo-Transferrin human
Myoglobin from equine skeletal muscle
Glucose oxidase from aspergillus niger
Sigma Aldricha
Sigma Aldrich
Sigma Aldrich
MedImmuneb
Lek Pharmaceuticalsc
Sigma Aldrich
Sigma Aldrich
Sigma Aldrich
Sigma Aldrich
Sigma Aldrich
a
b
c
St. Louis, USA.
Gaithersburg, USA.
Ljubljana, SL.
For each species, an EMG peak shape is now included as a hard
constraint in fhard (C, A, p) and evaluated at every measured time
point tj of the absorbance matrix.
n
o
fhard (C, A, p) =
Cij − c (ti ; p(:, j))
2
,
(8)
i=1 j=1
where p is the parameter matrix containing 4 × o entries. As the
EMG is positive for h > 0, a constraint on C ≥ 0 is implicitly set. Due to
the application to second derivative spectra, the spectral matrix S is
not ≥0 but may also have negative entries. As a result, no constraint
on the positivity of the spectral matrix must be set.
The objective function G(T, p) can now be solved with a deterministic numerical solver. We used a quasi-Newton approach as
implemented in MATLAB (version 2016a, The Mathworks, Naticks,
USA). For our purposes, the optimization is split into multiple substages. First, only p is released for optimization. Next, T is optimized
for the estimated p. After convergence, the EMG scaling factors
h are multiplied into the rotational matrix T. Finally, all remaining parameters are released for optimization until convergence is
achieved. The staged approach helps to prevent the solver from
diverging.
3. Materials and methods
3.1. Proteins and buffers
In Table 1, the proteins used in this paper, and their respective manufacturer are listed. All protein solutions and buffers were
produced with Ultrapure Water (PURELAB Ultra, ELGA LabWater,
Veolia Water Technologies, Saint-Maurice, France). After thorough
mixing, the buffers were pH-adjusted with HCl, filtrated with cellulose acetate filters with a pore size of 0.2 m (Sartorius, Göttingen,
Germany), and degassed by sonification.
3.2. Preparative chromatographic instrumentation
The preparative chromatographic runs were performed using a
custom-made experimental setup consisting of a conventional liquid chromatography system and a diode array detector (DAD). The
liquid chromatography system was an ÄKTA purifier 10 equipped
with pump P-900, sample pump P-960, UV monitor UV-900 (10 mm
optical path length), conductivity monitor C-900, pH monitor pH900, autosampler A-905, and fraction collector Frac-950. The liquid
chromatography system was controlled with UNICORN 5.31 (all GE
Healthcare, Chalfont, St. Giles, UK). In order to obtain in-line UV–vis
absorption spectra, an UltiMate DAD3000 was added to the flow
path downstream of the column. The DAD was equipped with a
semi-preparative flow cell (0.4 mm optical pathlength) except for
the ADC separation where an analytical flow cell (10 mm optical
path length) was used. The DAD was controlled with Chromeleon
6.80 (all Thermo Fisher Scientific, Waltham, USA). The data acquisition of the DAD was triggered by custom-made software written
in MATLAB and Visual Basic for Applications (VBA, Microsoft, Redmond, USA). A detailed description can be found in [16].
3.3. Analytical chromatographic instrumentation
As reference analytics, analytical chromatography was performed with the collected fractions, using a Dionex UltiMate 3000
liquid chromatography system. The system was composed of a
HPG-3400RS pump, a WPS-3000TFC analytical autosampler, a TCC3000RS column thermostat, and a DAD3000RS detector. The system
was controlled by Chromeleon 6.80 (all Thermo Fisher Scientific).
3.4. Preparative CEX chromatography
Five CEX runs were performed with a 1 ml MediaScout
MiniChrom column (Atoll, Weingarten, Germany) with dimensions
5 mm × 50 mm prepacked with SP Sepharose FF (GE Healthcare).
First, the column was equilibrated (20 mM sodium phosphate
[Sigma Aldrich], pH 7.0) and then loaded with 500 mg of each
protein used in the run (injection volume 100 L). Elution was
performed with a linear gradient from 0% to 100% elution buffer
(20 mM sodium phosphate, 500 mM sodium chloride [Merck,
Darmstadt, Germany], pH 7.0). During all runs, the flow rate was
0.2 mL/min, and 200 L fractions were collected. Spectra were
acquired in the range from 240 nm to 310 nm. Four runs were
executed with a two-component mixture of cytochrome c and
lysozyme. Gradients were run in 1 CV, 3 CV, 5 CV, and 7 CV. Additionally, a 3 CV run with a three-component system consisting of
lysozyme, cytochrome c, and ribonuclease A was carried out.
3.4.1. Analytical chromatography
The fractions from preparative CEX chromatography were analyzed by analytical CEX chromatography on a Proswift SCX-1S
4.6 mm × 50 mm column (Thermo Fisher Scientific). A flow rate of
1.5 mL/min was used during the whole run. For each sample, the
column was first equilibrated for 2.5 min with load buffer (20 mM
TRIS [Merck, Darmstadt, Germany], pH 8.0). Next, 20 L of sample was injected into the system and washed for 0.5 min with load
buffer. A bilinear gradient was performed during the next 4 min
with 0% to 10% (2 min) and 10% to 100% elution buffer (20 mM TRIS,
700 mM sodium chloride [Merck], pH 8.0). Finally, the column was
stripped for 0.5 min with 100% elution buffer.
3.5. Preparative HIC of a surrogate ADC
The load for the preparative HIC step was produced by
the conjugation reaction of a surrogate drug (7-diethylamino3-(4 -maleimidylphenyl)-4-methylcoumarin) with an IgG1. The
resulting surrogate ADC had similar characteristics regarding structure and hydrophobicity to normal ADCs, however lacked their
toxicity. The load was prepared by mixing IgG 1 with surrogate
ADC to a final concentration of 2 g L−1 for each component.
A 1 mL Toyoscreen 650M Phenyl column was purchased from
Tosoh (Tokyo, Japan). For the preparative chromatographic run, the
flow rate was set to 0.2 mL/min. The column was equilibrated for
5 mL with 25 mM sodium phosphate and 1 M ammonium sulfate at
pH 7.0. 100 L of the load were injected and washed for 2 mL. Subsequently, a 15 mL linear gradient was performed with the elution
buffer (18.75 mM phosphate, pH 7.0, 25% (V/V) 2-propanol) from
20% to 70%. The column was stripped with 8 mL elution buffer. During the whole chromatographic separation, spectra were acquired
M. Rüdt et al. / J. Chromatogr. A 1585 (2019) 152–160
155
in the range from 250 nm to 450 nm. The eluent was collected in
200 L fractions in 96-well plates.
3.5.1. Analytical chromatography
Analytics were performed by reversed-phase chromatography
to quantify the ADCs as well as the unmodified IgG1 according to
the protocol. Reduction or different sample preparation were not
required. An Acquity UPLC Protein BEH C4 column (Waters Corpo˚ 1.7 m, 2.1 mm × 50 mm) was run at a
ration, Milford, USA; 300 A,
flow rate of 0.45 mL/min. The column oven was heated to 80 ◦ C.
Solvent A consisted of 0.1% triuorocetic acid (TFA) in ultrapure
water. Solvent B was 0.1% TFA in acetonitrile. After equilibration
and injection at 26% B, the fraction of B was raised to 30%. Next, a
4.8 min gradient from 30% B to 38% B was used for separation of
the conjugate species. The resulting chromatograms yielded peak
areas of unconjugated, mono-conjugated and di-conjugated monoclonal antibodies (mAbs). For the current application, all conjugated
species were summed.
3.6. UV–vis spectral library
For the spectral library, all proteins in Table 1 except the IgG1
and IgG2 were dissolved at 2.5 g L−1 in 20 mM sodium phosphate
buffer at pH 7.0. The IgG2 was provided as a virus-inactivated solution from a Protein A purification step. It was diluted in phosphate
buffer to 2.5 g L−1 . The IgG1 was not included in the spectral library.
Each entry in the spectral library was generated by injecting the
protein solutions with the autosampler and a 100 L sample loop
into the chromatography system at a flow rate of 0.2 mL/min. No
column was attached to the system. The samples were pumped
through the DAD resulting in chromatograms with EMG peak
shapes due to the system dispersion. To obtain spectra normalized
by mass, the chromatograms were integrated over time for each
wavelength i in MATLAB with a trapezoidal integration scheme,
multiplied by the flow rate u and normalized by the injected mass
m and optical pathlength l.
εref,
i
=
u
m·l
A i (t)dt
(9)
3.7. Data analysis
All data analysis was performed in MATLAB on a personal
computer equipped with a Core i5-4440 CPU at 3.10 GHz (Intel,
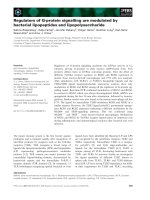
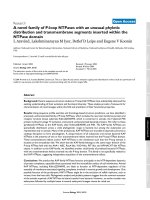
Fig. 1. Protein spectra from a spectral library are shown. The protein spectra are
relatively uniform with an absorption maximum around 280 nm. Differences are
visible on the shoulder of the absorption bands and in the through-to-peak distance
between 250 nm and 280 nm.
Santa Clara, USA). The optimization problem was implemented as
described in Section 2. Second derivatives were taken of the spectroscopic data with a second-order Savitzky-Golay filter [33] with
a 7-point window width. The resulting absorbance matrix A was
used for MCR.
4. Results and discussion
In this publication, the factorization of multivariate UV–vis data
from preparative protein chromatography by MCR was tested.
Instead of using the absorbance matrix directly for MCR, spectra
were first derived twice. This was done for two reasons: First, taking second derivatives of spectral data helps to remove baseline
offsets and measurement drifts [34]. Second, it is also a popular
technique in protein analytics to enhance the UV/Vis fine structure. Generally, protein UV–vis spectra are relatively uniform with
comparably little variation (see Fig. 1). Taking the second derivative
enhances spectral differences of proteins [35,36]. Contrary to the
original spectra, derived spectra contain positive as well as negative bands. Thus, no positivity constraint was set on the spectral
matrix S. The positivity of the concentration was enforced by the
EMGs. This approach was evaluated in three case studies.
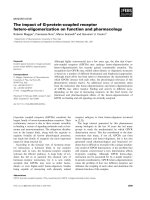
Fig. 2. Spectral changes during elution are illustrated for case study I. On the left side, the absorbance at 280 nm is shown. The absorbance trace is color-coded with the
normalized concentrations of ribonuclease A (green), cytochrome c (red), and lysozyme (blue). The spectra in corresponding colors are shown on the right side (top: original
spectra, bottom: second derivative spectra).
156
M. Rüdt et al. / J. Chromatogr. A 1585 (2019) 152–160
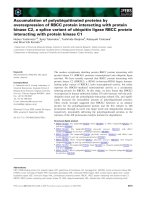
Fig. 3. SVD of the UV–vis spectral data of the first case study. The plots show the first four left singular vectors (left), the singular values (middle), and the first four right
singular vectors (right). The right singular vectors are offset to simplify interpretation. The vectors are colored according to their column numbers. Blue: first singular vector,
red: second singular vector, yellow: third singular vector, violet: fourth singular vector. It is worth noting that the extremes of the left singular vectors occurred during elution
of the proteins.
4.1. Analysis of a three-component protein chromatogram
Three model proteins (ribonuclease A, cytochrome c, and
lysozyme) were eluted from a CEX column with a 3 CV linear
gradient. In Fig. 2, the resulting absorbance at 280 nm is shown.
The normalized protein concentrations were color-coded into the
absorbance trace. In the same figure, the time-evolution of the
original and derived spectra is depicted. Compared to the original spectra, the second derivative spectra allow a distinction of the
different components based on spectral features. Furthermore, the
observed background drift could be reduced.
The second-derivative absorbance matrix A was subsequently
analyzed by SVD. In Fig. 3, the singular values
as well as the
first four left and right singular vectors (U and V) are shown. The
singular values showed an approximate exponential decay over the
first five points and flattened out for latter entries. The left and
right singular vectors one, two, and three only seemed to contain
little noise. However, the fourth left singular vector was offset from
zero over the whole elution, i.e. the fourth singular vectors contain
the baseline offset. The fourth right singular vector showed signs
of noise with high fluctuations between subsequent wavelengths.
Based on these observations, it was decided to use the first three
singular vectors for MCR.
For the deterministic optimization of the objective function, initial values were set for T as well as p. Fig. 3 shows that the first
singular vector followed the total protein concentration while vectors two and three contained information on the time evolution of
the spectral differences of the proteins. Consequently, the extremes
of the vectors coincided with the concentration maxima of the different components. Based on this argumentation, the initial MCR
parameters were set based on the SVD. The initial mean values 0
for the EMGs were selected based on the location of the extremes
of the left singular vectors. For the convergence of the algorithm,
it was of major importance to provide good initial values of the
peak location. The initial rotational matrix T0 was established by
inspecting the contribution of the left different singular vectors at
the different 0 . If the left singular vector contributed positively
at 0 , it was added and otherwise subtracted. To normalize the
magnitude of the contributions, each entry was multiplied by the
singular value. For the first case study, this resulted in the following
rotational matrix:
−s1
−s2
T0 = ( −s1
−s2
−s1
s2
s3
−s3 ).
(10)
s3
The initial standard deviations 0 and decay constants
set for all proteins to the values 10 and 1, respectively.
0
were
was
0
selected to be in the range of the peak widths observed in U. 0
was selected to initially yield an almost symmetric peak. With this
initial set of parameters, the optimization converged in less than
30 s.
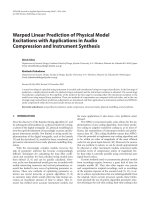
In Fig. 4, the optimized MCR results are shown. The estimated
maximal concentration location from MCR coincided well with the
results from off-line analytics. The good overall agreement between
MCR and off-line analytics was also reflected by the high R2 values. Based on normalized peak areas, values of 0.94, 0.93, and
0.92 were reached for ribonuclease A, cytochrome c and lysozyme,
respectively. Differences in the peak shape were visible especially
regarding peak tailing. As similar differences occurred for all eluted
proteins, the additional tailing in off-line analytics was explained
by the system dispersion between detector and fractionator.
In summary, for a single three-component run, the combination
of MCR with an EMG hard constraint and second derivative spectra
provided a good estimation of the elution profile of the different
protein components without prior calibration.
4.2. Simultaneous application to multiple chromatograms
Next, the PCD algorithm was tested for factorizing multiple
binary chromatograms simultaneously. To this end, the single chromatogram absorbance matrices were concatenated column-wise
¯
resulting in Asuper ∈ Rn×m
with n¯ =
n and ni being the number
i i
of measurements per run. For all subsequent analyses, Asuper was
used.
Similar to the evaluation of the ternary protein elution, Asuper
was first analyzed by SVD (Fig. 5). As expected for a binary mixture, the first two singular values were significantly larger than
the following. This was also reflected by the shape of the singular
vectors. The third left and right singular vectors already contained
a significant contribution of baseline drift and noise. Thus, MCR
was performed based on two singular vectors. The initial rotational
matrix was defined in the same manner as described above. As each
chromatography run was described by two EMGs and a total of
four runs were performed, a total of eight sets of EMG parameters
were necessary. Initial parameter assignment followed the same
reasoning as described for the ternary mixture.
After initialization, the optimization converged in a matter of
minutes to the final solution (Fig. 6). The peak-maxima locations
were again accurately determined by MCR. Similar to the separation of the ternary mixture, some deviations could be observed in
the peak height and tailing. This was again attributed to system
dispersion. Interestingly, the differences between off-line analytics and MCR estimation were more pronounced for steeper elution
gradients (see Fig. 6A and D). This supported the assumption that
the differences were caused by system dispersion. The steeper gradients resulted in quicker changes in protein concentrations which
M. Rüdt et al. / J. Chromatogr. A 1585 (2019) 152–160
157
Fig. 4. Chromatogram of the first case study as retrieved by MCR and compared to off-line analytics. The dashed red lines show the normalized concentration estimate from
the hard model. The solid black lines correspond to the rotated left singular vectors. The bars show the measured concentration by off-line analytics. Green: ribonuclease A,
red: cytochrome c, blue: lysozyme.
Fig. 5. SVD of the UV–vis spectral data of the second case study. The plots show the first three left singular vectors (left), the singular values (middle), and the first three
right singular vectors (right). The right singular vectors are offset to simplify interpretation. The vectors are colored according to their column numbers. Blue: first singular
vector, red: second singular vector, yellow: third singular vector.
Fig. 6. Chromatograms of the second case study as retrieved by MCR and compared to off-line analytics. The four plots show the different runs with varied gradient lengths.
A: 1 CV, B: 3 CV, C: 5 CV, D: 7 CV. The dashed red lines show the normalized concentration estimates from the hard model. The solid black lines correspond to the rotated left
singular vectors. The bars show the measured concentration by off-line analytics. Red: cytochrome c, blue: lysozyme.
158
M. Rüdt et al. / J. Chromatogr. A 1585 (2019) 152–160
Fig. 7. SVD of the UV–vis spectral data of the third case study. The plots show the first three left singular vectors (left), the singular values (middle), and the first three right
singular vectors (right). The right singular vectors are offset to simplify interpretation. The vectors are colored according to their column numbers. Blue: first singular vector,
red: second singular vector, yellow: third singular vector.
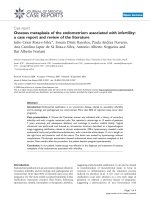
Fig. 8. Chromatograms of the third case study as retrieved by MCR and compared to off-line analytics. The dashed red lines show the normalized concentration estimate
from the hard model. The solid black lines correspond to the rotated left singular vectors. The bars show the measured concentration by off-line analytics. Yellow: native
IgG1, blue: ADC.
in turn were more affected by mixing and diffusive peak broadening. Despite these deviations, good estimations were obtained for
the elution of cytochrome c and lysozyme with R2 values of 0.93 and
0.91, respectively. Between the concentrations by the rotated singular vectors and the hard model, only minor differences occurred.
Thus, the method could be extended to the case of multiple chromatographic runs while still obtaining a stable convergence of the
algorithm.
4.3. Application of MCR to an ADC purification step
In the third case study, an ADC conjugation reaction mixture was
loaded onto a HIC column. This purification step aimed to deplete
chemical reactants and separate conjugated from native IgG1. Due
to the reaction chemicals, the loaded mixture was relatively complex. Additionally, the protein concentration during elution was
lower compared to the previous case studies. This increased the
perceived noise level and baseline drift. To simplify the analysis
of the chromatogram, the evaluation focused on the main elution
peak of native, mono-conjugated, and di-conjugated IgG1.
In Fig. 7, the results of an SVD are shown. The first two singular
values were noticeably larger than the following ones. Interestingly, the second left singular vector already contained some
baseline drift. The baseline drift became stronger for the third left
singular vector. The second right singular vector was not influenced
by noise and contained strong spectral bands around 384 nm. These
bands are typical of the used surrogate drug. The third right singular vector was noticeably deteriorated by noise. Based on these
observations, two components were included into the MCR optimization. Optimization of the third case study converged in less
than a minute. The resulting chromatogram is shown in Fig. 8. Similar to the previous case studies, the location of the concentration
maxima corresponded well to the off-line analytics. Slight differences could be observed in tailing and fronting. The good results
were confirmed by the R2 values of 0.99 and 0.97 for the native IgG
and the ADC, respectively. The R2 was again calculated based on the
normalized areas. The better agreement between off-line analytics
and MCR results were attributed to the long elution gradient which
reduced the effects of system dispersion between detector and fractionator as well as possibly the bigger spectral differences between
the IgG and the ADC. Interestingly, the differences between the
rotated singular vectors and the hard model were bigger in this
case. This was explained by the observed baseline drift included
in the second singular vectors which again is related to the matrix
factorization. SVD captured on each additional dimension as much
variation as possible. The information is however not necessarily
useful for the estimation of the elution profile. Thus, other matrix
factorization approaches may outperform SVD. Nevertheless, the
used PCD algorithm also in the last case study provided promising
results.
4.4. Protein identification based on the estimated spectra
To assess how accurate the MCR algorithm estimated data in
spectral dimension, the previously estimated spectra were compared to the second derivatives of the spectral library shown
in Fig. 1. Prior to the comparison, all spectra were normalized by standard normal variate transformation to remove any
concentration-related information. In Fig. 9, all spectra were projected onto a plane by PCA. Estimated spectra were projected into
M. Rüdt et al. / J. Chromatogr. A 1585 (2019) 152–160
159
wide variety of applications in biopharmaceutical purification are
conceivable and may be explored in future.
Acknowledgment
This work has received funding from the European Union’s
Horizon 2020 research and innovation programme under grant
agreement No. 635557. We are thankful for the IgG2 protein A pool
from Lek Pharmaceuticals and the IgG1 pool from MedImmune.
Laura Rolinger has thoroughly reviewed this manuscript. We are
grateful for the many helpful suggestions.
References
Fig. 9. Score plot based on a PCA of the spectral library. The spectra from the protein
library are marked by black circles. The retrieved spectra from MCR are projected
onto the plane. The positions of the spectra of the case studies are marked by diamonds (first case study), crosses (second case study), and an asterisk (third case
study).
the vicinity of the corresponding reference spectra. The results
were even more pronounced when directly comparing Euclidean
distances between the second derivative spectra. For case study
1, the distances between the reference and estimated spectra of
ribonuclease A, cytochrome c, lysozyme were 0.5, 0.6, and 0.3,
respectively. All other distances were ≥1.8. For the second case
study, the Euclidean distances were 0.8 for cytochrome c and 0.3
for lysozyme with all other distances being ≥2. For the third case
study, only the estimated spectrum from 240 nm tot 310 nm of the
unconjugated IgG1 was used. The ADC could not be evaluated in
this manner, as the drug contributed to the absorption in the protein spectral range and thus biased an identification. The Euclidean
distance from the IgG1 was smallest to the IgG2 with 2.1. All other
distances were ≥2.5. The bigger difference was explained by the
structural differences of IgG1 to IgG2 next to the error introduced
by the factorization by MCR. The results show, that the estimated
second derivative spectra of the MCR algorithm are close to the
spectra of the pure components and may even be used to draw
conclusions on the generating protein.
5. Conclusion
Here, the application of MCR with hard model constraints on
preparative protein chromatographic data was tested. The results
show that MCR was well capable of factorizing chromatograms
even though protein spectra are subject only to small spectral variation. Differences in peak shape and location of the estimated elution
profiles remained small. The matrix factorization of the protein
chromatograms could be directly used for protein identification.
In summary, MCR seems to be a suitable tool for evaluating protein
chromatograms if the eluting species are spectroscopically different. For UV–vis spectroscopy, mainly the amount of aromatic amino
acids, the local environment of aromatic amino acids, and disulfide bridging affect the protein spectra in the investigated spectral
range [36]. The proposed method may be especially useful for applications in process development as it is readily applicable without
prior calibration.
While the current algorithm is limited to EMGs, other curve
shapes could be implemented in a similar manner to also address
different elution behavior. Furthermore, MCR is not limited to
UV–vis spectroscopy. Other PAT sensors may benefit from its application as long as they follow a bilinear relation. These occur for
many (process) analytical technologies including IR spectroscopy,
Raman spectroscopy, and on-/at-/off-line HPLC. In consequence, a
[1] G. Carta, A. Jungbauer, Protein Chromatography: Process Development and
Scale-up, John Wiley & Sons, 2010.
ˇ
[2] M. Schiestl, T. Stangler, C. Torella, T. Cepeljnik,
H. Toll, R. Grau, Acceptable
changes in quality attributes of glycosylated biopharmaceuticals, Nat.
Biotechnol. 29 (2011) 310–312.
[3] K.A. Bakeev, Process Analytical Technology: Spectroscopic Tools and
Implementation Strategies for the Chemical and Pharmaceutical Industries,
2nd Edition, John Wiley & Sons, 2010.
[4] J. Glassey, K.V. Gernaey, C. Clemens, T.W. Schulz, R. Oliveira, G. Striedner, C.-F.
Mandenius, Process analytical technology (PAT) for biopharmaceuticals,
Biotechnol. J. 6 (4) (2011) 369–377.
[5] L.L. Simon, H. Pataki, G. Marosi, F. Meemken, K. Hungerbühler, A. Baiker, S.
Tummala, B. Glennon, M. Kuentz, G. Steele, H.J.M. Kramer, J.W. Rydzak, Z.
Chen, J. Morris, F. Kjell, R. Singh, R. Gani, K.V. Gernaey, M. Louhi-Kultanen, J.
Oreilly, N. Sandler, O. Antikainen, J. Yliruusi, P. Frohberg, J. Ulrich, R.D. Braatz,
T. Leyssens, M. Von Stosch, R. Oliveira, R.B.H. Tan, H. Wu, M. Khan, D. Ogrady,
A. Pandey, R. Westra, E. Delle-Case, D. Pape, D. Angelosante, Y. Maret, O.
Steiger, M. Lenner, K. Abbou-Oucherif, Z.K. Nagy, J.D. Litster, V.K. Kamaraju,
M.S. Chiu, Assessment of recent process analytical technology (PAT) trends: a
multiauthor review, Organ. Process Res. Dev. 19 (1) (2015) 3–62, http://dx.
doi.org/10.1021/op500261y.
[6] P. Roch, C.-F. Mandenius, On-line monitoring of downstream bioprocesses,
Curr. Opin. Chem. Eng. 14 (2016) 112–120, />2016.09.007.
[7] M. Rüdt, T. Briskot, J. Hubbuch, Advances in downstream processing of
biologics-spectroscopy: an emerging process analytical technology, J.
Chromatogr. A 1490 (2017) 2–9.
[8] R.L. Fahrner, P.M. Lester, G.S. Blank, D.H. Reifsnyder, Real-time control of
purified product collection during chromatography of recombinant human
insulin-like growth factor-I using an on-line assay, J. Chromatogr. A 827 (1)
(1998) 37–43.
[9] R.L. Fahrner, G.S. Blank, Real-time control of antibody loading during protein
A affinity chromatography using an on-line assay, J. Chromatogr. A 849 (1)
(1999) 191–196.
[10] A.S. Rathore, M. Yu, S. Yeboah, A. Sharma, Case study and application of
process analytical technology (PAT) towards bioprocessing: use of on-line
high-performance liquid chromatography (HPLC) for making real-time
pooling decisions for process chromatography, Biotechnol. Bioeng. 100 (2)
(2008) 306–316.
[11] A.S. Rathore, R. Wood, A. Sharma, S. Dermawan, Case study and application of
process analytical technology (PAT) towards bioprocessing II: use of
ultra-performance liquid chromatography (UPLC) for making real-time
pooling decisions for process chromatography, Biotechnol. Bioeng. 101 (6)
(2008) 1366–1374.
[12] O. Kaltenbrunner, Y. Lu, A. Sharma, K. Lawson, T. Tressel, Risk-benefit
evaluation of on-line high-performance liquid chromatography analysis for
pooling decisions in large-scale chromatography, J. Chromatogr. A 1241
(2012) 37–45.
[13] D.J. Karst, F. Steinebach, M. Soos, M. Morbidelli, Process performance and
product quality in an integrated continuous antibody production process,
Biotechnol. Bioeng. 114 (2) (2017) 298–307, />26069.
[14] S.K. Hansen, E. Skibsted, A. Staby, J. Hubbuch, A label-free methodology for
selective protein quantification by means of absorption measurements,
Biotechnol. Bioeng. 108 (11) (2011) 2661–2669.
[15] S.K. Hansen, B. Jamali, J. Hubbuch, Selective high throughput protein
quantification based on UV absorption spectra, Biotechnol. Bioeng. 110 (2)
(2013) 448–460.
[16] N. Brestrich, T. Briskot, A. Osberghaus, J. Hubbuch, A tool for selective inline
quantification of co-eluting proteins in chromatography using spectral
analysis and partial least squares regression, Biotechnol. Bioeng. 111 (7)
(2014) 1365–1373.
[17] N. Brestrich, A. Sanden, A. Kraft, K. McCann, J. Bertolini, J. Hubbuch, Advances
in inline quantification of co-eluting proteins in chromatography:
process-data-based model calibration and application towards real-life
separation issues, Biotechnol. Bioeng. 112 (2015) 1406–1416.
[18] N. Brestrich, M. Rüdt, D. Büchler, J. Hubbuch, Selective protein quantification
for preparative chromatography using variable pathlength UV/vis
160
[19]
[20]
[21]
[22]
[23]
[24]
[25]
[26]
M. Rüdt et al. / J. Chromatogr. A 1585 (2019) 152–160
spectroscopy and partial least squares regression, Chem. Eng. Sci. 176 (2018)
157–164, URL http://linkinghub.
elsevier.com/retrieve/pii/S0009250917306462.
S. Großhans, M. Rüdt, A. Sanden, N. Brestrich, J. Morgenstern, S. Heissler, J.
Hubbuch, In-line Fourier-transform infrared spectroscopy as a versatile
process analytical technology for preparative protein chromatography, J.
Chromatogr. A 1547 (2018) 37–44, />03.005, URL />A. de Juan, R. Tauler, Multivariate curve resolution (MCR) from 2000: progress
in concepts and applications, Crit. Rev. Anal. Chem. 36 (3-4) (2006) 163–176,
/>C. Ruckebusch, L. Blanchet, Multivariate curve resolution: a review of
advanced and tailored applications and challenges, Anal. Chim. Acta 765
(2013) 28–36, URL http://www.
sciencedirect.com/science/article/pii/S0003267012018351.
H. Parastar, R. Tauler, Multivariate curve resolution of hyphenated and
multidimensional chromatographic measurements: a new insight to address
current chromatographic challenges, Anal. Chem. 86 (1) (2014) 286–297,
/>O.S. Borgen, B.R. Kowalski, An extension of the multivariate
component-resolution method to three components, Anal. Chim. Acta 174
(1985) 1–26, URL: http://
www.sciencedirect.com/science/article/pii/S0003267000843615.
O.S. Borgen, N. Davidsen, Z. Mingyang, Ø. Øyen, The multivariate
n-component resolution problem with minimum assumptions, Microchim.
Acta 89 (1) (1986) 63–73, />B. Vandeginste, R. Essers, T. Bosman, J. Reijnen, G. Kateman, Three-component
curve resolution in liquid chromatography with multiwavelength diode array
detection, Anal. Chem. 57 (6) (1985) 971–985, />ac00283a005.
F. Dismer, S. Hansen, S.A. Oelmeier, J. Hubbuch, Accurate retention time
determination of co-eluting proteins in analytical chromatography by means
of spectral data, Biotechnol. Bioeng. 110 (3) (2013) 683–693, />10.1002/bit.24738, URL: />
[27] K. Neymeyr, M. Sawall, D. Hess, Pure component spectral recovery and
constrained matrix factorizations: Concepts and applications, Journal of
Chemometrics 24 (2) (2010) 67–74, />[28] M. Sawall, A. Börner, C. Kubis, D. Selent, R. Ludwig, K. Neymeyr, Model-free
multivariate curve resolution combined with model-based kinetics:
algorithm and applications, J. Chemometr. 26 (10) (2012) 538–548, http://dx.
doi.org/10.1002/cem.2463.
[29] W.H. Lawton, E.A. Sylvestre, Self modeling curve resolution, Technometrics 13
(3) (1971) 617–633, URL: />[30] R. Tauler, Application of non-linear optimization methods to the estimation of
multivariate curve resolution solutions and of their feasible band boundaries
in the investigation of two chemical and environmental simulated data sets,
Anal. Chim. Acta 595 (2007) 289–298, />12.043.
[31] S. Arase, K. Horie, T. Kato, A. Noda, Y. Mito, M. Takahashi, T. Yanagisawa,
Intelligent peak deconvolution through in-depth study of the data matrix
from liquid chromatography coupled with a photo-diode array detector
applied to pharmaceutical analysis, J. Chromatogr. A 1469 (2016) 35–47,
/>[32] Y. Kalambet, Y. Kozmin, K. Mikhailova, I. Nagaev, P. Tikhonov, Reconstruction
of chromatographic peaks using the exponentially modified Gaussian
function, J. Chemometr. 25 (7) (2011) 352–356, />cem.1343.
[33] A. Savitzky, M.J.E. Golay, Smoothing and differentiation of data by simplified
least squares procedures, Anal. Chem. 36 (8) (1964) 1627–1639.
[34] L. Eriksson, E. Johansson, N. Kettaneh-Wold, J. Trygg, C. Wikström, S. Wold,
Multi- and Megavariate Data Analysis, Umetrics Academy, 2006.
[35] H. Mach, C.R. Middaugh, Simultaneous monitoring of the environment of
tryptophan, tyrosine, and phenylalanine residues in proteins by
near-ultraviolet second-derivative spectroscopy, Anal. Biochem. 222 (1994)
323–331, />[36] W. Jiskoot, D. Crommelin (Eds.), Methods for Structural Analysis of Protein
Pharmaceuticals, American Association of Pharmaceutical Scientists, 2005.