Báo cáo Y học: The reactivity of a-hydroxyhaem and verdohaem bound to haem oxygenase-1 to dioxygen and sodium dithionite pdf
Bạn đang xem bản rút gọn của tài liệu. Xem và tải ngay bản đầy đủ của tài liệu tại đây (510.79 KB, 9 trang )
The reactivity of a-hydroxyhaem and verdohaem bound
to haem oxygenase-1 to dioxygen and sodium dithionite
Hiroshi Sakamoto
1
, Yoshiaki Omata
1
, Shunsuke Hayashi
1
, Saori Harada
1
, Graham Palmer
2
and Masato Noguchi
1
1
Department of Medical Biochemistry, Kurume University School of Medicine, Japan;
2
Department of Biochemistry and Cell Biology,
Rice University, Houston, Texas, USA
Recently we have shown that ferric a-hydroxyhaem bound
to haem oxygenase-1 can be converted to ferrous verdohaem
by approximately an equimolar amount of O
2
in the absence
of exogenous electrons [Sakamoto, H., Omata, Y., Palmer,
G., and Noguchi, M. (1999) J. Biol. Chem. 274, 18196–
18200]. Contrary to those results, other studies have claimed
that the conversion requires both O
2
andanelectron.More
recently, Migita et al. have reported that the major reaction
product of ferric a-hydroxyhaem with O
2
is a ferric
porphyrin cation radical that can be converted to ferrous
a-hydroxyhaem with sodium dithionite [Migita, C. T., Fujii,
H., Matera, K. M., Takahashi, S., Zhou, H., and Yoshida,
T. (1999) Biochim. Biophys. Acta 1432, 203–213]. To clarify
the reason(s) for the discrepancy, we compared the reactions;
i.e. a-hydroxyhaem to verdohaem and verdohaem to bili-
verdin, under various conditions as well as according to the
procedures of Migita. We find that complex formation of
a-hydroxyhaem with haem oxygenase may be small and a
substantial amount of free a-hydroxyhaem may remain,
depending on the reconstitution conditions; this could lead
to a misinterpretation of the experimental results. We also
find that ferrous verdohaem appears to be air-sensitive and is
therefore easily converted to a further oxidized species with
excess O
2
. Finally, we find that dithionite seems to be inap-
propriate for investigating the haem oxygenase reaction,
because it reduces ferrous verdohaem to a further reduced
species that has not been seen in the haem degradation
system driven by NADPH-cytochrome P450 reductase.
Keywords: haem oxygenase; a-hydroxyhaem; verdohaem;
sodium dithionite; NADPH-cytochrome P450 reductase.
Microsomal haem oxygenase (HO, EC 1.14.99.3) catalyses
the O
2
-dependent physiological degradation of haem using
reducing equivalents from NADPH-cytochrome P450
reductase, and produces biologically active molecules:
biliverdin, CO, and iron, which display both beneficial
and deleterious effects, depending on the circumstances
[1,2]. Two isoforms of HO, HO-1 and HO-2, exist and are
different gene products. HO-1 is highly expressed in the
spleen and liver, and is inducible not only by haem itself but
also by a variety of agents causing oxidative stress. HO-1 is
also known as heat shock protein 32 and may protect cells
from oxidative damage through antioxidant activity of
bilirubin produced through the subsequent reduction of
biliverdin by biliverdin reductase. HO-2, on the other hand,
is constitutively expressed in the brain, testes and vascular
systems. Evidence accumulated in the past decade suggests
that the principal role of HO-2 is the production of CO as a
signal mediator (reviewed in [2–5]). However, this role of
CO as a signaling agent remains controversial [6].
The HO reaction consists of three sequential oxidation
steps [7,8]. Haem bound to the enzyme is first hydroxylated
at the a-meso-carbon, yielding a-hydroxyhaem. The second
step is the conversion of a-hydroxyhaem to verdohaem
with the concomitant release of the a-meso-carbon as CO
[9]. Finally, the oxygen bridge of verdohaem is cleaved to
produce iron and biliverdin. Recently, the crystal structures
of both human [10] and rat [11] HO-1 in complex with
haem have been determined and provide important
information on the selective a-meso-hydroxylation. The
haem is sandwiched between two helices: the proximal
helix bears His-25 as the ligand to the haem iron and the
distal helix lies above the b-, c-, and d-meso-carbon atoms
of the porphyrin macrocycle. These structural features
probably direct the a-meso-accessibility of the ferric
hydroperoxide that has been demonstrated as the porphy-
rin-hydroxylating species [12–16]. Moreover, no polar side
chains at the distal side are in direct contact with the iron-
bound ligand, i.e. water or hydroxide, but only the
backbone atoms of Gly139 and Gly143 are close enough
to hydrogen-bond to the distal ligand. We have proposed
that, if the amide nitrogen of Gly143 is the proton donor
hydrogen-bonded to the iron-bound oxygen of the ferric
hydroperoxide, it can stabilize the negatively charged
oxygen and facilitate the electrophilic addition of the
terminaloxygentothea-methene bridge [11]. The recent
findings by Liu et al. [17] that Gly143 mutants, all of which
have lost the water ligand, have no HO activity support
this proposal.
Correspondence to M. Noguchi, Department of Medical Biochemistry,
Kurume University School of Medicine, 67 Asahi-machi,
Kurume 830-0011, Japan.
Fax: + 81 942 31 4377, Tel. + 81 942 31 7544,
E-mail:
Abbreviations: HO, haem oxygenase; rHO-1, truncated rat haem
oxygenase-1; OEPO, octaethyloxophlorin; OEOP, octa-
ethyloxoporphyrin; OEB, octaethylbilindione.
Enzyme: microsomal haem oxygenase (HO, EC 1.14.99.3).
(Received 30 May 2002, revised 20 August 2002,
accepted 5 September 2002)
Eur. J. Biochem. 269, 5231–5239 (2002) Ó FEBS 2002 doi:10.1046/j.1432-1033.2002.03230.x
Although major advances have been made in under-
standing the nature of the first hydroxylation of haem, the
mechanisms for the subsequent steps, especially the conver-
sion of a-hydroxyhaem to verdohaem, are still unclear. On
the basis of spectroscopic studies of a-hydroxyhaem in
complex with chemical ligands [18–21] and with proteins
such as apomyoglobin [22] or HO [23,24], the ferric
a-hydroxyhaem is deprotonated and assumes the resonance
structure (Scheme 1), a high-spin ferric enolate (1a)-keto
(1b) tautomer and a low-spin ferrous p neutral radical (1c)
(reviewed in [15,25]). It is widely accepted that direct binding
of O
2
to 1c at the haem edge triggers CO extrusion and
verdohaem formation. However, the requirement for redu-
cing equivalents as well as the oxidation state of the
resultant verdohaem remains controversial.
Thus, Matera et al. [26], and subsequently Migita et al.
[27], have reported that this conversion requires both O
2
and
an exogenous electron to yield the ferrous verdohaem
(Scheme 2A). They chemically synthesized a-hydroxyhae-
min and prepared its complex with a soluble rat HO-1
protein. According to their results, most (% 70%) of ferric
a-hydroxyhaem bound to the enzyme was converted to a
ferric porphyrin cation radical upon exposure to O
2
, along
with generation of the ferrous verdohaem as a minor
product (less than 30%). The major product, the ESR-silent
porphyrin cation radical, can be returned to the ferrous
a-hydroxyhaem by addition of sodium dithionite. However,
it was not clearly explained why partial formation of ferrous
verdohaem took place during the reaction of a-hydroxy-
haem with O
2
without the addition of an electron.
By contrast, Liu et al. [23] reported that in the anaerobic
reaction of the ferric haem-human HO-1 complex with 1
molar equivalent of H
2
O
2
, ferric a-hydroxyhaem was
produced, which upon exposure to air was converted to
ferric verdohaem. They also directly obtained ferric verdo-
haem in the reaction of the haem-HO complex with H
2
O
2
in
air. They concluded that the reaction only needs O
2
and that
an electron is required for conversion of ferric verdohaem to
the ferrous state (Scheme 2B). We have reported [24] that
under strictly anaerobic conditions employing synthetic
a-hydroxyhaem bound to rat HO-1 (rHO-1), this conver-
sion is achieved with an almost equimolar amount of O
2
in
the absence of reducing equivalents and that the resultant
verdohaem appeared to be in the ferrous state (Scheme 2C).
In contrast to the previous studies, the pathway we have
proposed does not require any reducing equivalents, and
instead postulates generation of an oxidizing equivalent
with the formal stoichiometry of (1/2) H
2
O
2
[28].
In the present study, we have attempted to clarify the
reason(s) for these discrepancies. At first, we carefully
compared the absorption spectra of our ferric, ferrous and
CO-ferrous a-hydroxyhaem-HO complexes with those
prepared by Matera et al. [26]. Next, we compared the
conversion of a-hydroxyhaem to verdohaem and of verdo-
haem to biliverdin under various conditions including those
used by Migita et al. [27].
EXPERIMENTAL PROCEDURES
Materials
A truncated version of rHO-1 lacking the 22-amino acid
C-terminal hydrophobic stretch was expressed in Escheri-
chia coli and purified as described [29]. The catalytic activity
of this rHO-1 was comparable to that of the wild type.
NADPH-cytochrome P450 reductase was purified from rat
liver as previously described [30]. Gases of high purity,
argon (99.999%), O
2
(99.99%) and N
2
(99.99%) were used
(Iwatani, Fukuoka, Japan). All other chemicals used were
of analytical grade.
Formation of a-hydroxyhaem-rHO-1 complex
Unless otherwise stated, the following manipulations were
carried out anaerobically in a glove box filled with N
2
at
room temperature (25 °C). a-Hydroxyhaemin was synthes-
ized as described [24]. A concentrated anaerobic rHO-1
Scheme 1. The resonance structure of a-hydroxyhaem.
Scheme 2. Three reaction formulae proposed for the conversion of
a-hydroxyhaem to verdohaem. (A), (B) and (C) are formulated after
Matera et al. [26,27], Liu et al.[23]andSakamotoet al.[24],
respectively. The porphyrin substituents are omitted for clarity.
5232 H. Sakamoto et al. (Eur. J. Biochem. 269) Ó FEBS 2002
solution (% 0.5 m
M
)in0.1
M
potassium phosphate buffer
(pH 7.4) was prepared in a Reacti-vial sealed with a
Mininert valve (Pierce, Rockford, IL, USA) by gentle
stirring of the solution for 3 h at 5 °C under flowing argon
gas moistened by passing through anaerobic water. Recon-
stitution of the ferric a-hydroxyhaem-rHO-1 complex was
carried out as follows; a portion of the rHO-1 solution was
transferred to a custom-made anaerobic titrator [24], that
contained % 1 mL of the buffer. Then a-hydroxyhaemin
dissolved in a small amount of 0.1
M
NaOH saturated with
argon was added, with the molar ratio to rHO-1 being
% 0.9. The final concentration of rHO-1 was % 70 l
M
.The
amounts of a-hydroxyhaem added were determined as the
pyridine haemochrome of a-hydroxyhaemin dimethyl ester
using e
422 nm
¼ 153.6 m
M
)1
Æcm
)1
[22]. By this procedure,
i.e. addition of the alkaline a-hydroxyhaem solution into the
rHO-1 protein in the potassium phosphate buffer (pH 7.4),
it was found that complex formation was easily accom-
plished (within 3 min). Hence, we adopted this procedure as
the routine method for preparing the a-hydroxyhaem-rHO-
1 complex.
Formation of ferrous verdohaem-rHO-1 complex
The ferrous verdohaem-rHO-1 complex was prepared in
two different ways. In the first method, the complex was
prepared from the a-hydroxyhaem-rHO-1 complex by
addition of an approximately equimolar amount of O
2
[24]. In the second method, the complex was prepared by
reconstitution from synthetic a-verdohaem and rHO-1 [31].
In each method, the concentration of verdohaem was
determined as pyridine verdohaemochrome using
e
680 nm
¼ 28.5 m
M
)1
Æcm
)1
in pyridine-H
2
O(1:2v/v)or
e
685 nm
¼ 31.2 m
M
)1
Æcm
)1
in pyridine-CHCl
3
(3 : 7 v/v) as
reported [31].
Titrations
Titration experiments were performed as previously des-
cribed [24]. Sodium dithionite or NADPH was dissolved
into the potassium phosphate buffer (pH 7.4) in a custom-
made vessel that was based on a flask previously reported
[32]. The concentration of sodium dithionite was determined
by reductive titration of oxidized lumiflavin 3-acetate
(e
446 nm
¼ 11.3 m
M
)1
Æcm
)1
) with the dithionite solution,
assuming that 1 mol of dithionite reduces 1 mol of lumi-
flavin 3-acetate by 2-electron reduction [32,33]. The con-
centration of NADPH was determined using e
339 nm
¼
6.2 m
M
)1
Æcm
)1
.TheO
2
-saturated buffer (1.25 m
M
as O
2
)
was prepared by bubbling O
2
into the buffer solution for
3 h. Each of these titrants (dithionite, NADPH and O
2
)
was loaded into a separate syringe equipped with a needle
and a screw-threaded plunger. Exchange of the syringe
containing different titrant was carried out under continu-
ous argon flow through the top inlet of the titrator.
Exposure of a sample in the titrator to atmospheric O
2
was
attained by bubbling air through a long needle into the
solution phase.
Instruments
Optical absorption spectra were recorded on a Varian Cary
50 UV-visible spectrophotometer in a glove box filled with
N
2
at room temperature (25 °C). X-band ESR spectra were
recorded at 5 K using a JEOL ESR spectrometer (JES
FE3X) equipped with a JEOL liquid helium cryostat (ES-
LTR5X). The instrumental conditions were: modulation
frequency, 100 kHz; modulation amplitude, 1 millitesla;
microwave frequency, 9.88 GHz; and microwave power,
10 lW. The microwave frequency was calibrated with a
microwave frequency counter (Advantest) and the magnetic
field strength was determined with a JEOL NMR counter
(JEOL ES-OC1).
RESULTS AND DISCUSSION
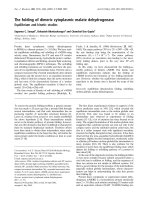
Formation of a-hydroxyhaem-rHO-1 complex
The various forms of a-hydroxyhaem bound to HO-1 were
first investigated by Matera et al. [26]; the optical spectrum
of the ferric form exhibited a rather broad Soret band,
whereas the Soret bands of the ferrous and ferrous-CO
forms were narrow (Fig. 1B). The ratios of the intensities of
the Soret maximum of the ferric (spectrum aÕ), and ferrous
Fig. 1. Comparison of the absorption spectra of several a-hydroxyhaem-HO-1 complexes. (A) The ferric (spectrum a, –), ferrous (spectrum b, ÆÆ Æ), and
CO-ferrous a-hydroxyhaem-HO-1 complex (spectrum c, - - -) prepared in this study. The final concentrations of rHO-1 and a-hydroxyhaemin were
69 and 61 l
M
, respectively. See Experimental procedure for details. (B) The ferric (spectrum aÕ, –), ferrous (spectrum bÕ, ÆÆÆ), and CO-ferrous
a-hydroxyhaem-HO-1 complex (spectrum cÕ, - - -) reported by Matera et al. [26]. Figure 1 from [26] is replotted in order to make the apparent
heights of absorption maxima of CO-ferrous complex of both preparations the same.
Ó FEBS 2002 Conversion of a-hydroxyhaem to verdohaem by HO (Eur. J. Biochem. 269) 5233
complexes (spectrum bÕ) to that of the CO-ferrous complex
(spectrum cÕ) were 0.55 and 0.78, respectively. The optical
spectra of the three forms of our a-hydroxyhaem-rHO-1
complex are shown in Fig. 1A; the Soret maxima at 407,
433, and 421 nm for the ferric (spectrum a), ferrous
(spectrum b), and CO-ferrous (spectrum c) forms, respect-
ively, agree with those reported by Matera et al.[26].
However, the sharpness of the Soret band of our ferric form
was remarkable in that the ratios of intensities of the Soret
maximum of our ferric and ferrous forms to that of the
CO-ferrous form were 0.65, and 0.81, respectively. Com-
parison of these ratios to those of Matera et al.suggested
that formation of their complex between ferric a-hydroxy-
haem and HO was incomplete, and this led us to reexamine
the process of complex formation.
Upon reversing the order of additions, i.e. concentrated
rHO-1 solution was added to the neutral a-hydroxyhaem
solution in the same pH 7.4 buffer, complex formation took
over 6 h for completion (data not shown). We further noticed
that keeping a-hydroxyhaem for several minutes in the
neutral pH buffer before the addition of rHO-1, led to
minimal complex formation (Fig. 2A). In both cases, we
observed some precipitation of brown-colored particles. In
Fig. 2A, a slight decrease in absorbance between 300 and
600 nm (compare spectra a and b) was probably due to the
precipitation of free a-hydroxyhaem. These observations
indicated that a-hydroxyhaem might be apt to aggregate
during incubation at neutral pH, and consequently, complex
formation may become markedly slow or nonexistent. An
additional interesting finding was that subsequent addition
of sodium dithionite to the mixture of rHO-1 and
a-hydroxyhaem in which almost no complexes had yet been
formed (Fig. 2A), caused the smooth formation of the
ferrous complex with a Soret maximum at 433 nm. This
process was complete within 2 h, and the sample solution
became clear (Fig. 2B). We concluded that the ferrous
complex was mainly formed through reduction of free
a-hydroxyhaem by dithionite followed by its direct binding
to the enzyme, rather than by reduction of the enzyme-bound
ferric a-hydroxyhaem, as no complex formation was seen
when the cytochrome P450 reductase system was employed
in place of sodium dithionite (data not shown). The finding
that ferric a-hydroxyhaem is only slowly incorporated into
the enzyme at neutral pH would explain the apparent
broadness in the Soret band of the ferric complex.
It is well known that ferric a-hydroxyhaem, prepared in
aqueous solvent [20] or in a noncoordinating organic
solvent such as chloroform [34], readily dimerizes. This
dimer formation is observed only with ferric a-hydroxy-
haem [20,34]. As reduction of the haem iron allows the
meso-oxygenatomtobeprotonated[26],thedimeric
structure could not be maintained in the ferrous state.
Hence, we suggest that in these experiments the free
a-hydroxyhaem rapidly dimerized and subsequently aggre-
gated and precipitated and that reduction of ferric
a-hydroxyhaem by sodium dithionite reversed this aggre-
gation and consequently facilitated complex formation with
the enzyme. This in turn explains why the spectra of both
our and Matera’s ferrous and CO-ferrous complexes are
almost identical (Fig. 1).
Reaction of ferric a-hydroxyhaem with excess O
2
Migita et al. [27] reported that upon exposure of ferric
a-hydroxyhaem bound to HO-1 to air, it was oxidized to a
ferric porphyrin cation radical. However, we have demon-
strated that the anaerobic addition of an equimolar amount
of O
2
converts the ferric a-hydroxyhaem to the ferrous
verdohaem [24]. To investigate the effect of excess O
2
on
ferric a-hydroxyhaem, we again titrated the a-hydroxy-
haem-rHO-1 complex with O
2
under strictly anaerobic
conditions (Fig. 3A). As previously reported [24], the
addition of an approximately equimolar amount of O
2
to
the a-hydroxyhaem complex yielded a mixture of ferrous
CO-verdohaem (640 nm) and CO-free ferrous verdohaem
(690 nm) (Fig. 3A, spectrum a). The absorbances at 400
and 690 nm were almost unaffected by further addition of
up to % 3 equivalents of O
2
. Further addition of O
2
led to a
decrease in absorbance (Fig. 3A, panel). Spectrum b
obtained with five equivalents of O
2
still showed the
absorption maxima characteristic of verdohaem but the
absorbance was reduced over the entire spectrum, suggest-
ing that the ferrous verdohaem underwent a further reaction
with the excess O
2
. We found that the dark green color of
the ferrous verdohaem decreased during the O
2
titration.
Fig. 2. Formation of the a-hydroxyhaem-rHO-1 complex in the ferric
and ferrous states. (A) a-Hydroxyhaemin (38 nmol) was dissolved in
0.75 mL of potassium phosphate buffer (pH 7.4) and allowed to stand
for 30 min, prior to addition of 0.25 mL of the rHO-1 solution
(103 nmol). The final concentrations of rHO-1 and a-hydroxyhaemin
were 103 and 38 l
M
, respectively. Spectra were recorded immediately
(spectrum a, –) and after 1-h incubation (spectrum b, - - -). (B) Spectra
were recorded immediately (–), and at 30 min, 1 h (ÆÆÆ),and2h( )
after addition of 1.4 eq of sodium dithionite (54 nmol) to the sample of
spectrum b.
5234 H. Sakamoto et al. (Eur. J. Biochem. 269) Ó FEBS 2002
Spectrum b (Fig. 3A) resembles the spectrum that Migita
et al. assigned to the ferric a-hydroxyhaem p cation radical,
and is different from that of the ferric verdohaem-rHO-1
complex [24,31]. The ferric verdohaem complex exhibits a
rhombic ESR spectrum with g-values of 2.54, 2.14, and 1.88
that are typical of low-spin haemproteins possessing
hydroxide as the sixth ligand [24,31], but the product giving
spectrum b gave a poorly resolved axial signal at g ¼ 2.02
and 1.98 (data not shown). The reaction product(s) of the
ferrous verdohaem with excess O
2
(hereafter referred to as
the O
2
-oxidized verdohaem) has not yet been fully clarified.
Figure 3B shows the sequential reactions of the
O
2
-oxidized verdohaem with sodium dithionite and then
with CO and O
2
, according to the procedures reported by
Migita et al. [27]. The anaerobic addition of sodium dithi-
onite yielded spectrum c showing an asymmetric Soret band
with shoulders around 400 and 430 nm; subsequent addition
of CO produced spectrum d having a relatively sharp Soret
band at 420 nm. The Soret maxima at 430 and 420 nm
indicated that the ferrous and CO-ferrous a-hydroxyhaem
bound to HO were the result of the additions of dithionite
and CO, but their yield was clearly small compared to that
obtained by Migita et al. [27]. Hence, it seems unlikely that
formation of the ferrous a-hydroxyhaem-rHO-1 complex
implied the recovery of the a-hydroxyhaem species from the
ferric porphyrin cation radical that was their major product.
Rather we consider that the ferrous complex was newly
formed upon reduction of the residual unbound ferric
a-hydroxyhaem by sodium dithionite. Exposure to air
generated spectrum e with the characteristic absorption
maxima of the CO-ferrous verdohaem complex at 407 and
636 nm. Again, the absorption intensity at 636 nm was too
small to regard CO-ferrous verdohaem as the major product.
Electrochemical studies have shown that the bis-cpyridine
complex of iron(III) octaethyloxophlorin {(py)
2
Fe
III
(OEPO)} undergoes two reversible one-electron transfer
processes as follows [25]:
fðpyÞ
2
Fe
II
ðOEPOHÞ
É
Àe
À
; ÀH
þ
ÀÀÀÀÀÀÀÀÀ!
ÀÀÀÀÀÀÀÀ
þe
À
; ÀH
þ
fðpyÞ
2
Fe
III
ðOEPOÞg
Àe
À
ÀÀÀÀÀÀÀÀÀ!
ÀÀÀÀÀÀÀÀ
þe
À
ðpyÞ
2
Fe
III
ðOEPOÞ
ÂÃ
þ
ð1Þ
The solution of {(py)
2
Fe
III
(OEPO)} is air-sensitive and
exposure of the solution to dioxygen results in the direct
formation of octaethylverdohaem [(py)
2
Fe
II
(OEOP)]Cl and
the iron complex of octaethylbilindione {(py)
2
Fe
III
(OEB)}.
Theroleof[(py)
2
Fe
III
(OEPO)]
+
, corresponding to porphy-
rin p cation radical of the protohaem system, in this model
system for haem destruction remains to be determined [35].
If porphyrin p cation radical was produced by exposure of
a-hydroxyhaem to dioxygen, as claimed by Migita et al.
[27], it is conceivable that unbound a-hydroxyhaem under-
went the parallel process shown in Eqn 1.
Degradation of verdohaem with sodium dithionite
or with the NADPH-cytochrome P450 reductase system
We next explored the degradation of the ferrous verdohaem
bound to rHO-1 that was obtained from the reaction of the
ferric a-hydroxyhaem complex with an equimolar amount of
O
2
, and compared the behavior of two reducing systems,
namely: sodium dithionite and NADPH-cytochrome P450
reductase. When sodium dithionite was added gradually to
the verdohaem complex under anaerobic conditions, decrea-
ses in absorbance at 400, 535 and 690 nm took place and
broad bands appeared at 431 and 795 nm (Fig. 4A, spectrum
a). The absorption around 795 nm initially increased and
then decreased during the addition of dithionite. The spectral
changes appeared to be completed with about 4 eq of sodium
dithionite. The possibility of that the production of hydrogen
peroxide caused degradation of verdohaem was ruled out
because the dithionite solution was made anaerobically and
was used anaerobically. These findings thus suggested that
the ferrous verdohaem had been converted to a further
reduced form by the dithionite, because no similar spectra
have been previously observed in the physiological degrada-
tion of haem by HO (vide infra). The subsequent addition of
CO yielded an asymmetric Soret band with shoulders at 421
and 435 nm (Fig. 4B, spectrum b). As described above,
absorption at 421 nm implies that a small amount of the CO-
ferrous a-hydroxyhaem complex was produced by reduction
of unbound ferric a-hydroxyhaem. The additional absorp-
tion at 435 nm may be related to a CO-adduct of the
dithionite-reduced verdohaem. Exposure to air led to a
decrease in the Soret band, resulting in the production of a
Fig. 3. Spectral changes in the reaction of the ferric a-hydroxyhaem-
rHO-1 complex with O
2
. (A) Spectra were recorded after additions of
1.3 eq (spectrum a, –) and 5.0 eq (spectrum b, - - -) of O
2
.Inset:
absorbances at 400 (s) and 690 (d) nm were plotted during additions
of 0–5 of O
2
. (B) Spectra were recorded after addition of sodium
dithionite (spectrum c, –) to the sample of spectrum b, after addition of
CO (spectrum d, - - -) to the sample of spectrum c, and after exposure
to air of the sample of spectrum d (spectrum e, ÆÆÆ ).
Ó FEBS 2002 Conversion of a-hydroxyhaem to verdohaem by HO (Eur. J. Biochem. 269) 5235
biliverdin-iron chelate-like compound (Fig. 4B, spectrum c)
[36]. The absorption at 636 nm, which first increased and
then disappeared, indicates the formation and degradation of
a trace amount of the CO-ferrous verdohaem produced from
the free a-hydroxyhaem. Acidification and extraction of the
product into chloroform gave biliverdin, but its yield was less
than 40% of that obtained from the reaction with NADPH-
cytochrome P450 reductase (data not shown). Thus, we
conclude that sodium dithionite is an inappropriate reduc-
tant for investigating normal haem degradation, such as that
seen with the NADPH-cytochrome P450 reductase system.
In contrast to the reaction with dithionite, anaerobic
addition of up to 3.7 eq of NADPH in the presence of
NADPH-cytochrome P450 reductase caused no significant
changes in the spectrum of the ferrous verdohaem complex,
except for an increase in absorption at 340 nm due to the
added NADPH (Fig. 5A). Subsequent addition of CO gave
a spectrum (Fig. 5B, spectrum b) with absorption maxima
at 409 and 638 nm that are characteristic of the CO-ferrous
verdohaem complex [31,37]. Further exposure to air caused
a loss of the absorption maxima at 340, 409 and 638 nm,
and subsequent increases in the absorbances around 380
and 680 nm (Fig. 5C, spectrum c) indicative of biliverdin
formation [36]. For the ring opening that occurs in the
conversion of verdohaem to biliverdin, O
2
and reducing
equivalents are clearly necessary.
In order to confirm the results obtained above, we further
explored the degradation of the bound synthetic verdo-
haem. Additions of dithionite to the synthetic verdohaem-
rHO-1 complex caused spectral changes (Fig. 6A) similar to
those shown in Fig. 4A. The addition of CO produced an
absorption maximum at 438 nm (Fig. 6B, spectrum b) that
was considered to be a form of ferrous verdohaem further
Fig. 5. Spectral change during the degradation of verdohaem bound to
rHO-1 caused by the NADPH-cytochrome P450 reductase system. (A)
Spectra were recorded after additions of 0 (–), 1.0, 2.0, 3.0 (ÆÆÆ), and
3.7 eq (spectrum a, - - -) of NADPH, in the presence of NADPH-
cytochrome P450 reductase, to the verdohaem-rHO-1 complex
obtained as in Fig. 4A. (B) The spectrum (–) is the same as spectrum a.
Spectrum b (- - -) was recorded after addition of CO. (C) The spectrum
(–) is the same as spectrum b. Several spectra (ÆÆÆ) were recorded after
exposure to air and spectrum c (- - -) is the final product.
Fig. 4. Spectral change during the degradation of verdohaem bound to
rHO-1 caused by sodium dithionite. (A) Spectra were recorded after
additions of 0 (–), 0.9, 1.1 (ÆÆÆ), and 4.6 eq (spectrum a, - - -) of sodium
dithionite to the verdohaem-rHO-1 complex obtained in the reaction
of the ferric a-hydroxyhaem-rHO-1 with an approximately equimolar
amount of O
2
. (B) The spectrum (–) is the same as spectrum a. Spec-
trum b (- - -) was recorded after addition of CO. (C) The spectrum (–)
is the same as spectrum b. Several spectra (ÆÆÆ) were recorded after
exposure to air and spectrum c (broken line, - - -) is the final product.
5236 H. Sakamoto et al. (Eur. J. Biochem. 269) Ó FEBS 2002
reduced by sodium dithionite. The absorption at 421 nm
that was seen in spectrum b of Fig. 4B, was absent in
spectrum b because the synthetic verdohaem-rHO-1 com-
plex contained no free a-hydroxyhaem. Exposure to air
again produced a biliverdin-iron chelate-like compound
(Fig. 6C, spectrum c), accompanied by a transient appear-
ance of absorption at 633 nm similar to that observed in the
experiments shown in Fig. 4C. As expected, with the
NADPH-cytochrome P450 reductase system, the synthetic
verdohaem was degraded to biliverdin (Fig. 7A–C), in a
manner similar to that shown in Fig. 5A–C.
In an electrochemical study of bis-pyridine octaethylver-
dohaem [(py)
2
Fe
II
(OEOP)]Cl, Ishizu and coworkers [38]
detected the one-electron reduced form of (py)
2
Fe
II
(OEOP),
and formulated it as the p neutral radical {(py)
2
Fe
II
(OEOP)
•
}. They also reported that, when the electro-
chemical reduction was carried out in the presence of
dioxygen, ring rupture took place and an open-chain poly
pyrrole iron complex was produced. The absorption
spectrum of the p neutral radical showing peaks at 439
and 740 nm closely resembles the dithionite-reduced form
of the verdohaem-HO-1 complex, which shows absorption
peaks at 431 and 795 nm (Figs 4A and 6A). Exposure of the
dithionite-reduced form to air gave a biliverdin-iron chelate-
like compound. Thus, the dithionite-reduced form is
thought to correspond to the p neutral radical obtained in
the (py)
2
Fe
II
(OEOP) system. Ishizu and coworkers pro-
posed that the p neutral radical may be an intermediate in
the haem decomposition process. However it should be
noted that such a species is never seen in the physiological
haem degradation driven by cytochrome P450 reductase
(Figs 5 and 7).
In conclusion, we find that, depending upon the recon-
stitution conditions, the complex of ferric a-hydroxyhaem
Fig. 7. Spectral change during the degradation of synthetic verdohaem
bound to rHO-1 caused by the NADPH-cytochrome P450 reductase
system. (A) Spectra were recorded after additions of 0 (–), 1.1, 1.7, 2.6
(ÆÆÆ), and 3.3 eq (spectrum a, - - -) of NADPH, in the presence of
NADPH-cytochrome P450 reductase, to the synthetic verdohaem
complexed with rHO-1. (B) The spectrum (–) is the same as spectrum a.
Spectrum b (- - -) was recorded after addition of CO. (C) The spectrum
(–) is the same as spectrum b. Several spectra (ÆÆÆ) were recorded after
exposure to air and spectrum c (- - -) is the final product.
Fig. 6. Spectral change during the degradation of synthetic verdohaem
bound to rHO-1 caused by sodium dithionite. (A) Spectra were recorded
after additions of 0 (–), 0.4, 0.6 (ÆÆÆ), and 3.8 eq (spectrum a, - - -) of
sodium dithionite to the synthetic verdohaem complexed with rHO-1.
(B) The spectrum (–) is the same as spectrum a. Spectrum b (- - -) was
recorded after addition of CO. (C) The spectrum (–) is the same as
spectrum b. Several spectra (ÆÆÆ) were recorded after exposure to air and
the spectrum c (- - -) is the final product.
Ó FEBS 2002 Conversion of a-hydroxyhaem to verdohaem by HO (Eur. J. Biochem. 269) 5237
with HO-1 can contain a substantial amount of free
a-hydroxyhaem and this can lead to an incorrect interpret-
ation of the nature of the enzyme-assisted conversion
of a-hydroxyhaem to verdohaem. The reaction product of
a-hydroxyhaem complex with a stoichiometric amount of
O
2
is ferrous verdohaem and is never a ferric porphyrin
cation radical. Ferrous verdohaem bound to HO appears to
be relatively unstable and may be easily oxidized by excess
O
2
. These results confirm the reaction mechanism previ-
ously proposed [24], in which O
2
first attacks the ring carbon
adjacent to the a-oxy group of species 1c, resulting in a
dioxygen adduct that is then rearranged to produce CO and
ferrous verdohaem. This intramolecular rearrangement is
accompanied by concomitant expulsion of an oxidizing
equivalent (Scheme 2C). At present we cannot explain the
fate of the oxidizing equivalent; some may react with HO
protein, the rest may be eliminated by continuous electron
flow from NADPH cytochrome P450 reductase. The
dithionite-reduced form of ferrous verdohaem is considered
to be a p neutral radical species that cannot be an
intermediate in the physiological degradation of haem.
Hence, the use of sodium dithionite should be avoided in the
study of the haem oxygenase reaction.
ACKNOWLEDGEMENTS
This work was supported in part by Grant-in-aid for Scientific
Research on Priority Areas (Biological Machinery (No. 13033041))
from the Ministry of Education, Culture, Sports, Science and
Technology of Japan, Grant-in-aid for Scientific Research (C) (No.
12670125) from the Japan Society for the Promotion of Science, Grant
00K1100 from the Ichiro Kanehara Foundation, Grant GM 55807
from the National Institutes of Health, and Grant C636 from the Welch
Foundation.
REFERENCES
1. Maines, M.D. (1997) The heme oxygenase system: a regulator of
second messenger gases. Annu. Rev. Pharmacol. Toxicol. 37, 517–
554.
2. Ryter, S.W. & Tyrrell, R.M. (2000) The heme synthesis and
degradation pathways: role in oxidant sensitivity. Heme oxyge-
nase has both pro- and antioxidant properties. Free Radic. Biol.
Med. 28, 289–309.
3. Grossman, A., Costa, A., Forsling, M.L., Jacobs, R., Kostoglou-
Athanassiou, I., Nappi, G., Navarra, P. & Satta, M.A. (1997)
Gaseous neurotransmitters in the hypothalamus. The roles of
nitric oxide and carbon monoxide in neuroendocrinology. Horm.
Metab. Res. 29, 477–482.
4. Foresti, R. & Motterlini, R. (1999) The heme oxygenase pathway
and its interaction with nitric oxide in the control of cellular
homeostasis. Free Radic. Res. 31, 459–475.
5. Dong, Z., Lavrovsky, Y., Venkatachalam, M.A. & Roy, A.K.
(2000) Heme oxygenase-1 in tissue pathology. The Yin and Yang.
Am. J. Pathol. 156, 1485–1488.
6. Cary, S.P.L. & Marletta, M.A. (2001) The case of CO signaling:
why the jury is still out. J. Clin. Invest. 107, 1071–1073.
7. Yoshida, T., Noguchi, M. & Kikuchi, G. (1980) Oxygenated form
of hemeÆheme oxygenase complex and requirement for second
electron to initiate heme degradation from the oxygenated com-
plex. J. Biol. Chem. 255, 4418–4420.
8. Ortiz de Montellano, P.R. (2000) The mechanism of heme oxy-
genase. Curr. Opin. Chem. Biol. 4, 221–227.
9. Yoshida, T., Noguchi, M., Kikuchi, G. & Sano, S. (1981)
Degradation of mesoheme and hydroxymesoheme catalyzed by
the heme oxygenase system: Involvement of hydroxyheme in the
sequence of heme catabolism. J. Biochem. (Tokyo) 90, 125–131.
10. Schuller, D.J., Wilks, A., Ortiz de Montellano, P.R. & Poulos,
T.L. (1999) Crystal structure of human heme oxygenase-1. Nat.
Struct. Biol. 6, 860–867.
11. Sugishima, M., Omata, Y., Kakuta, Y., Sakamoto, H., Noguchi,
M. & Fukuyama, K. (2000) Crystal structure of rat heme oxyge-
nase-1 in complex with heme. FEBS Lett. 471, 61–66.
12. Noguchi, M., Yoshida, T. & Kikuchi, G. (1983) A stoichiometric
study of heme degradation catalyzed by the reconstituted heme
oxygenase system with special consideration of the production of
hydrogen peroxide during the reaction. J. Biochem. (Tokyo) 93,
1027–1036.
13. Wilks, A. & Ortiz de Montellano, P.R. (1993) Rat liver heme
oxygenase. High level expression of a truncated soluble form and
nature of the meso-hydroxylating species. J. Biol. Chem. 268,
22357–22362.
14. Wilks, A., Torpey, J. & Ortiz de Montellano, P.R. (1994) Heme
oxygenase (HO-1). Evidence for electrophilic oxygen addition to
the porphyrin ring in the formation of a-meso-hydroxyheme.
J. Biol. Chem. 269, 29553–29556.
15. Ortiz de Montellano, P.R. & Wilks, A. (2001) Heme oxygenase
structure and mechanism. In Advances in Inorganic Chemistry,
Vol. 51 (Sykes, A.G., ed.), pp. 359–407. Academic Press, San
Diego.
16. Davydov, R.M., Yoshida, T., Ikeda-Saito, M. & Hoffman, B.M.
(1999) Hydroperoxy-heme oxygenase generated by cryoreduction
catalyzes the formation of a-meso-hydroxyheme as detected by
EPR and ENDOR. J. Am. Chem. Soc. 121, 10656–10657.
17. Liu, Y., Lightning, L.K., Huang, H., Moe
¨
nne-Loccoz, P., Schuller,
D.J., Poulos, T.L., Loehr, T.M. & Ortiz de Montellano, P.R. (2000)
Replacement of the distal glycine 139 transforms human heme
oxygenase-1 into a peroxidase. J. Biol. Chem. 275, 34501–34507.
18. Sano, S., Sugiura, Y., Maeda, Y., Ogawa, S. & Morishima, I.
(1981) Electronic states of iron oxyporphyrin and verdohemo-
chrome obtained by coupled oxidation of iron porphyrin. J. Am.
Chem. Soc. 103, 2888–2890.
19. Morishima, I., Fujii, H., Shiro, Y. & Sano, S. (1986) NMR studies
of metalloporphyrin radicals. Iron (II) oxohplorin radical fromed
from iron (III) meso-hydroxyoctaethylporphyrin. J. Am. Chem.
Soc. 108, 3858–3860.
20. Masuoka, N. & Itano, H.A. (1987) Radical intermediates in the
oxidation of octaethylheme to octaethylverdoheme. Biochemistry
26, 3672–3680.
21. Morishima, I., Fujii, H., Shiro, Y. & Sano, S. (1995) Studies on the
iron (II) meso-oxyporphyrin p-neutral radical as a reaction inter-
mediate in heme catabolism. Inorg. Chem. 34, 1528–1535.
22. Sano, S., Sano, T., Morishima, I., Shiro, Y. & Maeda, Y. (1986)
On the mechanism of the chemical and enzymic oxgenations of
a-oxyprotohemin IX to FeÆbiliverdin IXa. Proc. Natl Acad. Sci.
USA 83, 531–535.
23. Liu, Y., Moe
¨
nne-Loccoz, P., Loehr, T.M. & Ortiz de Montellano,
P.R. (1997) Heme oxygenase-1, intermediates in verdoheme for-
mation and the requirement for reduction equivalents. J. Biol.
Chem. 272, 6909–6917.
24. Sakamoto, H., Omata, Y., Palmer, G. & Noguchi, M. (1999)
Ferric a-hydroxyheme bound to heme oxygenase can be converted
to verdoheme by dioxygen in the absence of added reducing
equivalents. J. Biol. Chem. 274, 18196–18200.
25. Balch, A.L. (2000) Coordination chemistry with meso-hydroxyl-
ated porphyrins (oxophlorins), intermediates in heme degradation.
Coord. Chem. Rev. 200–202, 349–377.
26. Matera, K.M., Takahashi, S., Fujii, H., Zhou, H., Ishikawa, K.,
Yoshimura, T., Rousseau, D.L., Yoshida, T. & Ikeda-Saito, M.
(1996) Oxygen and one reducing equivalent are both required for
the conversion of a-hydroxyhemin to verdoheme in heme
oxygenase. J. Biol. Chem. 271, 6618–6624.
5238 H. Sakamoto et al. (Eur. J. Biochem. 269) Ó FEBS 2002
27. Migita, C.T., Fujii, H., Matera, K.M., Takahashi, S., Zhou, H. &
Yoshida, T. (1999) Molecular oxygen oxidizes the porphyrin ring
of the ferric a-hydroxyheme in heme oxygenase in the absence of
reducing equivalent. Biochim. Biophys. Acta 1432, 203–213.
28. Fuhrhop, J H., Besecke, S., Subramanian, J., Mengersen, C. &
Riesner, D. (1975) Reactions of oxophlorines and their, p.radi-
cals. J. Am. Chem. Soc. 97, 7141–7152.
29. Omata, Y., Asada, S., Sakamoto, H., Fukuyama, K. & Noguchi,
M. (1998) Crystallization and preliminary X-ray diffraction stu-
dies on the water soluble form of rat heme oxygenase-1 in complex
with heme. Acta Crystallogr. D54, 1017–1019.
30. Yasukochi, Y. & Masters, B.S.B. (1976) Some properties of a
detergent-solubilized NADPH-cytochrome c (cytochrome P-450)
reductase purified by biospecific affinity chromatography. J. Biol.
Chem. 251, 5337–5344.
31. Sakamoto, H., Omata, Y., Adachi, Y., Palmer, G. & Noguchi, M.
(2000) Separation and identification of the regioisomers of ver-
doheme by reversed-phase ion-pair high-performance liquid
chromatography, and characterization of their complexes with
heme oxygenase. J. Inorg. Biochem. 82, 113–121.
32. Burleigh Jr, B.D., Foust, G.P. & Williams, S. (1969) A method for
titrating oxygen-sensitive organic redox systems with reducing
agents in solution. Anal. Biochem. 27, 536–544.
33. Palmer, G. (1977) A versatile apparatus for performing anaerobic
optical titrations with provision for mutiple sampling of the
reaction mixture. Anal. Biochem. 83, 597–608.
34. Balch, A.L., Latos-Gra
_
zzyn
´
ski, L., Noll, B.C., Olmstead, M.M. &
Zovinka, E.P. (1992) Chemistry of iron oxophlorins. 1.
1
HNMR
and structural studies of five-coodinate iron (III) complexes. Inorg.
Chem. 31, 2248–2255.
35. Balch, A.L., Koerner, R., Latos-Gra
_
zzyn
´
ski, L. & Noll, B.C. (1996)
A role for electron transfer in heme catabolism? Structure and
redox behavior of an intermediate, (pyridine)
2
Fe(octaethyl-
oxophlorin). J. Am. Chem. Soc. 118, 2760–2761.
36. Yoshida, T. & Kikuchi, G. (1978) Features of the reaction of heme
degradation catalyzed by the reconstituted microsomal heme
oxygenase system. J. Biol. Chem. 253, 4230–4236.
37. Takahashi, S., Matera, K.M., Fujii, H., Zhou, H., Ishikawa, K.,
Yoshida, T., Ikeda-Saito, M. & Rousseau, D.L. (1997) Resonance
Raman spectroscopic characterization of a-hydroxyheme and
verdoheme complexes of heme oxygenase. Biochemistry 36, 1402–
1410.
38. Tajima, K., Tada, K., Yasui, A., Ohya-Nishiguchi, H. & Ishizu,
K. (1993) Detection of octaethylverdohaem p-neutral radical by
electrochemical-optical absorption and -ESR measurements.
J. Chem. Soc. Chem. Commun. 282–284.
Ó FEBS 2002 Conversion of a-hydroxyhaem to verdohaem by HO (Eur. J. Biochem. 269) 5239