Báo cáo Y học: Structural and compositional changes in very low density lipoprotein triacylglycerols during basal lipolysis potx
Bạn đang xem bản rút gọn của tài liệu. Xem và tải ngay bản đầy đủ của tài liệu tại đây (277.7 KB, 10 trang )
Structural and compositional changes in very low density lipoprotein
triacylglycerols during basal lipolysis
Jyrki J. A
˚
gren
1,2
, Amir Ravandi
1
, Arnis Kuksis
1
and George Steiner
3
1
Banting and Best Department of Medical Research, University of Toronto, Ontario, Canada;
2
Department of Physiology,
University of Kuopio, Finland;
3
Department of Medicine and Physiology, The Toronto Hospital (General Division),
Toronto, Ontario, Canada
Triacylglycerols secreted by liver and carried by very low
density lipoprotein (VLDL) are hydrolysed in circulation by
lipoprotein and hepatic lipases. These enzymes have been
shown to have positional and fatty acid specificity in vitro.If
there were specificity in basal lipolysis in vivo, triacylglycerol
compositions ofcirculating and newly secreted VLDL would
be different. To study this we compared the composition of
normal fasting VLDL triacylglycerol of Wistar rats to that
obtained after blocking lipolysis by Triton WR1339, which
increased plasma VLDL triacylglycerol concentration about
4.7-fold in 2 h. Analyses of molecular species of sn-1,2- and
sn-2,3-diacylglycerol moieties and stereospecific triacylglyc-
erol analysis revealed major differences between the groups in
the VLDL triacylglycerol composition. In nontreated rats,
the proportion of 16:0 was higher and that of 18:2n-6 lower in
the sn-1 position. The proportion of 14:0 was lower in all
positions and that of 18:0 was lower in the sn-1 and sn-3
positions in nontreated rats whereas the proportions of
20:4n-6, 20:5n-3, 22:5n-3 and 22:6n-3 were higher in the sn-1
and lower in the sn-2 position. These results suggest that the
fatty acid of the sn-1 position is the most decisive factor in
determining the sensitivity for hydrolysis of the triacylglyc-
erol. In addition, triacylglycerol species with highly unsat-
urated fatty acids in the sn-2 position also favoured
hydrolysis. The in vivo substrate specificity followed only
partly that obtained in in vitro studies indicating that the
nature of molecular association of fatty acids in natural
triacylglycerol affects its susceptibility to lipolysis. To con-
clude, our results indicate that preferential basal lipolysis
leads to major structural differences between circulating and
newly secreted VLDL triacylglycerol. These differences
extend beyond those anticipated from analysis of total fatty
acids and constitute a previously unrecognized feature of
VLDL triacylglycerol metabolism.
Keywords: diacylglycerols; enantiomers; hydrolysis; stereo-
specific analysis; reverse isomers.
1
Very low density lipoprotein (VLDL) secreted from liver is
the major carrier of triacylglycerols in the fasting state and
its assembly, secretion and hydrolysis have been extensively
studied [1–3]. It has been generally assumed that the
triacylglycerol composition of circulating VLDL resembles
that of the VLDL newly secreted by the liver, although very
few studies have examined the effects of basal lipolysis on
circulating VLDL.
VLDL triacylglycerols are hydrolysed by lipoprotein and
hepatic lipases [4]. These enzymes have been shown to have
positional and fatty acid specificity in vitro [5,6]. However,
most studies concerning substrate specificity have been
performed with human or bovine milk lipoprotein lipase
using chylomicrons or synthetic triacylglycerols, including
alkyl ethers, as substrates [5–8]. The properties of human
and bovine milk lipoprotein lipase may differ [9] as may the
properties of milk and endothelial lipoprotein lipase [10].
Because the biosynthesis of intestinal chylomicron and
hepatic triacylglycerols proceed along different routes [11],
structurally dissimilar triacylglycerols would have been
subject to endogenous lipolysis during clearance of post-
prandial chylomicron triacylglycerols and of VLDL triacyl-
glycerols further complicating the interpretation of earlier
results.
Previous studies [12–14] have shown that Triton WR1339
(a nonionic detergent) blocks lipolysis by inhibition of
lipoprotein and hepatic lipases, which leads to accumulation
of VLDL triacylglycerols. In one study [15], the fatty acid
composition of serum lipids was shown to differ between
control serum and serum collected 6 h after Triton injection.
However, only the major fatty acids were measured in
serum total triacylglycerols, while the fatty acids of liver
triacylglycerols were not determined. As Triton WR1339
has been shown to disturb lysosomal lipolysis in liver [16], it
is possible that prolonged treatment had affected the fatty
acid composition directed by the liver to the VLDL
assembly. Short-term injections of Triton WR1339 have
given no indication of ill effects [17–19].
The present study was carried out to confirm in vivo the
nonrandomness of the basal lipolysis demonstrated in vitro
and to establish the extent to which the newly secreted
VLDL triacylglycerol is modified during circulation. We
limited treatment with Triton WR1339 to 2 h, which did not
induce changes in the fatty acid composition of liver
triacylglycerol. The results showed significant differences in
the VLDL triacylglycerol composition between control and
Triton-treated animals.
Correspondence to J. A
˚
gren, Department of Physiology,
University of Kuopio, P.O.B. 1627, FIN70211 Kuopio, Finland.
Fax: +358 17 163112, Tel.: +358 17 163091,
E-mail: Jyrki.Agren@uku.fi
Abbreviations: VLDL, very low density lipoprotein; NEU, naphthyl
ethyl urethane.
(Received 18 September 2002, accepted 31 October 2002)
Eur. J. Biochem. 269, 6223–6232 (2002) Ó FEBS 2002 doi:10.1046/j.1432-1033.2002.03341.x
MATERIALS AND METHODS
Animal procedures
2
Male Wistar rats weighing 300–350 g and maintained on
standard chow and 12-h light/dark cycle (07.00, 19.00 hours)
were used (n ¼ 10). In the experimental day food was
removed at 08.00 hours and rats were anesthetized with
Somnatol (50 mgÆkg
)1
) at 12.00 hours. A cannula was
inserted into femoral vein and Triton WR1339 (600 mgÆkg
)1
)
or saline was injected (12.30–13.00 hours). Two hours
after injection blood was drawn and rats were killed by
heart puncture. The blood samples were taken into 5%
EDTA and plasma was immediately separated by centrifu-
gation. Plasma was overlaid with a NaCl solution
(d ¼ 1.006 gÆmL
)1
) and VLDL was separated by ultracen-
trifugation at 37 000 r.p.m. in a 70.1 Ti rotor (Beckman) for
16 h at 16 °C. Livers were removed and stored at )70 °C. All
experiments were performed under protocols approved by
the Animal Care Committee and the University of Toronto.
Separation of triacylglycerols
Lipids from VLDL and liver samples were extracted with
chloroform/methanol (2:1, v/v) [20]. Triacylglycerols were
separated by TLC on silica gel H plates using heptane/
isopropyl ether/acetic acid (60 : 40 : 4, v/v/v) as the devel-
oping solvent. The triacylglycerol band was scraped off,
extracted in chloroform/methanol (2 : 1) and stored in
chloroform at )20 °C.
Analysis of fatty acid methyl esters
Triacylglycerols were subjected to acidic methanolysis using
6% H
2
SO
4
in methanol at 80 °C for 2 h. The fatty acid
methyl esters were extracted with hexane and analysed by
capillary gas chromatograph (HP 5880, Hewlett-Packard)
using a 15-m SP-2380 column (0.25 mm i.d., 0.20 lmfilm
thickness).
Plasma VLDL neutral lipid profile
Neutral lipids were separated from total lipid extract using a
silica Sep-Pak column (Waters) [21] and their profile was
determined with capillary GC [22]. Samples were silylated
with pyridine/trimethylchlorosilane (1 : 1) and extracted
with hexane before injection into 8 M HP-5 column
(Hewlett-Packard; 0.30 mm i.d., 0.25 lm film thickness).
The oven temperature was programmed from 40 to 150 °C
at 30 °CÆmin
)1
and to 340 °Cat10°CÆmin
)1
.
Preparation of diacylglycerols and their naphthyl ethyl
urethane (NEU) derivatives
Plasma VLDL and liver triacylglycerols were partially
deacylated to sn-1,2, sn-2,3 and sn-1,3 diacylglycerols by
Grignard reaction and products were immediately deriva-
tized [23,24]. Diacylglycerols were dissolved in dry toluene
(0.3 mL) and (R)-(–)-1-(1-naphthyl)ethyl isocyanate (10 lL)
and 4-pyrrolidinopyrridine (4 mg) were added. The mixture
was heated at 50 °C overnight. After evaporation of
solvents with nitrogen stream the reaction products were
dissolved in methanol/water (95 : 5) and applied to Sep-Pak
C18 column (Waters), which had been solvated with the
same solvent. Further 15 mL of this solvent was passed
through the column and NEU derivatives were then eluted
with acetone (10 mL).
HPLC/ESI/MS of diacylglycerols
The sn-1,2 and sn-2,3-diacylglycerols were separated [24]
and analysed as diastereomeric NEU derivatives with a
Waters 550 HPLC connected through a Waters 990
photodiode array detector to a Hewlett-Packard 5989A
quadrupole mass spectrometer equipped with a nebulizer-
assisted electrospray interface. Two normal phase silica gel
columns (Supelcosil LC-Si, 5 lm, 25 cm · 4.6 mm i.d.,
Supelco Inc., Bellefonte, PA, USA) in series were used and
0.37% isopropanol in hexane was used as a mobile phase at
a flow rate of 0.7 mLÆmin
)1
. Positive chemical ionization
was obtained by postcolumn addition of chloroform/
methanol/30% ammonium hydroxide (75 : 24.5 : 0.5, v/v)
at 0.6 mLÆmin
)1
. The capillary exit voltage was 220 V and
the mass range scanned was m/z 500–720. The relative
proportions of diacylglycerol species were calculated from
the areas of the single ion plots obtained from the mass
spectra. NEU derivatives of VLDL diacylglycerols were
collected after HPLC separation. A sufficient amount of
sample for fatty acid analyses was obtained from three
Triton-treated and two nontreated rats.
Almost complete separation of sn-1,2 and sn-2,3-diacyl-
glycerol was obtained as their R-forms of NEU derivatives.
However, a part of 38 and 40 acyl carbon sn-1,2-diacyl-
glycerol eluted concurrently with sn-2,3-diacylglycerol. For
example, 16:1–22:6 sn-1,2-diacylglycerol was separated into
two peaks (indicating a separation on the basis fatty acid
location in diacylglycerol), and the first one eluted with the
sn-2,3-diacylglycerol fraction. There was, however, overlap
with the corresponding sn-2,3-diacylglycerol species only in
few cases and these values were corrected using the results
from the runs of (S)-form NEU derivatives. Also sn-1,3
diacylglycerols were separated but they were not used for
calculations because this fraction has been reported to be
readily contaminated by isomerization [25].
Stereospecific analysis and calculations
The stereospecific positional distribution of the fatty acids
was determined by calculation from the fatty acid compo-
sition of total triacylglycerols and the sn-1,2- and sn-2,3-
diacylglycerols recovered from a HPLC separation as
described by Yang and Kuksis [26]. The molecular associ-
ation of the fatty acids and reverse isomer content of the
triacylglycerol and the derived sn-1,2- and sn-2,3-diacyl-
glycerols were determined by calculation on the basis of the
knowledge of the fatty acid composition of the sn-1, sn-2
and sn-3 positions of the acylglycerols, assuming 1-random,
2-random and 3-random distribution [27]. The molecular
associations give the exact pairs of fatty acids in individual
diacylglycerol and the exact triplets of fatty acids in
individual triacylglycerol.
Statistics
The values have been expressed as mean ± SD. The
Mann–Whitney U-test was used for comparisons of groups.
6224 J. J. A
˚
gren et al. (Eur. J. Biochem. 269) Ó FEBS 2002
RESULTS
Effect of Triton WR1339 on plasma and VLDL triacyl-
glycerol levels
Plasma and VLDL triacylglycerol concentrations were
4.8 ± 0.8 and 4.4 ± 0.9 mmolÆL
)1
in Triton-treated and
1.4 ± 0.2 and 0.9 ± 0.2 mmolÆL
)1
in nontreated rats,
respectively. This shows that blocking lipolysis by Triton
WR1339 increased plasma and VLDL triacylglycerol levels
about 3.5 and 4.7 times in 2 h, respectively. On the
presumption that the VLDL triacylglycerol concentration
in Triton-treated rats was the same as in nontreated rats
before injection it could be estimated that VLDL contained
at least 80% unmodified triacylglycerol in the Triton-treated
group. This percentage could be also somewhat higher if
there has been any removal of VLDL particles during the
treatment. The very small amount of VLDL diacylglycerol
(0.2 ± 0.0% of neutral lipids) in Triton-treated rats indi-
cate also a minor contribution of modified VLDL. Prelimi-
nary studies showed linear increase of plasma triacylglycerol
concentration at least for 4 h after Triton injection.
However, 4-h treatment was found to affect the fatty
acid composition of liver triacylglycerols, and a similar
tendency was observed in overnight fasted rats with 2-h
Triton treatment. To avoid this effect on liver triacylgly-
cerols, and possibly on secreted triacylglycerol composition,
a shorter food deprivation period was used in the present
study. The increase of VLDL triacylglycerol concentration
was identical to that seen in overnight fasted rats and also
the neutral lipid profiles of VLDL fractions were similar
indicating that chylomicrons did not contribute to the
VLDL fraction.
Neutral lipid profile of VLDL
There were statistically significant differences in the neutral
lipid profile between Triton-treated and nontreated rats
(Table 1). The relative amounts of free cholesterol, choles-
terol esters and diacylglycerols were greater and those of
total triacylglycerols were smaller in nontreated rats. In
addition, the proportions of 50 and 54 acyl carbon
triacylglycerols were lower and those of 56 and 58 acyl
carbon triacylglycerols were higher in nontreated compared
with Triton-treated rats.
Fatty acid composition of VLDL and liver
The proportions of saturated fatty acids in the total VLDL
triacylglycerols were lower in nontreated rats, with the
exception of slightly higher proportion of 16:0 (Table 2).
The levels of 18:1n-9, 18:2n-6 and 20:4n-6 were similar in
both groups whereas the proportions of 16:1n-7, 18:1n-7
and 18:3n-3 were lower, and those of 20:3n-6, 20:5n-3,
22:5n-3 and 22:6n-3 were higher in nontreated rats. There
were no significant differences in the liver triacylglycerol
fatty acid composition between the groups although two
rats in the Triton-treated group with lower proportions of
polyunsaturated fatty acids caused some differences in the
mean values. These rats did not differ, however, from the
other Triton-treated rats in their VLDL fatty acid compo-
sition.
Molecular species of
sn
-1,2 and
sn
-2,3-diacylglycerols
There were statistically significant differences between the
groups in about half of the measured sn-1,2- and sn-2,3-
diacylglycerol species (Table 3). In nontreated rats there was
less 16:0–16:1 and 16:1–16:1 in both sn-1,2- and sn-2,3-
diacylglycerols and less 18:0–18:1 and 18:1–18:2 in the
sn-1,2-diacylglycerols and 16:0–18:2 and 16:1–18:2 in the
sn-2,3-diacylglycerols whereas the proportion of 16:0–18:1
was higher in the sn-1,2-diacylglycerols. In addition, the
proportions of 16:0–20:4 and 16:0–20:5 were lower and
those of diacylglycerol species with a combination of
18- and 22-acyl carbon fatty acids were higher in both
sn-1,2- and sn-2,3-diacylglycerols in nontreated rats. A small
amount of 20:5–22:6 was also found in the sn-2,3-diacyl-
glycerols and its level was higher in nontreated rats.
There were not significant differences in the sn-1,2 and
sn-2,3-diacylglycerol composition of liver triacylglycerols
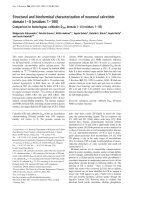
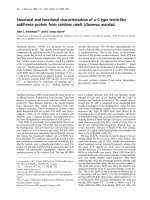
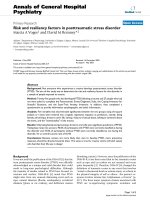
between the groups. Compared with VLDL the proportions
of 16:0–16:0, 16:0–18:0 and 16:0–18:1 were higher and those
of 16:0–18:2, 16:0–20:4 and 16:0–20:5 were lower in the liver
sn-1,2-diacylglycerol (Fig. 1A). In the sn-2,3-diacylglycerols
the proportions of 16:0–18:0, 16:0–18:1 and 18:0–18:1 were
higher and those of 16:0–20:4 and most species containing
22:6n-3 were lower in the liver than in the VLDL
triacylglycerols (Fig. 1B).
Positional distribution of VLDL triacylglycerol
fatty acids
Positional analyses of VLDL triacylglycerol fatty acids
showed that the lower proportions of most saturated fatty
acids (14:0, 15:0, 17:0 and 18:0) in nontreated rats were
mainly caused by their lower proportions in the positions
sn-1 and sn-3 (Table 4). In contrast, the proportion of major
saturated fatty acid, 16:0, was higher in the sn-1 position in
nontreated rats. The proportions of major 20- and 22-acyl
carbon fatty acids were higher in the sn-1 position and lower
in the sn-2 position in nontreated rats.
Table 1. Composition of plasma VLDL neutral lipids in Triton-treated
and nontreated rats. Neutral Lipids were separated from total lipid
extracts by solid phase extraction and analysed by GLC. Results are
expressed as mass percentages and are mean ± SD for each group of
five rats.
Triton-treated Nontreated
Cholesterol 4.5 ± 0.4 4.0 ± 0.3
Cholesterol esters 2.2 ± 0.4 3.6 ± 0.5
c
C16 0.6 ± 0.1 1.0 ± 0.1
b
C18 1.6 ± 0.2 2.6 ± 0.3
c
Diacylglycerols 0.2 ± 0.0 1.2 ± 0.4
c
Triacylglycerols 93.1 ± 0.5 91.1 ± 0.7
c
C48 (+ C49) 3.2 ± 0.8 2.9 ± 0.5
C50 (+ C51) 13.2 ± 1.3 11.0 ± 0.6
b
C52 33.8 ± 1.3 33.5 ± 1.2
C54 20.6 ± 0.7 18.4 ± 0.7
c
C56 17.2 ± 0.9 19.2 ± 0.9
b
C58 5.1 ± 0.5 6.1 ± 0.5
c
Statistical comparison between the groups:
a
P < 0.05;
b
P < 0.02;
c
P < 0.01.
Ó FEBS 2002 Modification of VLDL triacylglycerols by lipolysis (Eur. J. Biochem. 269) 6225
The proportions of some major VLDL triacylglycerol
species and their reverse isomers, calculated on the basis of
stereospecific positional distribution of fatty acids, are
presented in Table 5. In nontreated rats, the proportions of
most triacylglycerol species with 50 or fewer acyl carbons or
containing 18:0 were lower. Otherwise the fatty acid in the
sn-1 position seemed to have greatest influence on hydro-
lysis. The proportions of triacylglycerol species with 18:2
were mostly lower, and those with 16:0 were higher in
nontreated rats whereas there were not much difference in
the species with 18:1 in the sn-1 position. In addition, the
proportions of triacylglycerol species with 20:4, 20:5, 22:5 or
22:6 in the sn-1 position were higher in nontreated rats.
DISCUSSION
Effect of Triton WR1339 on lipoprotein metabolism
The effect of Triton WR1339 on VLDL secretion rates has
been extensively investigated [17] and the developed meth-
odology applied in recent studies [18,19] assessing the effects
of genetic manipulation of the secretion of apoB-48 and
apoB-100 containing VLDL. In the present study we
investigated the effect of basal lipolysis on plasma VLDL
triacylglycerols by comparing the composition of VLDL
triacylglycerols under normal physiological conditions to
that obtained after Triton WR1339 treatment. In addition
to blocking triacylglycerol lipolysis by inhibition of lipo-
protein and hepatic lipases [12,14], Triton WR1339 has also
other effects on plasma and liver lipid metabolism. It has
been reported to incorporate preferentially into the high
density lipoprotein particles displacing especially apolipo-
protein A-I [28]. Apolipoprotein B or lipids were not
displaced from low density lipoprotein (LDL) particles
indicating that neither should there be marked association
of Triton to newly secreted VLDL particles containing
mainly apolipoprotein B. Triton accumulates also in liver
lysosomes disturbing the lysosomal hydrolysis of VLDL
[16]. This may change the fatty acid composition of secreted
VLDL due to possible depletion of cellular triacylglycerol
stores and increased use of phospholipids as a source of
triacylglycerol fatty acids [29] during prolonged Triton
treatment. To minimize these effects we used only a 2 h
treatment and were able to obtain VLDL fraction with 4.7
times greater triacylglycerols concentration than in non-
treated rats. Although the possibility of unknown side-
effects of Triton treatment cannot be ruled out, none of the
known effects of Triton WR1339 gives reason to suppose
that it had affected the composition of accumulated VLDL
triacylglycerols in circulation. Furthermore, similar fatty
acid compositions of liver triacylglycerols and phospholi-
pids (data not shown) in both groups indicate that the
composition of secreted VLDL triacylglycerols was not
affected by Triton WR1339 during the treatment.
The effect of lipolysis on plasma VLDL neutral lipids in
nontreated rats was evident from a reduced triacylglycerol
and increased diacylglycerol proportion. The higher pro-
portion of cholesterol esters in nontreated rats could also
result from the removal of triacylglycerols. However, the
proportion of free cholesterol was not higher in nontreated
rats indicating that the ratio cholesterol ester : cholesterol in
VLDL is modified in the circulation and that Triton
treatment affects these events also. It was shown earlier that
lecithin cholestrol acyltransferase activity is decreased as
Triton WR1339 displaces apolipoprotein A-I in the high
density lipoprotein particles [28] but its other possible effects
on cholesterol metabolism or transfer are unknown. The
greater proportion of 54 and 56 acyl carbon triacylglycerols,
Table 2. Fatty acid composition of VLDL and liver triacylglycerols. Fatty acid methyl esters were prepared from VLDL and liver triacylglycerols by
acidic methanolysis and analysed by GLC. Results are expressed as mole percentages and are mean ± SD for five rats per group.
Triton-treated
VLDL Liver
Triton-treated Nontreated Triton-treated Nontreated
14:0 1.5 ± 0.3 1.0 ± 0.1
c
1.4 ± 0.2 1.3 ± 0.2
15:0 0.8 ± 0.1 0.6 ± 0.1
c
0.8 ± 0.2 0.7 ± 0.1
16:0 27.0 ± 0.4 27.8 ± 0.4
a
31.2 ± 2.8 29.5 ± 1.7
17:0 0.5 ± 0.1 0.4 ± 0.0
c
0.6 ± 0.1 0.5 ± 0.1
18:0 3.5 ± 0.7 2.5 ± 0.3
a
3.3 ± 0.6 3.6 ± 0.7
16:1n-9 0.6 ± 0.1 0.5 ± 0.1 0.7 ± 0.1 0.7 ± 0.2
16:1n-7 2.8 ± 0.3 2.0 ± 0.5
a
2.8 ± 0.8 1.8 ± 0.6
18:1n-9 24.8 ± 1.0 24.9 ± 0.7 26.1 ± 1.6 23.9 ± 1.5
18:1n-7 3.7 ± 0.1 3.2 ± 0.3
c
4.7 ± 0.4 3.7 ± 0.8
20:1n-9 + 11 0.4 ± 0.1 0.4 ± 0.1 0.4 ± 0.1 0.3 ± 0.1
18:2n-6 21.6 ± 1.0 21.8 ± 1.3 17.6 ± 1.7 20.5 ± 2.1
18:3n-3 1.3 ± 0.1 1.0 ± 0.1
c
0.8 ± 0.1 0.9 ± 0.2
20:2n-6 0.3 ± 0.1 0.4 ± 0.0 0.4 ± 0.1 0.4 ± 0.0
20:3n-6 0.4 ± 0.1 0.7 ± 0.2
a
0.4 ± 0.1 0.5 ± 0.1
20:4n-6 1.7 ± 0.1 1.7 ± 0.2 1.6 ± 0.2 2.0 ± 0.4
20:5n-3 1.5 ± 0.1 1.7 ± 0.1
a
0.8 ± 0.2 1.2 ± 0.4
22:4n-6 0.4 ± 0.1 0.5 ± 0.2 0.4 ± 0.1 0.5 ± 0.1
22:5n-3 1.8 ± 0.2 2.2 ± 0.3
a
1.6 ± 0.5 2.2 ± 0.6
22:6n-3 5.3 ± 0.4 6.7 ± 1.1
b
4.3 ± 1.5 5.6 ± 0.8
Statistical comparison between the groups:
a
P < 0.05;
b
P < 0.02;
c
P < 0.01.
6226 J. J. A
˚
gren et al. (Eur. J. Biochem. 269) Ó FEBS 2002
containing most of the 20- and 22-carbon fatty acids in
plasma VLDL [30] of nontreated rats corresponds with the
differences observed in the fatty acid and enantiomeric
diacylglycerol composition.
Specificity of endogenous lipases
Lipoprotein and hepatic lipases hydrolyse VLDL triacyl-
glycerols and they have been shown to have positional
specificity for the sn-1 ester of triacylglycerol [5,31,32]. Using
purified human milk lipoprotein lipase and a synthetic
triacylglycerol mixture [5], the relative order of fatty acid
release was 18:1 > 18:3 > 18:2 > 14:0 > 16 > 0 > 18:0.
The observation of preferential hydrolysis of 18:2n-6 over
16:0 in the sn-1 position as well as the lower proportions of
14:0 and 18:3n-3 in the VLDL triacylglycerol of nontreated
rats are in accordance with these results. On the other hand,
the proportion of 18:0, which would have been expected to
be most resistant to hydrolysis, was lower in nontreated rats.
Furthermore, no preference for 18:1n-9 was seen in the
present study. This discrepancy could be due to the fact that
in the in vitro studies monoacid triacylglycerols were used,
e.g. tristearoyl- and trioleoylglycerol, whereas natural
triacylglycerols would have a more varied fatty acid
distribution. The results obtained indicate that the accessi-
bility of triacylglycerol to lipase is determined by both the
nature of the fatty acid and its position and association with
other fatty acids in the triacylglycerol molecule.
In keeping with the above discussion, greater differences
were found between the treated and nontreated groups of
Table 3. The proportions of sn-1,2 and sn-2,3 diacylglycerols from plasma VLDL triacylglycerols. NEU derivatives of diacylglycerols were prepared
after partial deacylation of plasma VLDL triacylglycerols and they were separated and analysed by HPLC/MS as described in Methods. Results are
expressed as mean ± SD for five rats per group.
C:DB Diacylglycerol species
sn-1,2 sn-2,3
Triton-treated Nontreated Triton-treated Nontreated
30:0 14:0–16:0 0.8 ± 0.3 0.4 ± 0.2
a
0.3 ± 0.1 0.3 ± 0.1
30:1 14:0–16:1 0.6 ± 0.2 0.4 ± 0.1 0.3 ± 0.1 0.2 ± 0.1
32:0 16:0–16:0 4.8 ± 0.9 4.6 ± 0.3 2.5 ± 0.5 2.1 ± 0.4
32:1 16:0–16:1 4.9 ± 0.5 3.6 ± 0.2
c
2.5 ± 0.3 2.0 ± 0.3
a
32:2 16:1–16:1 2.3 ± 0.3 1.3 ± 0.1
c
1.1 ± 0.2 0.7 ± 0.1
b
33:0 16:0–17:0 + 15:0–18:0 0.6 ± 0.2 0.6 ± 0.1 0.3 ± 0.1 0.3 ± 0.1
33:1 16:1–17:0 + 15:0–18:1 1.4 ± 0.2 1.1 ± 0.1
a
0.6 ± 0.1 0.5 ± 0.1
34:0 16:0–18:0 2.2 ± 0.2 2.2 ± 0.7 1.6 ± 0.1 1.3 ± 0.2
34:1 16:0–18:1 + 16:1–18:0 19.3 ± 0.9 22.3 ± 0.8
c
7.0 ± 0.4 6.5 ± 0.5
34:2 16:0–18:2 + 16:1–18:1 21.7 ± 1.1 22.4 ± 0.5 9.4 ± 0.5 7.9 ± 0.5
c
34:3 16:1–18:2 + 16:0–18:3 6.5 ± 0.8 7.0 ± 0.9 4.5 ± 0.4 3.6 ± 0.2
c
34:4 16:1–18:3 + 14:0–20:4 0.8 ± 0.1 0.4 ± 0.1
c
0.6 ± 0.1 0.3 ± 0.0
c
35:1 17:0–18:1 + 15:0–20:1 0.9 ± 0.0 1.1 ± 0.1
b
0.4 ± 0.1 0.6 ± 0.2
35:2 17:0–18:2 + 15:0–20:2 1.2 ± 0.1 1.2 ± 0.1 0.9 ± 0.1 0.9 ± 0.2
35:3 17:0–18:3 + 15:0–20:3 0.5 ± 0.0 0.7 ± 0.1
c
0.4 ± 0.2 0.6 ± 0.2
36:0 18:0–18:0 0.5 ± 0.1 0.4 ± 0.1 0.5 ± 0.1 0.4 ± 0.1
36:1 18:0–18:1 2.6 ± 0.2 2.1 ± 0.1
c
2.3 ± 0.3 2.1 ± 0.4
36:2 18:1–18:1 + 18:0-18-2 7.4 ± 0.3 6.2 ± 0.7 13.0 ± 1.2 13.4 ± 1.0
36:3 18:1–18:2 8.8 ± 0.3 7.4 ± 0.3
c
16.0 ± 1.6 16.7 ± 0.7
36:4 18:2–18:2 + 18:1–18:3 2.7 ± 0.3 2.3 ± 0.2 4.1 ± 0.4 4.1 ± 0.6
36:4 16:0–20:4 1.7 ± 0.3 1.1 ± 0.1
c
5.1 ± 0.3 4.2 ± 0.3
c
36:5 16:0–20:5 0.9 ± 0.3 0.5 ± 0.2
a
2.2 ± 0.1 1.8 ± 0.1
c
38:2 18:0–20:2 + 18:1–20:1 0.5 ± 0.1 0.7 ± 0.2 0.9 ± 0.1 1.2 ± 0.2
a
38:3 18:0–20:3 + 18:1–20:2 +18:2–20:1 0.8 ± 0.1 1.1 ± 0.3 1.4 ± 0.1 2.0 ± 0.3
c
38:4 16:0–22:4 0.6 ± 0.3 0.5 ± 0.1 0.8 ± 0.3 1.1 ± 0.1
a
38:4 18:0–20:4 + 18:1–20:3 +18:2–20:2 0.6 ± 0.1 0.9 ± 0.1
c
1.3 ± 0.1 2.0 ± 0.1
c
38:5 16:0–22:5 + 16:1–22:4 0.6 ± 0.2 0.8 ± 0.1 1.8 ± 0.5 2.2 ± 0.2
38:5 18:0–20:5 + 18:1–20:4 +18:2–20:3 0.6 ± 0.1 0.9 ± 0.1
c
0.9 ± 0.1 1.2 ± 0.1
b
38:6 16:0–22:6 + 16:1–22:5 0.9 ± 0.3 0.9 ± 0.1 2.1 ± 0.3 2.0 ± 0.3
38:6 18:1–20:5 + 18:2–20:4 0.3 ± 0.1 0.4 ± 0.1
b
0.4 ± 0.1 0.6 ± 0.2
38:7 16:1–22:6 0.4 ± 0.1 0.6 ± 0.1 0.9 ± 0.2 0.7 ± 0.1
40:4 18:0–22:4 0.0 ± 0.0 0.1 ± 0.1
c
0.2 ± 0.1 0.3 ± 0.1
40:5 18:0–22:5 + 18:1–22:4 0.1 ± 0.0 0.3 ± 0.1
c
1.1 ± 0.1 1.3 ± 0.3
40:6 18:0–22:6 + 18:1–22:5 0.3 ± 0.1 0.8 ± 0.2
c
3.1 ± 0.3 3.7 ± 0.2
c
40:7 18:1–22:6 + 18:2–22:5 0.7 ± 0.2 1.4 ± 0.2
c
5.3 ± 0.8 6.2 ± 0.4
a
40:8 18:2–22:6 0.4 ± 0.1 1.0 ± 0.1
c
3.3 ± 0.4 3.9 ± 0.4
a
40:9 18:3–22:6 0.1 ± 0.1 0.3 ± 0.1
c
0.8 ± 0.1 0.8 ± 0.1
42:11 20:5–22:6 ND ND 0.1 ± 0.0 0.3 ± 0.1
c
Statistical comparison between the groups:
a
P < 0.05;
b
P < 0.02;
c
P < 0.01.
Ó FEBS 2002 Modification of VLDL triacylglycerols by lipolysis (Eur. J. Biochem. 269) 6227
animals in the sn-1,2-diacylglycerol moieties of VLDL
triacylglycerols in the present study. Stereospecific analysis
and calculations of molecular associations of fatty acids
indicated that expressly the fatty acid in the sn-1 position
affected the susceptibility to hydrolysis. The comparison of
the proportions of triacylglycerol species like 16:0–18:1–
18:2, 16:0–18:2–18:1, 16:0–18:2–18:2 and 18:2–18:1–18:1
and their reverse isomers suggest that from these triacyl-
glycerols, 18:2n-6 is the most readily hydrolysed major fatty
acid in the sn-1 position, while 16:0 is the most resistant.
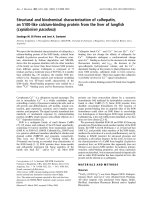
Differences in the calculated diacylglycerol species between
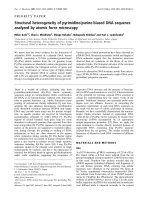
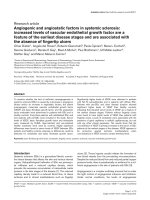
the groups support also this conclusion. Fig. 2A shows
measured and calculated proportions of 16:0–18:2 (+ 16:1–
18:1) in the sn-1,2-diacylglycerols. In addition, the propor-
tions of reverse isomers (16:0–18:2 and 18:2–16:0) have been
presented. It could be seen that measured and calculated
proportions were very similar and that there was no
difference between the groups. There were, however, clearly
more 16:0–18:2 and less 18:2–16:0 in nontreated rats.
Similar examination of 18:1–18:2 indicates that its smaller
proportion in nontreated rats was due to differences in 18:2–
18:1 whereas the values for 18:1–18:2 were about the same
(Fig. 2B). These findings demonstrate that the modification
of circulating VLDL triacylglycerols by basal lipolysis is
only partly revealed by the analysis of fatty acid composi-
tion because of the uncertainty of the origin of each fatty
acid.
Previous work has reported that the polyunsaturated 20-
and 22-acyl carbon fatty acids of human chylomicrons are
released by bovine milk lipoprotein lipase more slowly than
the shorter chain fatty acids [7], and that 22:6n-3 is released
more readily than 20:4n-6 or 20:5n-3 [7,33]. On the other
hand, human chylomicrons enriched with polyunsaturated
fatty acids were hydrolysed faster by human milk lipopro-
tein lipase than chylomicrons containing more saturated
fatty acids [34]. In the present study, triacylglycerol species
containing highly unsaturated fatty acids were also differ-
entially affected by lipolysis. In the sn-1,2 diacylglycerol the
Fig. 1. Proportions of selected sn-1,2-diacylglycerol (A) and sn-2,3-
diacylglycerol (B) species derived from VLDL and liver triacylglycerols
of Triton-treated rats. NEU derivatives of sn-1,2- and sn-2,3-diacyl-
glycerols derived from VLDL and liver triacylglycerols were analysed
by HPLC/MS as described in Materials and methods. Results are
expressed as mean ± SD. Statistical comparison between VLDL and
liver: *P <0.05.
Table 4. Positional distribution of fatty acids in plasma VLDL triacylglycerols. Fatty acid compositions of sn-1,2- and sn-2,3-diacylglycerols
recovered from the HPLC separation were determined from three Triton-treated and two nontreated rats. Stereospecific positional distribution of
fatty acids was calculated from diacylglycerol and total triacylglycerol fatty acid compositions. Results are expressed as mean ± SD.
Triton-treated Nontreated
sn-1 sn-2 sn-3 sn-1 sn-2 sn-3
14:0 2.4 ± 0.7 0.7 ± 0.2 1.7 ± 0.6 1.5 ± 0.5 0.4 ± 0.1 1.0 ± 0.3
15:0 1.2 ± 0.3 0.7 ± 0.2 0.4 ± 0.1 0.8 ± 0.4 0.5 ± 0.4 0.5 ± 0.2
16:0 51.4 ± 3.9 18.8 ± 3.3 10.8 ± 3.0 57.6 ± 2.2 16.8 ± 2.7 8.8 ± 1.2
17:0 0.7 ± 0.2 0.6 ± 0.1 0.3 ± 0.2 0.4 ± 0.2 0.7 ± 0.2 0.1 ± 0.0
18:0 4.5 ± 1.3 3.6 ± 1.7 2.9 ± 0.9 1.9 ± 1.1 3.6 ± 0.3 1.5 ± 0.3
16:1n-9 0.3 ± 0.2 1.2 ± 0.3 0.2 ± 0.2 0.6 ± 0.2 0.6 ± 0.2 0.4 ± 0.1
16:1n-7 4.2 ± 0.3 0.4 ± 0.3 3.3 ± 0.3 2.6 ± 0.2 0.5 ± 0.1 4.0 ± 0.7
18:1n-9 12.4 ± 0.6 31.0 ± 0.8 30.1 ± 2.7 11.9 ± 2.8 34.0 ± 0.8 30.4 ± 1.6
18:1n-7 4.0 ± 0.3 0.9 ± 0.4 6.4 ± 0.4 3.8 ± 0.5 0.3 ± 0.1 5.9 ± 0.1
20:1n-9 + 11 0.1 ± 0.1 0.6 ± 0.4 0.6 ± 0.3 ) 0.2 ± 0.1 1.1 ± 0.2 0.2 ± 0.2
18.2n-6 15.8 ± 2.7 33.0 ± 1.9 17.9 ± 1.1 10.7 ± 3.3 34.8 ± 2.5 18.6 ± 0.4
18:3n-3 0.6 ± 0.3 2.0 ± 0.8 1.5 ± 0.6 0.6 ± 0.1 2.1 ± 0.3 0.4 ± 0.5
20:2n-6 0.1 ± 0.0 0.5 ± 0.3 0.4 ± 0.1 0.0 ± 0.1 0.6 ± 0.2 0.6 ± 0.0
20:3n-6 0.1 ± 0.0 0.6 ± 0.2 0.5 ± 0.2 0.5 ± 0.1 0.2 ± 0.2 1.1 ± 0.3
20:4n-6 0.0 ± 0.1 2.6 ± 0.6 2.4 ± 0.8 0.2 ± 0.1 2.0 ± 0.3 2.5 ± 0.3
20:5n-3 0.4 ± 0.2 1.2 ± 0.2 2.8 ± 0.4 1.3 ± 0.1 0.3 ± 0.1 3.8 ± 0.2
22:4n-6 0.0 ± 0.2 0.6 ± 0.4 0.4 ± 0.2 ) 0.2 ± 0.5 0.9 ± 0.2 0.6 ± 0.2
22:5n-3 0.4 ± 0.2 0.5 ± 0.4 4.4 ± 0.7 1.7 ± 0.3 0.2 ± 0.1 4.7 ± 0.1
22:6n-3 1.3 ± 0.6 0.8 ± 0.5 13.0 ± 0.2 4.5 ± 0.3 0.4 ± 0.1 14.8 ± 0.9
6228 J. J. A
˚
gren et al. (Eur. J. Biochem. 269) Ó FEBS 2002
content of 16:0–20:4 and 16:0–20:5 was lower in nontreated
than in treated rats, whereas the content of species with the
combination of 18 and 20 or 22-acyl carbon fatty acid were
higher. Positional analysis revealed higher proportions of
major 20- and 22-acyl carbon fatty acids in the sn-1 position
and lower proportions in the sn-2 position in nontreated
rats. These results indicate that the presence of both 20- and
22-acyl carbon polyunsaturated fatty acids in the sn-1, and
possibly also in the sn-3, but not in the sn-2 position of
VLDL triacylglycerol retards the hydrolysis. This would
explain the divergent changes in the diacylglycerol moieties
containing these fatty acids, and possibly also the differences
found in the studies with VLDL and chylomicrons as the
positional distribution of fatty acids is not similar in these
lipoproteins. VLDL triacylglycerol is derived from liver
cytosolic triacylglycerol through hydrolysis and reesterifica-
tion, and possibly by lipolysis from cellular phospholipids
[29,30,35] The major source of chylomicron triacylglycerol
is the 2-monoacylglycerol pathway in which original dietary
fatty acids are retained in the sn-2 position, e.g. 22:6n-3 in
fish oils [26]. This means that, in addition to difference
between VLDL and chylomicrons, there could be also
substantial differences in the distribution of polyunsaturated
fatty acids within chylomicrons depending on the relative
contribution of endogenous and dietary fatty acids and on
the nature of dietary lipids.
Contrary to retarding hydrolysis when located in the sn-1
position of VLDL triacylglycerol, 20- and 22-acyl carbon
fatty acids in the sn-2 position seemed to advance lipolysis.
It could be speculated that these fatty acids affect the
structure of triacylglycerol molecule in a way that facilitates
the action of lipolytic enzymes. It is also possible that
hepatic lipase has a specific role in hydrolysis of triacylgly-
cerol species with these fatty acids. It has been shown
that the hydrolysis of 20:4 containing triacylglycerol and
diacylglycerol was slower in rat postheparin plasma when
hepatic lipase was inhibited [36]. Hepatic lipase is capable of
hydrolysing fatty acids from the sn-1 position of phospho-
lipids, and so it may have some preference also for
triacylglycerol species with a phospholipid-like combination
of fatty acids in the sn-1 and sn-2 positions. In other studies,
polyunsaturated long chain fatty acids containing a double
bond at carbons 4 and 5 were observed to be relatively
resistant to hydrolysis by pancreatic lipase in vitro [37]
although such resistance was not seen in vivo [38].
Structural differences between liver and VLDL
triacylglycerols
Compositions of sn-1,2 and sn-2,3-diacylglycerol moieties of
liver triacylglycerols resembled those of VLDL triacylgly-
cerols but there were also some clear differences (data not
shown). It has been suggested that major part of the stored
liver triacylglycerol is hydrolysed, mostly to sn-1,2-diacyl-
glycerol, and reesterified before entering VLDL triacylgly-
cerol [30,35]. This would expose especially the sn-3 position
to modifications. In Triton-treated rats sn-2,3-diacylglycer-
ols from VLDL triacylglycerols contained less saturated and
monounsaturated 34- and 36-acyl carbon species and more
species with highly unsaturated fatty acids, especially
22:6n-3, than sn-2,3-diacylglycerols from liver triacylglycer-
ols. This indicates substitution of 20- and 22-carbon polyun-
saturated fatty acids for 16:0 and 18:1 when liver tria-
cylglycerol is used in VLDL triacylglycerol synthesis. There
were differences also in the sn-1,2-diacylglycerols between
VLDL and liver triacylglycerol in Triton-treated rats
suggesting that liver triacylglycerols are partly hydrolysed
to sn-2,3-diacylglycerol when used for VLDL triacylglycerol
Table 5. Content of major calculated molecular species and their reverse isomers in VLDL triacylglycerols. The molecular associations of fatty acids
and reverse isomer content of triacylglycerols were calculated from the compositions of fatty acids in the sn-1, sn-2 and sn-3 positions of
triacylglycerols.
Written isomer Reverse isomer
Triton-treated Nontreated Triton-treated Nontreated
16:0–16:0–18:1 3.53 3.51 0.34 0.23
16:0–18:1–16:0 1.77 1.74
16:0–18:1–18:1 5.98 7.17 0.57 0.47
16:0–18:2–16:0 1.83 1.76
18:0–18:1–18:1 0.52 0.24 0.15 0.02
16:0–18:1–18:2 2.94 3.67 0.54 0.32
16:0–18:2–18:1 6.19 7.28 0.59 0.48
18:1–18:1–18:1 1.93 1.95
16:0–18:2–18:2 3.04 3.72 0.56 0.32
18:1–18:2–18:1 2.00 1.98
18:2–18:1–18:1 1.84 1.33 0.95 1.00
16:0–16:0–22:6 1.26 1.43 0.03 0.07
16:0–18:1–22:6 2.13 2.92 0.04 0.14
18:1–16:0–22:6 0.41 0.39 0.09 0.27
16:0–18:2–22:6 2.21 2.97 0.05 0.14
18:2–16:0–22:6 0.39 0.27 0.04 0.14
18:1–18:1–22:6 0.69 0.80 0.15 0.56
18:1–18:2–22:6 0.71 0.81 0.16 0.57
18:2–18:1–22:6 0.66 0.54 0.07 0.29
18:2–18:2–22:6 0.68 0.55 0.08 0.29
Ó FEBS 2002 Modification of VLDL triacylglycerols by lipolysis (Eur. J. Biochem. 269) 6229
synthesis. It has been found earlier that 10% of liver-free
diacylglycerol is sn-2,3-diacylglycerol [30]. Another possible
source for these differences is the use of phospholipids for
VLDL triacylglycerol synthesis [29]. As liver phospholipids
contain more polyunsaturated fatty acids, and especially
20:4n-6, than triacylglycerols, this would be consistent with
the lower level of saturated species and higher content of
16:0–20:4 in the sn-1,2-diacylglycerols of VLDL triacylgly-
cerols.
Physiological significance of nonrandom lipolysis
of VLDL
The nonrandom lipolysis may have significant meaning for
the trafficking of fatty acids. The lower proportions of 14:0,
15:0, 17:0, 18:0, 16:1n-7 and 18:1n-7 in circulating VLDL
triacylglycerols could indicate that they were directed
towards oxidation. With the exception of 18:0, this would
be in accordance with their lower proportions in other lipid
fractions. The preferential liberation of 18:2n-6 from the
sn-1 position may also have importance in the regulation of
its utilization. The behavior of 20- and 22-acyl carbon
polyunsaturated fatty acids differs from that of other fatty
acids as well as from each other. The levels of 20:5n-3 are
more rapidly changed by dietary modification than those of
22:6n-3 and in plasma it is directed more efficiently to
phospholipids whereas 22:6n-3 prefers triacylglycerols [39].
On the other hand, 22:6n-3 is better preserved and its
amount is relatively high in plasma and tissue lipids even
when dietary supply is low [39]. In the present study, 22:5n-3
and 22:6n-3 showed clear resistance to hydrolysis when
locatedinthesn-1 and sn-3 positions. This may serve as a
mechanism to preserve and direct the utilization of these
fatty acids. It was shown previously that 20:4, 20:5 and 22:6
accumulated in diacylglycerols and monoacylglycerols when
chylomicrons were incubated with lipoprotein lipase [7].
Thus, the decrease of 20:4n-6, 20:5n-3, 22:5n-3 and 22:6n-3
in the sn-2 position observed in our study could be also a
consequence of hydrolysis only in the primary position
leaving them to diacylglycerols and monoacylglycerols; the
direction of these glycerols may contribute to the divergent
distribution of polyunsaturated fatty acids.
In view of the marked difference in the composition of the
triacylglycerols of nascent and circulating VLDL, some
speculation would seem to be justified about the physiolo-
gical significance of their nonrandom lipolysis. The general
preferential hydrolysis of the unsaturated triacylglycerols
may be related to their higher solubility. However, a retrieval
of the essential fatty acids, which may have facilitated the
VLDL secretion, could also be involved. The preferential
attack on the sn-1-position may serve to avoid flooding of the
lipoprotein and cell membrane surfaces with sn-1,2-diacyl-
glycerols, which may promote glycerolipid resynthesis as well
as compromise the sn-1,2-diacylglycerol signalling pathway.
Furthermore, formation of sn-2,3-diacylglycerols may pre-
vent their accumulation on the lipoprotein surfaces because
of stereochemical incompatibility. Other hypotheses could be
advanced about a preferential release of the saturated and
monounsaturated fatty acids for the purposes of oxidation as
well as about special metabolic roles of specific molecular
species of diacylglycerols or triacylglycerols.
In conclusion, the results of this study show that the basal
lipolysis causes significant modifications in the fatty acid
Fig. 2. Measured and calculated proportions of (A) 16:0–18:2 and (B)
18:1–18:2 in the sn-1,2-diacylglycerol moieties of VLDL triacylglycerols
in Triton-treated and nontreated rats. Measured proportions were
obtained from HPLC/MS analyses of sn-1,2-diacylglycerols and cal-
culated proportions from the calculation of molecular association of
fatty acids. The fatty acid in the sn-1 position is on the left in the
abbreviated notation of molecular species. The first two columns in A
(measured and calculated 16:0–18:2 + 18:2–16:0) contain also 16:1–
18:1 + 18:1–16:1. Statistical comparison between the groups (mea-
sured proportions): *P <0.01.
6230 J. J. A
˚
gren et al. (Eur. J. Biochem. 269) Ó FEBS 2002
distribution of circulating VLDL triacylglycerols. Triacyl-
glycerol species containing 16:0 or 20–22-acyl carbon
polyunsaturated fatty acids in the sn-1 position were more
resistant to hydrolysis than those with 18:2 in this position.
In contrast, triacylglycerol species with 20–22-acyl carbon
polyunsaturated fatty acids in the sn-2 position were
hydrolysed more readily than those with other fatty acids
in this position. There were also differences in the triacyl-
glycerol composition of newly secreted VLDL triacylgly-
cerols and liver triacylglycerols, which could be explained as
resulting from a hydrolysis–reesterification processes of
triacylglycerols and/or involvement of phospholipids in the
VLDL triacylglycerol formation.
3
REFERENCES
1. Gibbons, G.F. (1990) Assembly and secretion of very-low-density
lipoprotein. Biochem. J. 268, 1–13.
2. Rusinol, A., Verkade, H. & Vance, J.E. (1993) Assembly of rat
hepatic very low density lipoproteins in the endoplasmic
reticulum. J. Biol. Chem. 268, 3555–3562.
3. Goldberg, I.J. (1996) Lipoprotein lipase and lipolysis: central roles
in lipoprotein metabolism and atherogenesis. J. Lipid Res. 37, 693–
707.
4. Peterson, J., Olivecrona, T. & Bengtsson-Olivecrona, G. (1985)
Distribution of lipoprotein lipase and hepatic lipase between
plasma and tissues: effect of hypertriglyceridemia. Biochem.
Biophys. Acta 837, 262–270.
5. Wang, C.S., Kuksis, A. & Manganaro, F. (1982) Studies on the
substrate specificity of purified human milk lipoprotein lipase.
Lipids 17, 278–284.
6. A
˚
kesson, B., Gronowitz, S., Herslo
¨
f, B., Michelsen, P. &
Olivecrona, T. (1983) Stereospecificity of different lipases. Lipids
18, 313–318.
7. Ekstro
¨
m, B., Nilsson, A
˚
.&A
˚
kesson, B. (1989) Lipolysis of
polyenoic fatty acid esters of human chylomicrons by lipoprotein
lipase. Eur. J. Clin. Nutr. 19, 259–264.
8. Wang, C.S., Hartsuck, J. & McConathy, W.J. (1992) Structure
and functional properties of lipoprotein lipase. Biochem. Biophys.
Acta 1123, 1–17.
9. Goldberg, I.J., Blaner, W.S. & Goodman, D.S. (1986)
Immunologic and enzymatic comparisons between human and
bovine lipoprotein lipase. Arch. Biochem. Biophys. 244, 580–584.
10. Paltauf, F. (1983) Ether lipids as substrates for lipolytic enzymes.
In: Ether Lipids (Mangold, H.K. & Paltauf, F., eds), pp. 211–229.
Academic Press, New York.
11. Kuksis, A. & Lehner, R. (2001) Intestinal synthesis of triacylgly-
cerols. In: Intestinal Lipid Metabolism (Mansbach,C.M.,Tso,P.&
Kuksis, A., eds), pp. 185–213. Kluwer Academic/Plenum
Publishers, New York.
12. Borensztajn, J., Rone, M.S. & Kotlar, T.J. (1976) The inhibition in
vivo of lipoprotein lipase (clearing-factor lipase) activity by triton
WR1339. Biochem. J. 156, 539–543.
13. Hermier, D., Hales, P. & Brindley, D.N. (1991) Effects of the
lipase inhibitors, Triton WR1339 and tetrahydrolipstatin, on the
synthesis and secretion of lipids by rat hepatocytes. FEBS Lett.
286, 186–188.
14. Emmison, N., Zammit, V.A. & Agius, L. (1992) Triacylglycerol
accumulation and secretion in hepatocyte cultures. Effects of
insulin, albumin and Triton WR1339. Biochem. J. 285, 655–660.
15. Orba
´
n, E., Maderspach, A. & Tomori, E. (1980) Triton WR1339
induced changes in the fatty acid composition of serum lipids in
rats. Biochem. Pharmacol. 29, 2879–2882.
16. Hayashi, H., Shitara, M. & Yamasaki, F. (1982) The origin of
lipid accumulated in liver lysosomes after administration of triton
WR1339. J. Biochem. 92, 1585–1590.
17. Li, X., Catalina, F., Grundy, S.M. & Patel, S. (1996) Method to
measure apolipoprotein B-48 and B-100 secretion rates in an
individual mouse: evidence for a very rapid turnover of VLDL and
preferential removal of B-48 relative to B-100-containing lipo-
proteins. J. Lipid Res. 37, 210–220.
18. Mesenkamp, A.R., Jong, M.C., van Goor, H., van Luyn, M.J.A.,
Bloks, V., Havinga, R., Voshol, P.J., Hofker, M.H., van Dijk,
K.W., Havekes, L.M. & Kuipers, F. (1999) Apolipoprotein E
participates in the regulation of very low density lipoprotein-tri-
glyceride secretion by the liver. J. Biol. Chem. 274, 35711–35718.
19. Maugeais, C., Tietge, U.J.F., Tsukamoto, K., Glick, J.M. &
Rader, D.J. (2000) Hepatic apolipoprotein E expression promotes
very low density lipoprotein-apolipoprotein B production in vivo
in mice. J. Lipid Res. 41, 1673–1679.
20. Folch, J., Lees, M. & Sloane Stanley, G.H. (1957) A simple
method for the isolation and purification of total lipides from
animal tissues. J. Biol. Chem. 226, 497–509.
21. Hamilton, J.G. & Comai, K. (1984) Separation of neutral lipids
and free fatty acids by high-performance liquid chromatography
using low wavelenght ultraviolet detection. J. Lipid Res. 25, 1142–
1148.
22. Myher, J.J. & Kuksis, A. (1984) Determination of plasma total
lipid profiles by capillary gas-liquid chromatography. J. Biochem.
Biophys. Meth 10, 13–23.
23. Christie, W.W., Nikolova-Damyanova, B., Laakso, P. & Herslo
¨
f,
B. (1991) Stereospecific analysis of triacyl-sn-glycerols via resolu-
tion of diastereomeric diacylglycerol derivatives by high-perfor-
mance liquid chromatography on silica. J. Am. Oil Chem. Soc. 68,
695–701.
24. A
˚
gren, J.J. & Kuksis, A. (2002) Analysis of diastereomeric DAG
naphthylethylurethanes by normal-phase HPLC with on-line
electrospray MS. Lipids 37, 613–619.
25. Brockerhoff, H. (1971) Stereospecific analysis of triglycerides.
Lipids 6, 942–956.
26. Yang, L.Y. & Kuksis, A. (1991) Apparent convergence (at
2-monoacylglycerol level) of phosphatidic acid and 2-mono-
glycerol pathways of synthesis of chylomicron triacylglycerols.
J. Lipid Res. 32, 1173–1186.
27. Yang, L.Y., Kuksis, A. & Myher, J.J. (1995) Biosynthesis of
chylomicron triacylglycerols by rats fed glyceryl or alkyl esters of
menhaden oil fatty acids. J. Lipid Res. 36, 1046–1057.
28. Yamamoto, K., Shen, B., Zarins, C. & Scanu, A.M. (1984) In vitro
and in vivo interactions of Triton 1339 with plasma lipoproteins of
normolipidemic rhesus monkeys. Arteriosclerosis 4, 418–434.
29. Wiggins, D. & Gibbons, G.F. (1996) Origin of hepatic very-
low-density lipoprotein triacylglycerol: the contribution of cellular
phospholipids. Biochem. J. 320, 673–679.
30. Yang, L.Y., Kuksis, A., Myher, J.J. & Steiner, G. (1995) Origin of
triacylglycerol moiety of plasma very low density lipoproteins in
the rat: structural studies. J. Lipid Res. 36, 125–136.
31. Morley, N. & Kuksis, A. (1972) Positional specificity of lipopro-
tein lipase. J. Biol. Chem. 247, 8389–6393.
32. A
˚
kesson, B., Gronowitz, S. & Herslo
¨
f, B. (1976) Stereospecificity
of hepatic lipases. FEBS Lett. 71, 241–244.
33. A
˚
gren, J.J., Vidgren, H., Valve, R., Laakso, M. & Uusitupa, M.
(2001) Postprandial responses of individual fatty acids in subjects
homozygous for threonine or alanine encoding allele in codon 54
of the intestinal fatty acid binding protein 2 gene. Am.J.Clin.
Nutr. 73, 31–35.
34. Weintraub, M.S., Zechner, R., Brown, A., Eisenberg, S. &
Breslow, J.L. (1988) Dietary polyunsaturated fats of the w-6 and
w-3 series reduce postprandial lipoprotein levels. J. Clin. Invest. 82,
1884–1893.
35. Wiggins, D. & Gibbons, G.F. (1992) The lipolysis/esterifica-
tion cycle of hepatic triacylglycerol, its role in the secretion of very
low-density lipoprotein and its response to hormone and sulpho-
nylureas. Biochem. J. 284, 457–462.
Ó FEBS 2002 Modification of VLDL triacylglycerols by lipolysis (Eur. J. Biochem. 269) 6231
36. Nilsson, A
˚
., Landin, B. & Schotz, M.C. (1987) Hydrolysis of
chylomicron arachidonate and linoleate ester bonds by lipoprotein
lipase and hepatic lipase. J. Lipid Res. 28, 510–517.
37. Bottino, R., Vanderburg, G.A. & Reiser, R. (1967) Resistance of
certain long-chain polyunsaturated fatty acids of marine oils to
pancreatic lipase hydrolysis. Lipids 2, 489–493.
38. Yang, L Y., Kuksis, A. & Myher, J.J. (1990) Lipolysis of men-
haden oil triacylglycerols and the corresponding fatty acid alkyl
esters by pancreatic lipase in vitro: a reexamination. J. Lipid Res.
31, 137–148.
39. Vidgren, H.M., A
˚
gren, J.J., Schwab, U., Rissanen, T., Ha
¨
nninen,
O. & Uusitupa, M.I.J. (1997) Incorporation of n-3 fatty acids into
plasma lipid fractions, and erythrocyte membranes and platelets
during dietary supplementation with fish, fish oil, and doc-
osahexaenoic acid-rich oil among healthy young men. Lipids 32,
697–705.
6232 J. J. A
˚
gren et al. (Eur. J. Biochem. 269) Ó FEBS 2002