Báo cáo Y học: Purification and characterization of two secreted purple acid phosphatase isozymes from phosphate-starved tomato (Lycopersicon esculentum) cell cultures ppt
Bạn đang xem bản rút gọn của tài liệu. Xem và tải ngay bản đầy đủ của tài liệu tại đây (268.49 KB, 9 trang )
Purification and characterization of two secreted purple acid
phosphatase isozymes from phosphate-starved tomato
(
Lycopersicon esculentum
) cell cultures
Gale G. Bozzo
1
, Kashchandra G. Raghothama
3
and William C. Plaxton
1,2
Departments of
1
Biology and
2
Biochemistry, Queen’s University, Kingston, Ontario, Canada;
3
Department of Horticulture and
Landscape Architecture, Purdue University, Indiana, USA
Two secreted acid phosphatases (SAP1 and SAP2) were
markedly up-regulated during P
i
-starvation of tomato
suspension cells. SAP1 and SAP2 were resolved during cat-
ion-exchange FPLC of culture media proteins from 8-day-
old P
i
-starved cells, and purified to homogeneity and final
p-nitrophenylphosphate hydrolyzing specific activities of 246
and 940 lmol P
i
producedÆmin
)1
mgÆprotein
)1
, respect-
ively. SDS/PAGE, periodic acid-Schiff staining and analyt-
ical gel filtration demonstrated that SAP1 and SAP2,
respectively, exist as 84 and 57 kDa glycosylated monomers.
SAP1 and SAP2 are purple acid phosphatases (PAPs) as
they displayed an absorption maximum at 518 and 538 nm,
respectively, and were not inhibited by
L
-tartrate. The
respective sequence of a SAP1 and SAP2 tryptic peptide was
very similar to a portion of the deduced sequence of several
putative Arabidopsis thaliana PAPs. CNBr peptide mapping
indicated that SAP1 and SAP2 are structurally distinct. Both
isozymes displayed a pH optimum of approximately pH 5.3
and were heat stable. Although they exhibited wide substrate
specificities, the V
max
of SAP2 with various phosphate-esters
was significantly greater than that of SAP1. SAP1 and SAP2
were activated by up to 80% by 5 m
M
Mg
2+
, and demon-
strated potent competitive inhibition by molybdate, but
mixed and competitive inhibition by P
i
, respectively. Inter-
estingly, both SAPs exhibited significant peroxidase activity,
which was optimal at approximately pH 8.4 and insensitive
to Mg
2+
or molybdate. This suggests that SAP1 and SAP2
may be multifunctional proteins that operate: (a) PAPs that
scavenge P
i
from extracellular phosphate-esters during P
i
deprivation, or (b) alkaline peroxidases that participate in
the production of extracellular reactive oxygen species dur-
ing the oxidative burst associated with the defense response
of plants to pathogen infection.
Keywords: phosphate starvation (plants); acid phosphatase
(purple); peroxidase; Lycopersicon esculentum.
Acid phosphatases (APs; orthophosphoric-monoester phos-
phohydrolase) catalyze the hydrolysis of a broad and
overlapping range of P-monoesters with a pH optimum
below pH 7.0 [1]. APs are ubiquitous and abundant in
plants, animals, fungi, and bacteria. They are believed to
function in the production, transport and recycling of P
i
,
which is crucial for cellular metabolism and energy trans-
duction processes. Eukaryotic APs exist as tissue- and/or
cellular compartment-specific isozymes that display vari-
ation in subunit M
r
, substrate specificity, localization and
sensitivity to inhibition by various divalent cations and
metabolites [1,2].
Control of plant AP expression is mediated by a variety
of environmental and developmental factors [2]. APs are
induced under various stresses, such as water deficiency,
salinity stress, and nutritional P
i
-deficiency [2,3]. Plant AP
activity is also abundant in storage tubers, ripening fruit,
and germinating seeds [2,4,5]. APs can be distinguished
based on relative substrate specificities, and are categorized
as one of the following: (a) nonspecific AP, having no clear
substrate specificity; and (b) APs having defined but
nonabsolute substrate specificity [2]. The latter type may
play a specific metabolic role. For example, phytase is an AP
induced during seed germination that preferentially utilizes
phytic acid, a major seed phosphorus storage compound.
Another specialized plant AP is phosphoenolpyruvate
phosphatase, hypothesized to function as an inducible
glycolytic bypass reaction to the ADP-limited pyruvate
kinase during P
i
-stress [6,7].
The induction of AP is a universal response of vascular
plants to P
i
starvation [2]. P
i
is a critical macronutrient that
limits plant growth in many natural ecosystems [7,8]. Soil P
i
is often chelated to inorganic mineral cations, or is bound
organically, and therefore is not directly available for plant
uptake. A correlation exists between intracellular and/or
extracellular AP activity and cellular P
i
status [2,7]. An
increase in secreted AP and P
i
-uptake activity is believed to
assist in the acquisition of limiting P
i
from the environment
by P
i
-deficient (–P
i
) plants [7,8]. Secreted APs are likely
involved in P
i
scavenging from extracellular organic
P-monoesters [7–9]. P
i
starvation inducible secreted APs
have been documented in tomato suspension cell cultures
Correspondence to W. C. Plaxton, Department of Biology,
Queen’s University, Kingston, Ontario, Canada K7L 3 N6,
Fax: + 1 613 533 6617, Tel.: + 1 613 533 6150,
E-mail:
Abbreviations: AP, acid phosphatase; pNPP, p-nitrophenylphosphate;
PAP, purple acid phosphatase; +P
i
and –P
i
,P
i
-sufficient and
P
i
-deficient, respectively; ROS, reactive oxygen species;
SAP, secreted acid phosphatase.
Enzymes: acid phosphatase (EC 3.1.3.2); pyruvate kinase
(EC 2.7.1.40); peroxidase (EC 1.11.1.7).
(Received 6 June 2002, revised 5 September 2002,
accepted 4 November 2002)
Eur. J. Biochem. 269, 6278–6286 (2002) Ó FEBS 2002 doi:10.1046/j.1432-1033.2002.03347.x
and roots [10,11], white-lupin proteoid roots [12], and
Arabidopsis thaliana seedlings [13]. Cell wall localized APs
are associated with P
i
-starvation of white clover [14],
Brassica nigra suspension cells [15], and duckweed [16].
The cell wall-localized AP from –P
i
B. nigra suspension cells
appeared to be identical to an AP secreted into the cell
culture media [15], whereas the glycosylphosphatidyl-
anchored AP from duckweed was demonstrated to be a
purple AP (PAP) [17].
PAPs represent a distinct class of nonspecific AP
containing binuclear transition metal centers [1,18–21].
PAPs are characterized by their purple color in solution
and insensitivity to inhibition by
L
-tartrate [1,18,21]. Plant
PAPs purified to date exist as 110 kDa homodimers [19,22–
24], whereas mammalian PAPs are generally 35 kDa
monomers [19]. Moreover, plant PAPs contain a Fe(III)–
Zn(II) or Fe(III)–Mn(II) binuclear transition metal center,
but mammalian PAPs typically contain a Fe(III)–Fe(II)
unit in their active site [20]. A number of plant genes
putatively encoding low M
r
PAPs have been identified [25].
Recent studies indicate that PAPs may also display peroxi-
dase activity, which has been hypothesized to function in the
production of reactive oxygen species (ROS) during the
hypersensitive defense response of animals and plants
[24,26].
Several reports have documented the identification and
partial characterization of APs from –P
i
tomato plants or
suspension cell cultures [10,11,27]. Tadano and Sakai [28]
reported the secretion of significant AP activity from the
roots of –P
i
tomato and lupin, which was greater than most
crop species tested under similar conditions. A 130-kDa
homodimeric secreted AP was purified from –P
i
L. esculen-
tum roots, and was found to have comparable kinetic
properties to a homodimeric AP secreted from –P
i
lupin
roots [11]. Recently, Baldwin and coworkers [27] isolated a
cDNA sequence encoding a putative 30 kDa AP (LePS2)
from –P
i
tomato roots. The subcellular localization and
physiological role of LePS2 have yet to be elucidated. Bosse
and Ko
¨
ck [29] reported similar P
i
-starvation inducible acid
hydrolases for tomato seedlings and suspension cell cultures.
A 57-kDa AP was partially purified from the cell culture
medium of 3-day-old –P
i
tomato suspension cells [10], but a
thorough kinetic and structural characterization was not
performed. In the present study, we report the purification
and detailed comparison of two distinct PAP isozymes from
the culture media of –P
i
tomato suspension cells.
MATERIALS AND METHODS
Chemicals and plant material
Fractogel EMD-SO
3
–
650 (S) cation exchange resin, and KCl
were from BDH Chemicals. A Superose 12 HR10/30 column
and gel filtration M
r
standards were from Amersham
Biosciences. Acrylamide, bisacrylamide, and dithiothreitol
were from ICN Pharmaceuticals. Horseradish peroxidase
was from Roche Applied Sciences. All other chemicals were
obtained from Sigma Chemical Co. All solutions were
prepared using Milli-Q processed water. Heterotrophic
tomato (Lycopersicon esculentum, cv Moneymaker) cell
suspensions were kindly provided by E. Blumwald (Univer-
sity of California at Davis, USA), and cultured in Murashige-
Skoog media containing 2.5 m
M
P
i
as described previously
[30]. P deficiency treatments were initiated 7 days after
subculturing the cells into fresh P
i
-sufficient (+P
i
)media.
A50-mLportionof+P
i
cell suspension was centrifuged
axenically at 4000 g for 12 min at 25 °C. The cells were
washed with –P
i
media, and used to inoculate 500 mL of
fresh –P
i
media. After 8 days the –P
i
cells were harvested by
filtration through Whatman 541 filter paper on a Buchner
funnel, and the filtrate concentrated as described below.
AP assays
All assays were linear with respect to time and concentration
of enzyme assayed. One unit (U) of activity is defined as the
amount of AP resulting in the hydrolysis of 1 lmol of
substrate per min at 25 °C.
Phosphatase assay A
For routine measurements of AP activity, the hydrolysis of
phosphoenolpyruvate to pyruvate was coupled to the lactate
dehydrogenase reaction and assayed at 25 °C by monitoring
the oxidation of NADH at 340 nm using a Gilford 260
recording spectrophotometer. Standard AP assay condi-
tions were 50 m
M
Na-acetate (pH 5.3), 10 m
M
phos-
phoenolpyruvate, 5 m
M
MgCl
2
,0.2m
M
NADH, and
3UÆmL
)1
desalted rabbit muscle lactate dehydrogenase in
a final volume of 1 mL. All assays were initiated by the
addition of enzyme preparation and corrected for NADH
oxidase activity by omitting phosphoenolpyruvate from the
reaction mixture.
Phosphatase assay B
Acid-washed microtitre plates were used for all kinetic
studies. For substrates other than phosphoenolpyruvate, the
P
i
released by the AP reaction was quantified [31]. Between 1
and 10 mU of AP (determined using assay A) was
incubated in a 96-well microtitre plate in a final volume of
40 lL. Each assay contained 50 m
M
Na-acetate (pH 5.3),
5m
M
MgCl
2
and an alternative substrate (5 m
M
unless
otherwise stated). Assays were initiated by the addition of
substrate, allowed to progress for 6 min, and terminated by
the addition of 200 lL of reagent A which was prepared
daily by mixing four parts 10% (w/v) ascorbate with one
part 10 m
M
ammonium molybdate in 15 m
M
Zn-acetate
(pH 5.0). Samples were incubated for 25 min at 40 °Cand
the A
660
determined using a Spectromax 250 Microplate
spectrophotometer (Molecular Devices). Controls were run
for background amounts of P
i
present at each substrate
concentration tested. To calculate activities, a standard
curve over the range 1–100 nmol P
i
was constructed for
each set of assays.
Kinetic studies and protein concentration
determination
Apparent V
max
and K
m
values were calculated from the
Michaelis–Menten equation fitted to a nonlinear least-
squares regression computer kinetics program [32]. The I
50
values (concentration of inhibitor producing 50% inhibition
of AP activity) were determined using the aforementioned
computer kinetics program. Competitive and uncompetitive
inhibition constants are represented as K
i
and K
i
¢. K
i
values
Ó FEBS 2002 Secreted acid phosphatases of P
i
-starved tomato cells (Eur. J. Biochem. 269) 6279
were determined from Dixon plots, whereas K
i
¢ values were
determined from plots of [phosphoenolpyruvate] vs. [inhib-
itor] [33]. All kinetic parameters are the means of three
separate experiments and are reproducible within ± 10%
SE of the mean value.
Protein concentrations were determined with the Coo-
massie Blue G-250 dye-binding method [34] using bovine
c)globulin as the protein standard.
Peroxidase assay
A chemiluminescence assay was employed to determine the
capacity of the purified tomato APs to catalyze the
peroxidation of 5-aminophthalhydrazide (luminol) [35].
Chemiluminescence was recorded in a Lmax Microplate
Luminometer (Molecular Devices). The reaction was initi-
ated by the addition of 0.1 mL of 4.4 m
M
hydrogen
peroxide to 0.1 mL of 0.2
M
Tris/HCl (pH 8.1) containing
300 m
M
luminol and 5–20 n
M
of AP in a 96-well microtitre
plate. Photon emission was monitored continuously for 10 s
after H
2
O
2
addition, and expressed as relative light units
with Softmax data analysis software (Molecular Devices).
In control experiments, equimolar concentrations of BSA or
horseradish peroxidase were substituted for purified AP.
Buffers used during AP purification
Buffer A: 50 m
M
Na-acetate (pH 5.7), 1.5 m
M
MgCl
2
,
1m
M
EDTA, 1 m
M
dithiothreitol, and 10% (v/v) glycerol.
Buffer B: 25 m
M
Na-acetate (pH 5.7), 1.5 m
M
MgCl
2
,
1m
M
EDTA, 1 m
M
dithiothreitol, 100 m
M
KCl, and 10%
(v/v) glycerol. Buffer C: 25 m
M
Na-acetate (pH 5.7),
100 m
M
KCl, 1 m
M
EDTA, 1 m
M
dithiothreitol, 1.5 m
M
MgCl
2
,0.2m
M
CaCl
2
,0.2m
M
MnCl
2
, and 10% (v/v)
glycerol.
AP purification
All steps were carried out at 0–4 °C. Cell culture media from
–P
i
cells (4 L) was concentrated approximately 20-fold via
tangential ultrafiltration (Millipore Mini-tan) using 10
30 kDa MWCO regenerated cellulose plates. Concentrated
media was clarified by centrifugation at 40 000 g for
20 min. Pre-chilled ()20 °C) acetone (3 parts) was com-
bined with concentrated culture media (1 part), stirred
gently overnight, and centrifuged at 12 000 g for 25 min.
The supernatant was decanted and pellets dried under a
stream of air for 7–8 h. Acetone pellets were resuspended in
50 m
M
Na-acetate (pH 5.8) containing 1 m
M
MgCl
2
using a
Polytron (3–5 s pulses). The solution was stirred for 60 min,
clarified by centrifugation at 40 000 g for 20 min, and
loaded at 1.5 mLÆmin
)1
onto a column (1.6 · 5cm) of
Fractogel EMD SO
3
–
650 (S) cation-exchange resin that had
been connected to an A
¨
KTA FPLC system and pre-
equilibrated with buffer A. The column was washed with
buffer A until the A
280
decreased to baseline, and then
developed with a linear gradient (150 mL) of 0–500 m
M
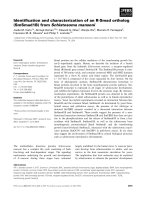
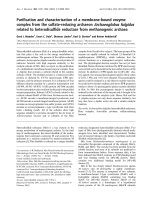
KCl in buffer A. AP activity resolved as two peaks (SAP1
and SAP2) at approximately 250 and 390 m
M
KCl,
respectively (Fig. 1). Fractions (6 mL) containing greater
than 20% of peak activity were pooled and concentrated
separately to 2 mL by ultrafiltration over a YM-30 mem-
brane (Amicon). Both samples were further concentrated to
0.25 mL using an Amicon Centricon-30 ultrafilter, and
separately applied at 0.2 mLÆmin
)1
onto a Superose 12 HR
10/30 column, which had been connected to an FPLC
system and pre-equilibrated in buffer B. Fractions (0.5 mL)
containing AP activity were pooled and concentrated to
0.2–0.5 mL as described previously. Concentrated SAP1
was divided into 25-lL aliquots, frozen in liquid N
2
and
stored at )80 °C. The final SAP1 preparation was stable for
at least 4 months when stored frozen. The concentrated
SAP2 was absorbed at 0.5 mLÆmin
)1
onto a column
(1 · 1.2 cm) of Concanavalin A-Sepharose that had been
connected to the FPLC and pre-equilibrated in buffer C.
The column was washed with 5 mL of buffer C and
developed with a linear gradient (20 mL) of 0–500 m
M
methyl a)
D
-mannopyranoside in buffer C. AP eluted as a
single peak at approximately 120 m
M
methyl a-
D
-manno-
pyranoside. Fractions (1 mL) were pooled and concentrated
to 0.5 mL using an Amicon Centricon-30 ultrafilter. The
retentate was divided into 25-lL aliquots, frozen in liquid
N
2
andstoredat)80 °C. The final SAP2 preparation was
stable for at least 5 months when stored frozen.
Estimation of native molecular mass by gel
filtration FPLC
This was performed during AP purification by Superose 12
FPLC as described above. Native M
r
was calculated from a
plot of K
d
(partition coefficient) against log M
r
using the
following protein standards: catalase (232 kDa), aldolase
(158 kDa), alcohol dehydrogenase (150 kDa), BSA
(67 kDa), ovalalbumin (43 kDa), carbonic anhydrase
(29 kDa), and ribonuclease A (13.7 kDa).
Electrophoresis
SDS/PAGE (10 and 12% separating gels) was performed as
described previously [36]. For the determination of subunit
M
r
by SDS/PAGE, a plot of relative mobility vs. the log M
r
was constructed using the following standard proteins:
myosin (200 kDa), b-galactosidase (116 kDa), phosphory-
lase B (97.5 kDa), BSA (66 kDa), ovalbumin (45 kDa), and
carbonic anhydrase (29 kDa). AP was also visualized in
acrylamide gels by staining for AP activity. SDS/PAGE was
Fig. 1. Separation of secreted AP isozymes from culture media of –P
i
tomato suspension cells via SO
3
-Fractogel cation-exchange FPLC. The
column was developed with a linear KCl gradient (0–0.5
M
)and
fractions of 6 mL were collected. AP activity eluted as two distinct
peaks (SAP1 and SAP2).
6280 G. G. Bozzo et al.(Eur. J. Biochem. 269) Ó FEBS 2002
performed as described above except that the samples were
not boiled. To detect AP activity, the gel was washed for 2 h
(three changes every 30 min) at 25 °Cinacasein–EDTA
buffer [37] in order to remove SDS. The gel was then
incubated for 1 h at 25 °C in 100 m
M
Na-acetate (pH 5.3),
followed by incubation in the same buffer containing 10 m
M
MgCl
2
,1mgÆmL
)1
Fast Garnet GBC salt, and 0.03% (w/v)
b-naphthyl-P. Carbohydrate staining was performed using
a periodic-acid Schiff staining procedure [38].
Amino acid sequencing
Purified SAP1 (2 lg)wassubjectedtoSDS/PAGEas
described above. Following PAGE the gel was incubated
for 10 min in transfer buffer (10 m
M
Caps, pH 11,
containing 10% (v/v) methanol) and electroblotted onto a
Bio-Rad poly(vinylidene difluoride) membrane for 40 min
at 250 mA. The membrane was washed in Milli-Q H
2
O,
stained for 10 min with 0.1% (w/v) Coomassie Blue R-250
in 40% (v/v) methanol and 1% (v/v) acetic acid, destained
for 10 min in 50% (v/v) methanol and 10% (v/v) acetic acid,
rinsed (5 · 2 min) with 25 mL of Milli-Q H
2
O, and air-
dried. In situ trypsin digestion and separation of tryptic
peptides was performed at the NRC Protein and Peptide
Sequencing Facility (Montreal, Quebec). SAP2 (2 lg) was
subjected to SDS/PAGE as described above, digested in situ
with trypsin, and tryptic peptides separated at the Labor-
atory for Macromolecular Structure (Purdue University).
Sequencing of SAP1 and SAP2 tryptic peptides was
performed by automated Edman degradation. Similarity
searches were conducted with the
BLAST
Program using the
Ôshort but nearly exactÕ option available on the National
Center for Biotechnology Information website [39]. Further
similarity searches were conducted using the Patmatch
BLAST
Program available on the Arabidopsis Information
Resource website ( />patmatch/nph-patmatch.pl).
Peptide mapping by CNBr cleavage
Polypeptides were excised individually from SDS/PAGE
minigels and cleaved in situ with CNBr, and the degradation
products analyzed on a SDS/PAGE 14% (w/v) minigel
[40], followed by protein staining with SYPRO Red
(Amersham Biosciences). Fluorescence imaging was per-
formed using a Typhoon 9400 Imager Workstation (Amer-
sham Biosciences).
RESULTS
Influence of P
i
starvation on growth and secreted
AP activity of tomato suspension cells
Tomato cells cultured for 8 days in the absence of exogen-
ous P
i
had only approximately 40% of the fresh weight of
the 8-day-old +P
i
cells (approximately 63 and 25 g of cells
were obtained per 500 mL culture of 8-day-old +P
i
and –P
i
cells, respectively). Eight days following subculture of the
tomato cells into –P
i
culture media, secreted (culture media)
AP activity increased from undetectable levels to a maxi-
mum of 7.5 UÆmg protein
)1
. Secreted AP activity decreased
to undetectable levels within two days of an 8-day-old –P
i
cell culture being resupplied with 2.5 m
M
P
i
. All subsequent
studies were performed using cell culture media filtrate from
8-day-old –P
i
cells. AP activity staining of 8-day-old –P
i
cell
culture filtrate proteins resolved by PAGE indicated the
presence of two P
i
-starvation inducible APs with M
r
values
of approximately 84 and 57 kDa (Fig. 2A).
AP purification
Concentration of culture media proteins secreted by –P
i
cells
was facilitated by Mini-Tan ultrafiltration followed by
acetone precipitation. This also eliminated pectic substances
that otherwise interfered with subsequent column chroma-
tography. AP activity resolved as two peaks of activity
(SAP1 and SAP2, respectively) during Fractogel cation-
exchange FPLC (Fig. 1). As outlined in Table 1, SAP1 was
purified approximately 30-fold to a final phosphoenolpru-
vate-hydrolyzing specific activity of 222 UÆmg
)1
and a
recovery of approximately 3%, whereas SAP2 was purified
50-fold to a final phosphoenolpruvate-hydrolyzing activity
of 370 UÆmg
)1
and a yield of 5%. Although SAP2 specific
activity was not increased following affinity chromato-
graphy on Concanavalin A-Sepharose (Table 1), this step
eliminated several minor impurities present following
Superose 12 FPLC (results not shown), and resulted in a
homogeneous SAP2 preparation (Fig. 2B).
Gel electrophoresis and physical properties
When the final preparations of SAP1 and SAP2 were
denatured and subjected to SDS/PAGE, single Coomassie
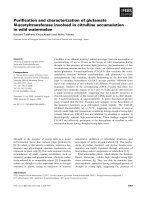
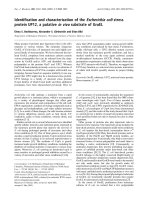
Fig. 2. PAGE analyses of purified SAP1 and SAP2. (A) Non-dena-
turing PAGE on a 10% (w/v) separating gel of AP from the media of
tomato suspension cells. Lanes 1 and 2, respectively, contain 3 lgof
culture media proteins from 8-day-old +P
i
and –P
i
cells. The gel was
incubated in a casein/EDTA wash buffer for SDS removal [37] and
stained for AP activity using Fast Garnet GBC salt and b-naphthyl-P
as described under Materials and methods. (B–D) PAGE analyses
using 12% (w/v) separating gels of purified SAP1 and SAP2. (B) Lanes
1 and 2 of the denaturing SDS gel contain 1 lg of the final prepara-
tions of SAP1 and SAP2, respectively. The gel was stained with
Coomassie Blue R-250. The migration of various M
r
standards is
shown on the left. TD, tracking dye front. (C) Lanes 1 and 2 of this
nondenaturing gel contain 0.5 lg of the final preparation of SAP1 and
SAP2, respectively. The gel was stained for AP activity following SDS
removal as described above. (D) Lanes 1 and 2 of this denaturing
SDS gel contain 2 lg of the final preparations of SAP1 and SAP2,
respectively. Glycoprotein staining was performed using a periodic
acid-Schiff procedure [38].
Ó FEBS 2002 Secreted acid phosphatases of P
i
-starved tomato cells (Eur. J. Biochem. 269) 6281
Blue-staining polypeptides of 84 and 57 kDa, respectively,
were observed (Fig. 2B). For both purified APs, nonboiled
samples resolved by SDS/PAGE followed by SDS removal
generated single protein staining polypeptides (not shown)
that comigrated with AP activity (Fig. 2C). SAP1 and SAP2
were identified as glycoproteins by periodic acid-Schiff
staining (Fig. 2D). The native M
r
of SAP1 and SAP2 was
determined by analytical gel filtration FPLC to be 82 and
60 kDa, respectively. This indicates that both APs are
monomeric.
Both APs were relatively heat stable, losing no activity
when the respective final preparations were incubated for
5minat70°C.
The concentrated final SAP1 (1 mgÆmL
)1
) and SAP2
(200 lgÆmL
)1
) preparations were pink in color and dis-
played an A
max
at 518 and 538 nm, respectively. This
suggests that both APs are PAPs [1,18].
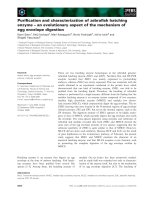
Peptide mapping and amino acid sequencing
The structural relationship between the two purified APs
was investigated by peptide mapping of their CNBr cleavage
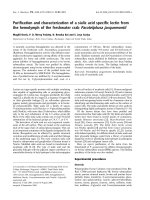
fragments. The CNBr cleavage patterns of SAP1 and SAP2
were highly dissimilar (Fig. 3).
N-terminal microsequencing of SAP1 and SAP2 was
impossible owing to N-terminal blockage of both polypep-
tides. A tryptic fragment of SAP1 and SAP2 was purified by
reverse phase HPLC and sequenced using automated
Edman degradation. A
BLAST
search of the Arabidopsis
Genome Index revealed that the respective SAP1 and SAP2
peptide sequence exhibited significant similarity to a differ-
ent pair of putative Arabidopsis PAPs (Fig. 4).
Kinetic properties
Unless otherwise stated, all kinetic studies were performed
using assay A. SAP1 and SAP2 both showed a relatively
narrow pH-phosphatase activity profile with maximal
activity occurring at approximately pH 5.3 (Fig. 5). All
subsequent AP kinetic studies were carried out at pH 5.3.
Effect of divalent cations
SAP1 and SAP2 were activated in the presence of saturating
(5 m
M
)MgCl
2
by approximately 135% and 180%, respect-
ively. When the reaction mixture contained 5 m
M
EDTA
and no added divalent cations, SAP2 activity was reduced
by approximately 71%, whereas SAP1 activity was unaf-
fected. SAP1 and SAP2 were also differentially inhibited by
various divalent metal cations. In particular, SAP2 was
potently inhibited by Co
2+
,Ba
2+
,andCa
2+
(Table 2).
Substrate specificity
AP activity was determined using assay B and a broad range
of phosphorylated compounds, tested at a concentration of
5m
M
unless otherwise specified. Neither enzyme exhibited
Table 1. Purification of secreted AP isozymes from 4-L of culture media of 8-day-old –P
i
tomato suspension cells.
Step
Volume
(mL)
Activity
(U)
Protein
(mg)
Specific activity
(UÆmg
)1
)
Purification
(fold)
Yield
(%)
Cell culture filtrate 4000 1200 160 7.5 1 100
Mini-tan concentration 270 900 120 7.5 1 100
Acetone precipitation 120 670 90 7.5 1 56
Fractogel SO
3
–
FPLC
SAP1 30 90 1.1 80 11 7
SAP2 42 141 1.4 100 13 12
Superose 12 FPLC
SAP1 3.5 40 0.18 222 30 3
SAP2 5 70 0.19 368 49 6
Concanavalin-A Sepharose
SAP2 2 59 0.16 370 49 4
Fig. 3. Electrophoretic patterns of CNBr cleavage fragments of SAP1
and SAP2. CNBr cleavage fragments were prepared from gel slices
containing 3 lgofSAP1(lane1)andSAP2(lane2)andanalyzedon
an SDS/14% PAGE minigel as previously described [40]. Peptides
were stained with SYPRO Red and image analysis performed using a
Typhoon Imaging workstation. The migration of various M
r
stand-
ardsisshownontheleft.
6282 G. G. Bozzo et al.(Eur. J. Biochem. 269) Ó FEBS 2002
phosphatase activity when tested with dihydroxyacetone-P,
P-choline, or phytate, and no phosphodiesterase activity
was observed with bis-pNPP. SAP2 showed a broader
substrate specificity profile when compared to SAP1. Unlike
SAP2, SAP1 showed no or much lower activity with the
hexose-P,triose-P,orP-amino acids that were tested
(Table 3 and results not shown).
Table 3 lists kinetic parameters of SAP1 and SAP2 for
those compounds that were identified as being the most
effective substrates. Both APs were relatively unspecific,
with maximal specificity constant (V
max
/K
m
)obtainedwith
phosphoenolpyruvate and pNPP for SAP1 and SAP2,
respectively. The apparent V
max
for similar substrates was
150–300% greater for SAP2 when compared to SAP1. Of
the physiologically relevant substrates, phosphoenolpyru-
vate, tetrapoly-P, and phenyl-P were utilized most effi-
ciently by SAP1, whereas the most efficient substrates for
SAP2 were phosphoenolpyruvate, P-Tyr, PP
i
, and tetrapoly
P (Table 3). Hyperbolic substrate saturation kinetics was
always observed. Identical apparent V
max
and K
m
values for
phosphoenolpyruvate were obtained when assay A was
substituted for assay B.
Metabolite and ion effects
A wide variety of compounds were examined for effects on
the activity of SAP1 and SAP2 with subsaturating
(approximate K
m
) concentrations of phosphoenolpyruvate
(2.1 and 1.5 m
M
, respectively). The following compounds
exerted no influence (± 10% control velocity) on the AP
activity of either isozyme:
L
-tartrate,
L
-Glu,
L
-Asp, and
phosphite (5 m
M
each); KCl, NaCl, or dithiothreitol
(125 m
M
each). Significant inhibition was exerted by
molybdate, P
i
, fluoride, and vanadate (Table 4). Inhibition
by these compounds was further characterized, and the
patterns of inhibition and inhibition constants are presented
in Table 4. For SAP1, inhibition by P
i
was mixed, whereas
for SAP2 the pattern of inhibition by P
i
was competitive.
Inhibition of SAP1 and SAP2 by molybdate and fluoride
was competitive and mixed, respectively (Table 4). More-
over, I
50
and K
i
values of SAP2 for molybdate, fluoride, and
P
i
were generally lower than the corresponding values
determined for SAP1 (Table 4).
Peroxidase activity
The ability of tomato SAP1 and SAP2 to catalyze the
peroxidation of luminol was investigated using a chemi-
luminescence assay. In the presence of luminol and H
2
O
2
,
n
M
amounts of SAP1 and SAP2 induced striking chemi-
luminescence when compared to a BSA control (results not
shown). SAP2 produced approximately 1.5-fold greater
chemiluminescence than equimolar amounts of SAP1.
Photon emission induced by SAP1 and SAP2 peroxidase
activity was proportional to their respective concentration.
SAP1 and SAP2 both showed a fairly broad pH/peroxi-
dase activity profile in the alkaline range with maximal
activity occurring at approximately pH 8.4 (Fig. 5). Calib-
ration of the luminometer with known amounts of
horseradish peroxidase (200 UÆmg protein
)1
) allowed us
to estimate the specific peroxidase activities of approxi-
mately 10 and 14 UÆmg protein
)1
for SAP1 and SAP2,
respectively. MgCl
2
,EDTA,ZnCl
2
and molybdate (5 m
M
each) exerted no influence on the peroxidase activity of
SAP1 or SAP2.
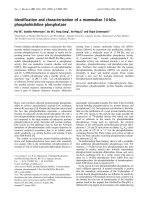
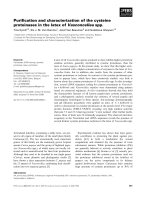
Fig. 4. Comparison of SAP1 and SAP2 tryptic peptide sequences with a
portion of the deduced amino acid sequence for several putative PAPs
from Arabidopsis t haliana. The sequence of the SAP1 and SAP2 tryptic
peptide was obtained by automated Edman degradation. Other
sequences were derived from the translation of putative PAP nucleo-
tide sequences. Swiss-Prot accession numbers are shown in paren-
theses. Numbering is relative to the first amino acid of the deduced AP
sequence, and colons indicate an amino acid residue identical to that of
the respective tomato PAP peptide sequence.
Fig. 5. Phosphatase vs. peroxidase activities of purified SAP1 and SAP2
asafunctionofassaypH.Assays were buffered by a mixture of 25 m
M
Na-acetate, 25 m
M
Mes and 25 m
M
Bis-Tris-propane. All values rep-
resent the means ± SE of n ¼ 3 separate determinations.
Table 2. Effect of various divalent metal cations and EDTA on the
activity of SAP1 and SAP2. The standard assay A was used except that
the phosphoenolpyruvate concentration was subsaturating (4 m
M
).
Enzyme activity in the presence of metal cations or EDTA (5 m
M
)is
expressed relative to the control set at 100.
Addition (5 m
M
)
Relative activity
SAP1 SAP2
MgCl
2
136 181
MnCl
2
113 74
CoCl
2
102 5
CaCl
2
104 40
ZnCl
2
00
BaCl
2
115 50
CuSO
4
98
EDTA 114 29
Ó FEBS 2002 Secreted acid phosphatases of P
i
-starved tomato cells (Eur. J. Biochem. 269) 6283
DISCUSSION
Purification and physical properties of SAP1 and SAP2
SAP1 and SAP2 were resolved by cation-exchange FPLC
and purified to final pNPP-hydrolyzing specific activities of
246 and 940 UÆmg protein
)1
, respectively (Fig. 1, Table 3).
These values are in the range reported for other homo-
genous plant APs [2,4–6,15,22,23], including PAPs from
soybean and sweet potato [20]. PAGE followed by protein
and AP activity staining confirmed that both SAPs were
purified to homogeneity (Fig. 2B,C). Analytical gel filtra-
tion FPLC, SDS/PAGE (Fig. 2B), and periodic acid-Schiff
staining (Fig. 2D) indicated that SAP1 and SAP2, respect-
ively, exist as 84 and 57 kDa monomeric glycoproteins.
SAP2 may be identical to the partially purified 57 kDa AP
from 3-day-old P
i
tomato suspension cell cultures [10].
SAP1 and SAP2 exhibited an A
max
at 518 and 538 nm,
respectively, and were insensitive to tartrate inhibition [2],
indicating that they are PAPs [1,18]. All plant PAPs that
have been studied thus far are homodimers of 55 kDa
subunits [20,22]. Thus, SAP1 and SAP2 appear to be the first
monomeric plant PAPs characterized to date. The subunit
M
r
(57 kDa) of SAP2 is within the range for previously
characterized plant PAPs, whereas SAP1 exists as an
unusual 84 kDa monomeric PAP. To our knowledge, no
other PAP having a similar subunit M
r
has been described.
A nine-amino acid tryptic peptide sequence of SAP1 was
highly similar to a portion of the deduced amino acid
sequence of two putative Arabidopsis PAPs (Fig. 4). Simi-
larly, a seven-amino acid sequence of a SAP2 peptide was
found to be highly similar to portions of two other
Arabidopsis PAPs (Fig. 4). As the analysis of the SAP1
peptide sequence identified similarity with two putative
Arabidopsis PAPs that were not identified in searches con-
ducted with the SAP2 peptide sequence, this suggests that
the two tomato PAP isoforms are structurally unrelated.
This was corroborated by the highly dissimilar CNBr
peptide maps of SAP1 and SAP2 (Fig. 3). CNBr fragmen-
tation patterns depend on the position and number of
methionine residues in the protein [40]. The results imply
that the two tomato PAPs are structurally dissimilar
isozymes encoded by separate genes.
Kinetic properties of SAP1 and SAP2
A pH-phosphatase activity profile centered at approxi-
mately pH 5.3 (Fig. 5) is consistent with the designation of
both isozymes as an AP. SAP1 and SAP2 were activated by
5m
M
Mg
2+
(Table 2), which has also been shown for
various plant APs [4–6,15]. SAP1 and SAP2 were potently
inhibited by Zn
2+
and Cu
2+
. Inhibition by Zn
2+
was
observed for APs isolated from red kidney beans [23],
potato tuber [4], banana fruit [5], and –P
i
B. nigra cells [6].
Table 3. Substrate saturation kinetics of SAP1 and SAP2. Kinetic parameters were determined using assay B as described in Materials and
methods. N.A., No activity detected with up to 5 m
M
of this metabolite.
Substrate
SAP1 SAP2
V
max
(UÆmg
)1
)
K
m
(m
M
)
V
max
/K
m
(UÆmg
)1
Æm
M
)1
)
V
max
(UÆmg
)1
)
K
m
(m
M
)
V
max
/K
m
(UÆmg
)1
Æm
M
)1
)
pNPP 246 4.5 55 940 3.3 285
b-Naphthyl-P 227 3.9 58 964 4.5 214
a-Naphthyl-P 162 6.4 25 460 5.3 87
Phosphoenolpyruvate 241 2.1 115 384 1.4 274
ATP 264 4.1 64 437 5.5 80
Phenyl-P 180 2.1 86 545 5.3 103
Tetrapoly-P 173 1.9 91 423 2.9 146
GTP 258 8.6 30 500 5.4 93
PP
i
N.A. – – 688 4.6 150
P-Tyr N.A. – – 496 2.1 236
6-phosphogluconate N.A. – – 333 4.5 74
3-phosphoglycerate N.A. – – 414 6.0 69
Glycerol-3-phosphate N.A. – – 252 5.0 50
Table 4. The effect of inhibitors, inhibition pattern and enzyme-inhibitor dissociation constants for selected inhibitors of SAP1 and SAP2. I
50
values,
patterns of inhibition and K
i
and K
i
¢ values (representing competitive and uncompetitive inhibition constants, respectively) were determined using
assay A as described under Materials and methods.
Inhibitor
SAP1 SAP2
I
50
(m
M
) Inhibition type
K
i
(m
M
)
K
i
¢
(m
M
)
I
50
(m
M
) Inhibition type
K
i
(m
M
)
K
i
¢
(m
M
)
Molybdate 0.0028 Competitive 0.0002 – 0.0015 Competitive 0.0002 –
Fluoride 2.2 Mixed 0.95 3.4 0.55 Mixed 0.48 1.6
P
i
4.5 Mixed 1.3 2.1 3.7 Competitive 1.2 –
6284 G. G. Bozzo et al.(Eur. J. Biochem. 269) Ó FEBS 2002
EDTA exerted no effect on SAP2, but caused a 71%
inhibition of SAP2 (Table 2). This suggests that only SAP2
requires divalent metal cations to be fully active. However,
our results indicate that both tomato AP isozymes are
PAPs, APs with a binuclear metallic center. Complete
removal of metal ions from the active site of kidney bean
PAP requires prolonged dialysis against EDTA at elevated
temperatures [41]. Plant PAPs containing different binuclear
metal centers have been reported [20,41,42]. It is possible
that the differential effect of divalent metal cations on the
activity of SAP1 and SAP2 is due to differing metal contents
attheactivesiteofeachisozyme.
Similar to other APs [2], SAP1 and SAP2 were subject to
potent competitive inhibition by molybdate (Table 4).
However, differing patterns of inhibition of by P
i
indicate
that some structural and/or conformational differences may
exist between SAP1 and SAP2. AP inhibition by P
i
suggests
a potential control mechanism through product inhibition
[2].
Extracellular APs usually display broad substrate speci-
ficity, whereas APs showing restricted substrate specificity
tend to be intracellular and may play a more specific role in
plant metabolism [2,4,6,15]. Although SAP1 and SAP2
demonstrated relatively nonspecific substrate selectivities, a
broader range of substrates utilization was evident in SAP2,
and this isozyme was more active with any substrate as
compared to SAP1 (Table 3). SAP1 and SAP2 were
particularly efficient at catalyzing the hydrolysis of P
i
from
substrates with good leaving groups (i.e. phosphoenolpyru-
vate, ATP, GTP, and tetrapoly P; Table 3), whereas
P-esters with poorer leaving groups (i.e. hexosephosphates)
(DG°¢ < 5000 calÆmol
)1
) [43] were not as effectively utilized.
Their nonspecific substrate specificities are consistent with
SAP1andSAP2playingaroleinP
i
scavenging from
extracellular P-esters when external P
i
levels are depleted.
Studies defining the temporal and spatial expression pattern
of SAP1 and SAP2 during P
i
-starvation (or pathogen
infection; see below) will help to confirm their precise
physiological role(s). The data presented here, in combina-
tion with studies on the regulation of other P
i
-starvation
inducible proteins including high-affinity P
i
transporters [8],
and secreted ribonuclease and phosphodiesterases [29,44]
indicate the presence of a highly coordinated response in –P
i
tomato. Cloning of the genes encoding SAP1 and SAP2 will
facilitate studies of their overexpression and molecular
regulation in an effort to increase P
i
acquisition during
P
i
-limited tomato growth.
Peroxidase activity was recently reported for Arabid-
opsis and recombinant human PAPs [24,35,45]. SAP1 and
SAP2 also displayed peroxidase activity at alkaline pH
(Fig. 5), and this activity was unaffected by potent
inhibitors of AP activity. This is reminiscent of a
mammalian PAP, where site-directed mutagenesis of
conserved residues within its active site revealed that its
AP and peroxidase activities are functionally independent
[46]. In mammals, the involvement of PAP peroxidase
activity in the generation of ROS appears to be pivotal in
processes linked to bone resorption or macrophage killing
of invading microbes [21,35,46]. Similarly, the production
of extracellular ROS is closely associated with the
Ôoxidative burstÕ that occurs during the hypersensitive
response of plants to pathogen attack [46]. It is notable
that the oxidative burst in plants is associated with
extracellular alkalinization [46]. Moreover, several plant
PAPs have been reported to be induced in response to
pathogen attack or elicitor treatment [47,48]. An A. thali-
ana PAP displaying peroxidase activity has been sugges-
ted to be involved in ROS metabolism during senescence
[24]. Future studies are required to determine whether
SAP1 and SAP2 are induced and/or play a role in ROS
production during the oxidative burst that accompanies
pathogen infection of tomato.
ACKNOWLEDGEMENTS
This work was supported by research and equipment grants from the
Natural Sciences and Engineering Research Council of Canada to
WCP, and U.S. Department of Agriculture-National Research Initiat-
ive Competitive Grants Program (grant no. 590 1165–2614) to KGR.
We are grateful to William Turner for helpful discussions.
REFERENCES
1. Vincent, J.B., Crowder, M.W. & Averill, B.A. (1992) Hydrolysis
of phosphate monoesters: a biological problem with multiple
chemical solutions. Trends Biochem. Sci. 17, 105–110.
2. Duff, S.M.G., Sarath, G. & Plaxton, W.C. (1994) The role of acid
phosphatases in plant phosphorus metabolism. Physiol. Plant. 90,
791–800.
3. Duff, S.M.G., Plaxton, W.C. & Lefebvre, D.D. (1991) Phosphate-
starvation response in plant cells: De novo synthesis and
degradation of acid phosphatases. Proc. Natl Acad. Sci. USA 88,
9538–9542.
4. Gellatly,K.S.,Moorhead,G.B.G.,Duff,S.M.G.,Lefebvre,D.D.
& Plaxton, W.C. (1994) Purification and characterization of a
potato tuber acid phosphatase having significant phosphotyrosine
phosphatase activity. Plant Physiol. 106, 223–232.
5. Turner, W.L. & Plaxton, W.C. (2001) Purification and charac-
terization of banana fruit acid phosphatase. Planta 214, 243–249.
6. Duff, S.M.G., Lefebvre, D.D. & Plaxton, W.C. (1989) Purification
and characterization of a phosphoenolpyruvate phosphatase from
Brassica nigra suspension cells. Plant Physiol. 90, 734–741.
7. Plaxton, W.C. & Carswell, M.C. (1999) Metabolic aspects of the
phosphate starvation response in plants. In Plant Responses to
Environmental Stresses: From Phytohormones to Genome
Reorganization (Lerner, H.R. eds) pp. 349–372. Marcel Dekker,
New York, USA.
8. Raghothama, K.G. (1999) Phosphate acquisition. Annu. Rev.
Plant Physiol. Mol. Biol. 50, 665–693.
9. Lefebvre,D.D.,Duff,S.M.G.,Fife,C.,Julien-Inalsingh,C.&
Plaxton, W.C. (1990) Response to phosphate deprivation in
Brassica nigra suspension cells. Enhancement of intracellular, cell
surface and secreted phosphatase activities compared to increases
in P
i
-absorption rate. Plant Physiol. 93, 504–511.
10. Goldstein, A.H., Danon, A., Baertlein, D.A. & McDaniel, R.G.
(1988) Phosphate starvation inducible metabolism in Lycopersicon
esculentum. II. Characterization of the phosphate starvation
inducible-excreted acid phosphatase. Plant Physiol. 87, 716–720.
11. Li, M. & Tadano, T. (1996) Comparison of characteristics of acid
phosphatases secreted from roots of lupin and tomato. Soil Sci.
Plant Nutr. 42, 753–763.
12. Miller, S.S., Liu, J., Allen, D.L., Menzhuber, C.J., Fedorova, M.
& Vance, C.P. (2001) Molecular control of acid phosphatase
secretion into the rhizosphere of proteoid roots from phosphorus-
stressed white lupin. Plant Physiol. 127, 594–606.
13. Haran, S., Logendra, S., Seskar, M., Bratanova, M. & Raskin, I.
(2000) Characterization of Arabidopsis acid phosphatase promoter
and regulation of acid phosphatase expression. Plant Physiol. 124,
615–626.
Ó FEBS 2002 Secreted acid phosphatases of P
i
-starved tomato cells (Eur. J. Biochem. 269) 6285
14. Zhang, C. & McManus, M.T. (2000) Identification and char-
acterization of two distinct acid phosphatases in cell walls of roots
of white clover. Plant Physiol. Biochem. 38, 259–270.
15. Duff, S.M.G., Lefebvre, D.D. & Plaxton, W.C. (1991) Purifica-
tion, characterization and subcellular localization of an acid
phosphatase from Brassica nigra suspension cells. Comparison
with phosphoenolpyruvate phosphatase. Arch. Biochem. Biophys.
286, 226–232.
16. Nakazato, H., Okamoto, T., Ishikawa, K. & Okuyama, H. (1997)
Purification and characterization of phosphatase inducibly syn-
thesized in Spirodela oligorrhiza grown under phosphate-deficient
conditions. Plant Physiol. Biochem. 35, 437–446.
17. Nakazato, H., Okamoto, T., Nishikoori, M., Washio, K., Morita,
N., Haraguchi, K., Thompson, G.A. & Okuyama, H. (1998) The
glycopsylphosphatidyl-anchored phosphatase from Spirodela oli-
gorrhiza is a purple acid phosphatase. Plant Physiol. 118, 1015–
1020.
18. Vincent, J.B. & Averill, B.A. (1990) An enzyme with a double
identity: purple acid phosphatase and tartrate-resistant acid
phosphatase. FASEB J. 4, 3009–3014.
19. Klabunde, T. & Krebs, B. (1997) The dimetal center in purple acid
phosphatases. Struc. Bond. 89, 177–198.
20. Schenk,G.,Ge,Y.,Carrington,L.E.,Wynne,C.J.,Searle,I.R.,
Carroll, B.J., Hamilton, S. & De Jersey, J. (1999) Binuclear
metal centers in plant purple acid phosphatases: Fe-Mn in sweet
potato and Fe-Zn in soybean. Arch. Biochem. Biophys. 370,183–
189.
21. Oddie, G.W., Schenk, G., Angel, N.Z., Walsh, N., Guddat, L.W.,
De Jersey, J., Cassady, A.I., Hamilton, S.E. & Hume, D.A. (2000)
Structure, function, and regulation of tartrate-resistant acid
phosphatase. Bone 27, 575–584.
22. LeBanasky, B.R., McKnight, T.D. & Griffing, L.R. (1992)
Purification and characterization of a secreted purple acid
phosphatase from soybean suspension cells. Plant Physiol. 99,
391–395.
23. Cashikar, A.G., Kumaresan, R. & Rao, N.M. (1997) Bio-
chemical characterization and subcellular localization of the
red kidney bean purple acid phosphatase. Plant Physiol. 114,907–
915.
24. DelPozo,J.C.,Allona,I.,Rubio,V.,Leyva,A.,delaPen
˜
a, A.,
Aragoncillo, C. & Paz-Ares, J. (1999) A type 5 acid phosphatase
gene from Arabidopsis thaliana is induced by phosphate starvation
and by some other types of phosphate mobilizing/oxidative stress
conditions. Plant J. 19, 579–589.
25.Schenk,G.,Guddat,L.W.,Ge,Y.,Carrington,L.E.,Hume,
D.A., Hamilton, S. & de Jersey, J. (2000) Identification of mam-
malian-like purple acid phosphatases in a wide range of plants.
Gene 250, 117–125.
26. Klabunde, T., Stra
¨
ter, N., Krebs, B. & Witzel, H. (1995) Structural
relationship between the mammalian Fe (III)-Fe (II) and the Fe
(III)-Zn (II) plant purple acid phosphatases. FEBS Lett. 367,56–
60.
27. Baldwin, J.C., Karthikeyan, A.S. & Raghothama, K.G. (2001)
LEPS2, a phosphorus starvation-induced novel acid phosphatase
from tomato. Plant Physiol. 125, 728–737.
28. Tadano, T. & Sakai, H. (1991) Secretion of acid phosphatases by
the roots of several crop species under phosphorus-deficient con-
ditions. Soil Sci. Plant Nutr. 37, 120–140.
29. Bosse, D. & Ko
¨
ck, M. (1998) Influence of phosphate starvation on
phosphohydrolases during development of tomato seedlings.
Plant Cell Environ. 21, 325–332.
30. Vera-Estrella, R., Blumwald, E. & Higgins, V.J. (1992) Effect of
specific elicitors of Cladosporium fulvum on tomato suspension
cells: Evidence for the involvement of active oxygen species. Plant
Physiol. 99, 1208–1215.
31. Drueckes, P., Schinzel, R. & Palm, D. (1995) Photometric
microtiter assay inorganic phosphate in the presence of acid-labile
organic phosphates. Anal. Biochem. 230, 173–177.
32. Brooks, S.P.G. (1992) A simple computer program with statistical
tests for the analysis of enzyme kinetics. Biotechniques 13, 906–911.
33. Cornish-Bowden, A. (1979) Fundamentals of Enzyme Kinetics.
Butterworth, London, UK.
34. Bollag, D.M., Rozycki, M.D. & Edelstein, S.J. (1996) Protein
Methods pp. 62–70. Wiley-Liss, New York, USA.
35. Hayman, A.R. & Cox, T.M. (1994) Purple acid phosphatase of the
human macrophage and osteoclast. Comparison, molecular
properties, and crystallization of the recombinant di-iron-oxo
protein secreted by baculovirus-infected insect cells. J. Biol. Chem.
269, 1294–1300.
36. Moraes, T.F. & Plaxton, W.C. (2000) Purification and char-
acterization of phosphoenolpyruvate carboxylase from Brassica
napus (rapeseed) suspension cell cultures. Implications for phos-
phoenolpyruvate carboxylase regulation during phosphate star-
vation, and the integration of glycolysis with nitrogen assimilation.
Eur. J. Biochem. 267, 4465–4476.
37. McGrew, B.R. & Green, D.M. (1990) Enhanced removal of
detergent and recovery of enzymatic activity following sodium
dodecyl sulfate-polyacrylamide gel electrophoresis: Use of casein
in gel wash buffer. Anal. Biochem. 189, 68–74.
38. Gradionoe, S.A., Arranz, S.E. & Cabada, M.O. (1998) Detection
of highly glycosylated proteins in polyacrylamide gels. Anal. Bio-
chem. 261, 224–227.
39. Altschul, S.F., Madden, T.L., Schaffer, A.A., Zhang, J., Zhang,
Z.,Miller,W.&Lipman,D.J.(1997)Gapped
BLAST
and
PSI
-
BLAST
: a new generation of protein database search programs.
Nucleic Acids Res. 25, 3389–3402.
40. Plaxton, W.C. & Moorhead, G.B.G. (1989) Peptide mapping by
CNBrfragmentation using a sodium dodecyl sulphate-poly-
acrylamide mini-gel system. Anal. Biochem. 178, 391–393.
41. Suerbaum,H.,Korner,M.,Witzel,H.,Althaus,E.,Mosel,B D.
& Muller-Warmuth, W. (1993) Zn-exchange and Mossbauer
studies on the [Fe-Fe] derivatives of the purple acid Fe(III)-Zn(II)-
phosphatase from kidney beans. Eur. J. Biochem. 214, 313–321.
42. Durmus,A.,Eicken,C.,Sift,B.H.,Kratel,A.,Kappl,R.,Hu
¨
tt-
erman,J.&Krebs,B.(1999)Theactivesiteofpurpleacidphos-
phatase from sweet potatoes (Ipomoea batatas): metal content and
spectroscopic characterization. Eur. J. Biochem. 260, 709–716.
43. Jencks, W.P. (1976) Free energies of hydrolysis and decarboxy-
lation. In CRC Handbook of Biochemistry and Molecular Biology:
Physical and Chemical Data Vol. 1, 3rd edn (Fasman, G.D. ed)
p. 302. CRC Press, Cleveland, OH, USA.
44. Abel,S.,Nu
¨
rnberger, T., Ahnert, V., Krauss, G J. & Glund, K.
(2000) Induction of an extracellular cyclic nucleotide phospho-
diesterase as an accessory ribonucleolytic activity during phos-
phate starvation of cultured tomato cells. Plant Physiol. 122,
543–552.
45. Kaija, H., Alatalo, S.L., Halleen, J.M., Lindqvist, Y., Schneider,
G., Vaananen, H.K. & Vihko, P. (2002) Phosphatase and oxygen
radical-generating activities of mammalian purple acid phospha-
tase are functionally independent. Biochem. Biophys. Res. Comm.
292, 128–132.
46. Wojtaszek, P. (1997) Oxidative burst: an early plant response to
pathogen infection. Biochem. J. 322, 681–692.
47. Kenton, P., Mur, L.A.J. & Draper, J. (1999) A requirement for
calcium and protein phosphatase in the jasmonate-induced
increase in tobacco leaf acid phosphatase activity. J. Exp. Bot. 50,
1331–1341.
48. Jakobek, J.L. & Lindgren, P.B. (2002) Expression of a bean acid
phosphatase cDNA is correlated with disease resistance. J. Exp.
Bot. 53, 387–389.
6286 G. G. Bozzo et al.(Eur. J. Biochem. 269) Ó FEBS 2002