Specific and sensitive quantitative RT-PCR of miRNAs with DNA primers doc
Bạn đang xem bản rút gọn của tài liệu. Xem và tải ngay bản đầy đủ của tài liệu tại đây (1.04 MB, 11 trang )
METH O D O LOG Y AR T I C LE Open Access
Specific and sensitive quantitative RT-PCR of
miRNAs with DNA primers
Ingrid Balcells
1†
, Susanna Cirera
2†
and Peter K Busk
3*
Abstract
Background: MicroRNAs are important regulators of gene expression at the post-transcriptional level and play an
important role in many biological processes. Due to the important biological role it is of great interest to
quantitatively determine their expression level in different biological settings.
Results: We describe a PCR method for quantification of microRNAs based on a single reverse transcription
reaction for all microRNAs combined with real-time PCR with two, microRNA-specific DNA primers. Primer
annealing temperatures were optimized by adding a DNA tail to the primers and could be designed with a
success rate of 94%. The method was able to quantify synthetic templates over eight orders of magnitude and
readily discriminated between microRNAs with single nucleotide differences. Importantly, PCR with DNA primers
yielded significantly higher amplification efficiencies of biological samples than a similar method based on locked
nucleic acids-spiked primers, which is in agreement with the observation that locked nucleic acid interferes with
efficient amplification of short templates. The higher amplification efficiency of DNA primers translates into higher
sensitivity and precision in microRNA quantification.
Conclusions: MiR-specific quantitative RT-PCR with DNA primers is a highly specific, sensitive and accurate method
for microRNA quantification.
Background
MicroRNAs (miRNAs) are small non-coding RNAs that
are i mportant regulators of biological processes in ani-
mals and plant s. MiRNAs regulate gene expression at
the po sttranscriptional level by binding to mRNAs and
either inhibit translation or modify the stability of th e
mRNA. Due to the important biological role of miRNAs
it is of great interest to study their expression level in
the cells. Furthermore, miRNAs have been associated
with cancer and other diseases [1] and miRNA expres-
sion can help in the diagnosis and prognostic of human
disease [2,3]. The discovery of miRNAs in blood and
their surprisingly high stability holds great promise for
diagnosis of human disease with miRNAs as biomarkers
[4]. Several st udies have shown that the amou nt of indi-
vidual miRNAs in blood is affected by human disease
and that the level of specific miRNAs can be used as a
diagnostic tool (for examples see [5-9]).
The three methods most frequently used for detection
of miRNAs are high-throughput sequencing, microarrays
and reverse transcription quantitative PCR (RT qPCR).
The latter method is used independently and for validat-
ing data obtained fr om high-throughput sequencing and
microarrays. It is challenging to design PCR primers for
miRNAs as the typical miRNA is only 22 bases long,
which is about the same size as a conventional PCR pri-
mer. Several methods have been developed to overcome
this problem. Chen and coworkers [10] developed stem-
loop RT-PCR where reverse transcription is done at low
temperature with a specially designed loop-primer fol-
lowed by PCR with one specific primer and a universal
primer. The PCR product is detected with a TaqMa n
probe. Although the method requires a specific RT pri-
mer for each miRNA, this method can be performed as
multiplex so that one RT reaction can be used as tem-
plate for several qPCR reactions [11]. Unfortunately,
stem-loop RT-PCR does not allow the user to control
the specificity of the reaction by melting curve analysis
* Correspondence:
† Contributed equally
3
Department of Biotechnology, Chemistry and Environmental Engineering,
Aalborg University, Lautrupvang 15, 2750 Ballerup, Denmark
Full list of author information is available at the end of the article
Balcells et al. BMC Biotechnology 2011, 11:70
/>© 2011 Balcells et al; licensee BioMed Central Ltd. This is an Open Access article distributed under the t erms of the Creative Commons
Attribution License (http://creativecommo ns.org/licenses/by/2.0), which permits unrestri cted use, distribution, and reproduction in
any medium, provided the orig inal work is properly cited.
and the TaqMan probe does not contribute to specificity
as the probe binds to the part of the cDNA sequence
that originates from the RT pri mer. Thus, if the RT pri-
mer binds to another sequence than the miRNA o f
interest, this will lead to incorporation of the b inding
site of the TaqMan probe and this unspecific amplicon
will be indistinguishable from the desired PCR product.
The recently published method based on circulariza-
tion of the miRNA also depends on a specific primer for
reverse transcription [12] and may be difficult to a dapt
to multiplexing. Furthermore, circularization by RNA
ligase is sensitive to sequence bias [13].
Another way to perform miRNA qPCR is to add a
poly(A) tail to the miRNA and use a tagged poly(T) pri-
mer for reverse transcription [14]. Subsequently, PCR is
performed with a miRNA-specific primer and a univer-
sal primer. This method is very convenient when the
amount of sample is limiting, which is often the case
for samples such as biopsies and microdissected sam-
ples, and when miRNA concentrations are low such as
in blood, because it only requires a single RT reaction
to genera te a template for detection of all miRNA s.
However, as only one specific primer is used for PCR
there is little degree of freedom in primer design and
specificity could be an issue. Especially the discrimina-
tion between closely related miRNAs that differ by only
one or a few nucleotides can be difficult using this
method.
The method called Universal RT microRNA PCR
combines the benefits of a universal RT reaction with
the specificity of two miRNA-specific PCR primers
[15]. The PCR product is detected with the intercalat-
ing dye SYBR-Green that allows the control of
unwanted PCR products by melting curve analysis. The
method relies on poly(A) tailing of the miRNAs fol-
lowed by reverse transcription with a tagged poly(T)
primer. PCR is performed with two specific primers
that are spiked with Locked Nucleic Acid (LNA) to
increase the Tm and the specificity. Although the PCR
reactions are specific and discriminate well between
closely related miRNAs, they often exhibit a low ampli-
fication efficiency which is a common cause of inaccu-
rate quantification. This is in agreement with the
observation that sequences containing LNA are poor
templates for most DNA polymerases [16].
InthepresentstudywedescribethatqPCRwithtwo
miRNA-specific DNA primers leads to higher amplifica-
tion ef ficiency than qPCR with LNA-spik ed primers. In
addition , this method has all the benefits regarding free-
dom of primer design and specificity of the LNA-based
method. Optimization of primer Tm and high specificity
of the PCR reaction is achi eved by adding a tail to each
of the PCR primers.
Results
MiR-specific qPCR of miRNAs combines the benefits of
a universal RT reaction with the specificity of two miR-
speci fic primers for qPCR (Figure 1). We designed miR-
specific DNA primers (Table 1) and tested them at dif-
ferent concentrations in real-time PCR o f synthetic miR
templates in a background of salmon sperm DNA. A
final con centration of 250 nM of each primer was found
to be optimal for qPCR (Figure 2A). This primer con-
centration gave significantly lower Cq values than 125
nM primer whereas 500 nM primer did not reduce the
Cq values further.
The PCR reactions were linear over a range of eight
log
10
of synthetic template (Figure 2B and 2C), pro-
duced one peak in melting curve analysis (Figure 2D)
and exhibited a good correlation between Cq and tem-
plate concentration (Figure 2C).
Amplification of miRNAs from biological samples
yielded similar amplification curves as for synthetic tem-
plates (Figure 3A) and melting curve analysis indicated
the presence of only one amplicon (Figure 3B) . In addi-
tion, there was a go od correlation between Cq and tem-
plate concentration over four log
10
dilutions when
biological samples were used (R
2
≥ 0.98) (Figure 3C).
To test the hypothesis that L NA can inhibit PCR
amplification b y decreasing the amplification efficiency
we c ompared the efficiency of amplification of 18 miR-
NAs from porcine uterus with commercially available
LNA-spiked primers sets from Exiqon (Denmark) and
with DNA primers without LNA. With LNA-spiked pri-
mers, amplification efficiencies ranged from 79 to 95%
for 17 of the 18 assays. T he last assay (let-7d) had an
apparent efficie ncy of 85% but more than one pea k
appeared in the melting curve analysis of the PCR pro-
duct (data not shown). This indicates that the assay is
unspecific and it was e xcluded from the analysis of
assay efficiency (Table 2). Amplification efficiencies with
DNA primers ranged from 84 to 102% (Table 2) and
were significantly higher than with LNA-spiked primers
(P-value < 0.001). On average, the PCR reactions with
DNA primers yielded 5.0% higher efficiency than LNA-
spiked primers corresponding to a 2.4 fold higher sensi-
tivity after 30 cycles of PCR.Meltingcurveanalysisof
the let-7d assay with DNA primers only yielded one
peak corroborating that this assay was specific (Figure
2D).
The ability of DNA primers to distinguish between
miRNAs with a single base difference was tested for
threecaseswheretheonebasedifferencewasinthe
part of the miRNA sequence used for forward primer
design and two cases where the difference was in the
sequence used for reverse primer design (Figure 4A).
On average, qPCR of the specific template gave almost
Balcells et al. BMC Biotechnology 2011, 11:70
/>Page 2 of 11
100-fold higher signal than amplification of the template
with a single base dif ference (Figure 4B). For example,
amplification of let-7a with the let-7a assay gave a Cq
that was 7.6 cycles lower than amplification of the same
amount of let-7e with the let-7a assay corresponding to
a difference of 170 fold in favor of the intended tem-
plate compared to the single base mismatch (Figure 4C).
To investigate the effect of different PCR master mixes
on the performance of miR-specific qPCR with DNA
primers we compared the amplification of synthetic
templates with the QuantiFast SYBR Green PCR master
mix ( Qiagen, Germany) and the Brilliant III U ltra-Fast
QPCR Master Mix (Agilent, USA). There was no differ-
ence in amplification efficiency (P-value = 0.69) for the
five assays tested (let-7d, miR-20a, miR-21, miR-26a and
miR-150) between the two master mixes and all the
assays gave one peak in melting curve analysis and were
comparable over eight log
10
of template concentration
(Figure 5). The different Tm (peak of the melting curve)
in t he two master mixes may probably be attributed to
different composition of the buffers.
MiR-specific qPCR of let-7a, miR-21, miR-23a and
miR-150 with DNA primers on RNA from six different
pig tissues showed expression levels from 8 copies p er
pg total RNA up to almost 2000 copies per pg total
RNA (Table 3). Expression of let-7a was remarkably
stable with differences below 5 fold between the six tis-
sue s. Regardless of the level of expression (Cqs from 16
to 23) and the type of tissue, the assays yielded products
with one peak in melting curve analysis as expected for
specific PCR amplifications (data not shown). The same
expression profile of the four miRs in the same six sam-
ples (P-values > 0.05) was obtained with LNA primers
but the Cq values were one c ycle higher on average
(data not shown).
Discussion
MiR-specific qPCR is a relatively new method that holds
great promise. The use of two miR-specific primers
makes the method as specific as stem-loop RT-PCR and
the reverse transcription is performed w ith a universal
primer compatible with all qPCR pr imer pairs and is
therefore optimal for analysis of small RNA samples and
for high-throughput screening [15]. Furthermore, detec-
tion with intercalating dye allows characterization of the
PCR product by melting curve analysis. MiRNA PCR
may produce unwanted side products that can only be
detected by melting curve analysis.
Commerc ially available primers for miR-specific qPCR
are spiked with LNA ( ). In the
present study we found that qPCR reactions with LNA-
spiked primers had a tendency to exhibit low amplifi ca-
tion efficiencies, which makes accurate quantification
more difficult [17]. Although several algorithms that
account for amplification efficiency are available to
calculate the original template concentration from real-
time PCR data [18-21] low amplification efficiency is a
sign that the amplification reaction is suboptimal and
TTTTTTTTTTTTTTT
5’
Forward
primer
Reverse primer
Tag
Tag
TTTTTTTTTTTTTTT
5’
PAP
AAAAAAAAAAAAAAA
n
5’
5’
AAAAAAAAAAAAAAA
n
RT primer
Tag
NVTTTTTTTTTTTTTTT
RTa se
1
2
3
4
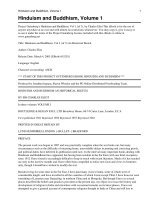
Figure 1 Flow scheme of miR-specific qPCR. 1. Start with purified RNA containing miRNA. 2. Add poly(A) tail with poly(A) polymerase (PAP).
3. cDNA synthesis with reverse transcriptase (RTase) and an anchored poly(T) primer with a 5’ tag. 4. PCR with two tagged primers.
Balcells et al. BMC Biotechnology 2011, 11:70
/>Page 3 of 11
Table 1 MiRNAs, PCR primers and synthetic templates
miRNA Sequence Forward primer Reverse primer Synthetic template
let-7a UGAGGUAGUAGGUUGUAUAGUU GCAGTGAGGTAGTAGGTTGT GGTCCAGTTTTTTTTTTTTTTTAACTATAC CAGGTCCAGTTTTTTTTTTTTTTTAACTATACAACCTACTACCTCA
let-7d AGAGGUAGUAGGUUGCAUAGUU AGAGAGGTAGTAGGTTGCAT AGGTCCAGTTTTTTTTTTTTTTTAACT CAGGTCCAGTTTTTTTTTTTTTTTAACTATGCAACCTACTACCTCT
miR-20a UAAAGUGCUUAUAGUGCAGGUAG ACAGTAAAGTGCTTATAGTGCA GTCCAGTTTTTTTTTTTTTTTCTACCT CAGGTCCAGTTTTTTTTTTTTTTTCTACCTGCACTATAAGCACTTTA
miR-21 UAGCUUAUCAGACUGAUGUUGA TCAGTAGCTTATCAGACTGATG CGTCCAGTTTTTTTTTTTTTTTCAAC CAGGTCCAGTTTTTTTTTTTTTTTCAACATCAGTCTGATAAGCTA
miR-23a AUCACAUUGCCAGGGAUUUCCA CATCACATTGCCAGGGAT CGTCCAGTTTTTTTTTTTTTTTGGAA CAGGTCCAGTTTTTTTTTTTTTTTGGAAATCCCTGGCAATGTGAT
miR-23b AUCACAUUGCCAGGGAUUACCAC same as for miR-23a TCCAGTTTTTTTTTTTTTTTGTGGTA CAGGTCCAGTTTTTTTTTTTTTTTGTGGTAATCCCTGGCAATGTGAT
miR-25 CAUUGCACUUGUCUCGGUCUGA CATTGCACTTGTCTCGGT GGTCCAGTTTTTTTTTTTTTTTCAGA
miR-26a UUCAAGUAAUCCAGGAUAGGCU CGAGTTCAAGTAATCCAGGA CCAGTTTTTTTTTTTTTTTAGCCTATC CAGGTCCAGTTTTTTTTTTTTTTTAGCCTATCCTGGATTACTTGAA
miR-27a UUCACAGUGGCUAAGUUCCGC CAGTTCACAGTGGCTAAGA CAGTTTTTTTTTTTTTTTGCGGAA CAGGTCCAGTTTTTTTTTTTTTTTGCGGAACTTAGCCACTGTGAA
miR-101a UACAGUACUGUGAUAACUGAA CGCAGTACAGTACTGTGATAAC AGGTCCAGTTTTTTTTTTTTTTTCAG CAGGTCCAGTTTTTTTTTTTTTTTCAGTTATCACAGTACTGTA
miR-103 AGCAGCAUUGUACAGGGCUAUGA AGAGCAGCATTGTACAGG GGTCCAGTTTTTTTTTTTTTTTCATAG
miR-122 UGGAGUGUGACAAUGGUGUUUGU ACAGTGGAGTGTGACAATG TCCAGTTTTTTTTTTTTTTTCAAACAC CAGGTCCAGTTTTTTTTTTTTTTTACAAACACCATTGTCACACTCCA
miR-125b UCCCUGAGACCCUAACUUGUGA CAGTCCCTGAGACCCTA GTCCAGTTTTTTTTTTTTTTTCACAA CAGGTCCAGTTTTTTTTTTTTTTTCACAAGTTAGGGTCTCAGGGA
miR-139b-5p UCUACAGUGCACGUGUCUCCAGU TCTACAGTGCACGTGTCT GTCCAGTTTTTTTTTTTTTTTACTGGA CAGGTCCAGTTTTTTTTTTTTTTTACTGGAGACACGTGCACTGTAGA
miR-150 UCUCCCAACCCUUGUACCAGUG GTCTCCCAACCCTTGTAC GTCCAGTTTTTTTTTTTTTTTCACTG CAGGTCCAGTTTTTTTTTTTTTTTCACTGGTACAAGGGTTGGGAGA
miR-199b-3p UACAGUAGUCUGCACAUUGGUU CAGTACAGTAGTCTGCACAT GTCCAGTTTTTTTTTTTTTTTAACCAA CAGGTCCAGTTTTTTTTTTTTTTTAACCAATGTGCAGACTACTGTA
miR-200b UAAUACUGCCUGGUAAUGAUGA ACAGTAATACTGCCTGGTAATG GGTCCAGTTTTTTTTTTTTTTTCATC CAGGTCCAGTTTTTTTTTTTTTTTCATCATTACCAGGCAGTATTA
miR-200c UAAUACUGCCGGGUAAUGAUGGA AGTAATACTGCCGGGTAATG GTCCAGTTTTTTTTTTTTTTTCCATC CAGGTCCAGTTTTTTTTTTTTTTTCCATCATTACCCGGCAGTATTA
Balcells et al. BMC Biotechnology 2011, 11:70
/>Page 4 of 11
will in all cases lead to lower sensitivity of the PCR reac-
tion [22]. However, we found that DNA primers can be
successfully used for miR-specific qPCR and that the
use of DNA gives si gnificantly h igher amplification effi-
ciencies than LNA-spiked primers. Low Tm is often a
problem in case of the short primers designed for a
miRNA template. This issue can be solved by spiking
LNA into the sequence to increase the Tm [23]. How-
ever, the same can be achieved by adding an art ificial
sequence to the 5’ end of the primer as done for the
stem-loop RT-PCR method [10]. In the present report
we optimized forward primer Tm to 59°C by adding an
artificial sequence at the 5’ endandfoundthatthese
primers performed well in miR-specific qPCR. The
reverse primer for miR-speci fic PCR is constructed with
a short, specific sequence that varies from 4-8 bases at
the 3’ end followed by a 15 bases long th ymidine stretch
as in the RT primer and finally, a 5’ end tail (tag) that
can be varied in length t o optimize the Tm [15]. Strictly
speaking the primer is not specific as only t he last 4 - 8
bases in the 3’ end are complementary to the miRNA.
However, this short sequence combined with the thymi-
dine stretch is sufficient to confer high specificity to the
PCR reaction. E.g. templates without a polyA tail or pre-
miRs that extend the miR at the 3’ end are not amplified
[15]. It was reported that it is necessary to spike an
LNA into the reverse primer to avoid aberrant amplifi-
cation products but this effect was only demonstrated
for primers with very high Tm (67 - 68°C ) [15]. We
found that when the Tm of the reverse primer is
A
Primer concentrations (nM)
Cq
10 095908580757065
1
0
ŶƚĐ
dF/dT
Degree
Cq
Z
Ϯ
сϬ͘ϵϵϵϯ
log(number of templates)
C
403530252015105
Norm. Fluoro.
0,00
0,01
0,1
1
Threshold
1.00
0.10
0.01
Cycle
Norm. Fluoro.
B
D
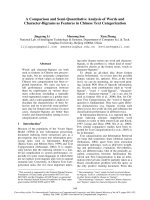
Figure 2 MiR-specific qPCR on synthetic templates with DNA primers. A The effect of primer concentration on Cq value of ssc-let-7d and
ssc-miR-26a miR-specific qPCR assays. Real-time PCR assays were performed in parallel at three different concentrations (125, 250 and 500 nM) of
the forward and of the reverse primers. B Amplification curves of an eight log
10
dilution series of a synthetic ssc-let-7d template in the ssc-let-7d
miR-specific qPCR assays. All samples contained a final concentration of 0.2 ng/μl salmon sperm DNA. C Extrapolation of Cq as function of the
log
10
of the number of templates for the same experiment as in B was a straight line (R
2
= 0.9993) with slope of -3.341 (PCR efficiency = 99%)
over eight log
10
dilution of the template. D Melting curve analysis of the same experiment. No template control is labeled ntc. Melting curve
analysis was performed from 60°C to 99°C.
Balcells et al. BMC Biotechnology 2011, 11:70
/>Page 5 of 11
optimized to 59°C, which is the optimal Tm for the for-
ward primer, the LNA is no longer crucial for successful
PCR.
A possible explanation of the lower amplification effi-
ciency with LNA-spiked primers is that for short targets
such as miRNAs the p rimers that are incorporated into
the template during amplification will lead to a high
proportion of LNA in the template that will decrease
the efficiency of subsequent PCR cycles. This possibility
is supported by differences between the solution struc-
ture of a DNA:LNA helix and the structure of double-
stranded DNA [24] and that nucleotide incorporation
opposite to an LNA base may be difficult for some poly-
merases [16]. A second possibility is that the LNA-
spiked primers may be more prone to form secondary
structures that will lower the efficient primer concentra-
tion available to hybridize to the template. Stem-loop
RT PCR is performed with DNA primers [10] and
should therefore have the same efficiency as miR-speci-
fic qPCR with DNA primers provided that the detection
method does not influence efficiency. Measurement of
the efficiency of 87 stem-loop RT PCR assays gave an
average efficiency of 94% ± 0.09 [25]. As expected this
efficiency is not significantly diffe rent from the average
efficiency (91% ± 0.05) for the 18 miR-specific qPCR
assays with DNA primers reported in the present study
(P-value = 0.17, Student’sT-test)butitishigherthan
the average efficiency (85% ± 0.05) for the 17 miR-speci-
fic qPCR assays with LNA-spiked primers reported in
the present study (P-value = 0.0001, Student ’sT-test).It
therefore seems that DNA primers give higher amplifi-
cation efficiency of miRNA templates than LNA-spiked
primers independently of whether intercalating dye or
TaqMan probes are used for detection.
The lower dissociation rates of double-stranded DNA
containing LNA bases [26] suggest that PCR with LNA-
zсͲϯ͘ϰϭΎůŽŐ;džͿнϮϬ͘ϲϭ
ĨĨŝĐŝĞŶĐLJ сϵϳй
ƌ
Ϯ
сϭ͘Ϭ
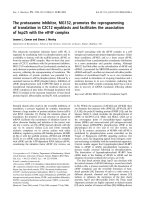
Figure 3 MiR-specific qPCR on biological samples with DNA primers. A Amplification curves of 40 uterus samples with the ssc-miR-150 miR-
specific qPCR assay. B Melting curve analysis of the same experiment. Melting curve analysis was performed from 55°C to 95°C. C Extrapolation
of Cq as function of the log
10
of the number of templates for the same experiment as in A was a straight line (R
2
= 1.0) with a slope of -3.406
(PCR efficiency = 97%) over 4 log
10
dilution of a pool that includes all samples included in the study.
Balcells et al. BMC Biotechnology 2011, 11:70
/>Page 6 of 11
spiked primers requires longer denaturation times. How-
ever, the recommended protocol (qon.
com) has a denaturation time of 30 seconds which
should be more than sufficient.
The use of two specific primers for each miRNA
allows for design of several different primer sets. E.g, for
a 22 bases sequence the forward primer can be from 15-
18 bases l ong and the reverse primer (specific part) can
be from 4-8 bases long and the combination of two pri-
mers will still cover all of the s equence. This is in con-
trast to PCR methods with one specific primer, where
the primer should always be as long as possible. One
significant advantage of this freedom of design is that
when discriminating between two miRNAs with a single
base mismatch, it is easier to design primers with the 3’
end close to the mismatch position, which is optimal for
mismatch discrimination [27]. In agreement with this,
miR-specific qPCR efficiently discriminates betwee n
related miRNAs (, this study).
Another indication of the robustness of miR-specific
qPCR is that the PCR can be performed in different
master mixes both with LNA and with DNA primers
(this study).
Of the 18 assays designed for the present study, 17
worked well in qPCR, which is a success rate of 94% for
primer design. For the failed primer set the forward and
the reverse primers were able to form primer dimers
and redesign of the primers solved this problem. By
taking primer dimer formation into account it may be
possible to reach even higher design success rates for
DNA primers. In contrast, the success rate of LNA-
spiked primers is 70% when dimer formation is ignored
and 80% when accounting for putative primer dimer
formation [15]. Although the primer design data set for
both DNA and LNA-spiked primers are limited, the dif-
ference suggests that DNA primers may be easi er to
design than LNA-spiked primers in agreement with that
the design rules for LNA-spiked primers are complex
and slight variations in LNA number, position and
sequence context can yield different results [28].
Conclusions
In conclusion, miR-specific qPCR is a useful method for
miRNA detection and the present study demonstrates that
the use of DNA primers without LNA gives high PCR effi-
ciencies that allow for precise quantification of the target.
Methods
Total RNA preparation
Uter us samples from 40 sows at 30-32 days of ges tation
were immediately snap-frozen in liquid nitrogen and
stored at -80°C until use. Total RNA was extracted with
TRIzol
®
reagent (Invitrogen).
Other pig tissue samples were col lected from a 3-
months old Danish production pig, except for the ovary
sample that was collected from a 6-months old pig. The
samples were immediately snap-frozen in liquid nitrogen
and stored at -80°C until use. Total RNA was extracted
with TRI Reagent
®
(Molecular Research Centre, Inc.)
following the manufacturer ’s recommendations.
Uterus samples were obtained from Spanish pigs
raised according to the European animal experimenta-
tion ethics law approved by the Ethical and Care Com-
mittee at IRTA. The rest of the tissues originated from
Danish pigs raised under production conditio ns accord-
ing to Danish st andards for animal husbandry. Since the
Danish animals were not subjected to experimental pro-
cedures, ethical approval was not required.
RNA quality was exam ined on an Agilent 2100 Bioana-
lyzer with the RNA 6000 Nano Kits (Agilent, G ermany)
or by visual inspection of the 28S/18S ribosomal bands in
an agarose gel. RNA quantity was measured on a Nano-
drop 1000 Spectrophotometer (Thermo Scientific, USA).
cDNA synthesis
Total RNA was used for cDNA syn thesis essen tially as
described [15]. Briefly, 100 ng of RNA in a final volume of
10 μl including 1 μl of 10x poly(A) polymerase buffer,
0.1 mM of ATP, 1 μM of RT-primer, 0.1 mM of each
deoxynucleotide (dATP, dCTP, dGTP and dTTP), 100
units of M uLV r everse transcriptase (New En glan d Bio labs,
USA) and 1 unit of poly(A) polymerase (New England
Table 2 Efficiency of miR-specific qPCR assays with
LNA-spiked and DNA primers on pig uterus total RNA
Target Efficiency LNA
primers
Efficiency DNA
primers
Difference
let-7a 82% 89% 6.9%
miR-101a 85% 90% 4.9%
miR-103 93% 94% 1.6%
miR-122 95% 95% -0.1%
miR-125b 89% 94% 4.5%
miR-139b-
5p
79% 86% 6.4%
miR-150 84% 97% 12.6%
miR-199b-
3p
80% 87% 7.1%
miR-20a 88% 86% -2.0%
miR-200b 80% 94% 13.6%
miR-200c 83% 84% 0.2%
miR-21 91% 92% 1.1%
miR-23a 79% 93% 14.1%
miR-23b 81% 87% 6.2%
miR-25 84% 91% 6.7%
miR-26a 88% 96% 8.3%
miR-27a 86% 85% -1.1%
let-7d not specific 102%
Average 85% 90% 5.4%
Balcells et al. BMC Biotechnology 2011, 11:70
/>Page 7 of 11
Bio labs , USA) was incubated at 42°C for 1 hour followed
by enzyme inactivation at 95°C for 5 minutes. The
sequence of the RT-primer was 5’-CAGGTCCAGTTTT
TTTTTTTTTTTVN, where V is A, C and G and N is A,
C, G and T. The primer was purchased from TAG
Copenhagen (Denmark).
For the microRNA LNA™ PCR kit from Exiqon (Den-
mark) cDNA synthesis was done according to the man-
ufacturer’s instructions.
Design of PCR primers and synthetic templates
All DNA PCR primers were designed according the
design rules as previously described [15] except that no
LNAs were spiked into the primers. Instead, Tm w as
optimized to 59°C by adjusting the tail length of the pri-
mers. Tm was calculated according to the nearest-neigh-
bor model [29]. Special attention was taken to design
the 3’ end of the primers according to the following
rules:
1. Discard a ll A’ sfromthe3’ end of the miRNA
sequence.
2. Choose the longest possible forward primer (12 to
18 bases long) that leaves at least four bases at the 3’
end of the miRNA for design of the reverse primer.
3. If possible, the last five bases at the 3’ end of the
forward primer should include 2-3 A or T residues.
4. If possible, the three last bases at the 3’ end of the
forward primer should include 1-2 A or T residues.
5. If possible, the two last bases at the 3’ end of the
forward primer should include 1 A or T residue.
6. If the Tm of the forward primer is below 59°C
add the f ollowing bases: G, A, C, G, C at the 5’ end
one at a time and calculate the Tm. Choose the
B
A
Forward primer
Reverse primer
C
Norm. Fluoro.
403530252015105
0
,00
0,01
0,1
Threshold
0.1
0.01
Cycle
ssc-let-7a
ssc-let-7e
ntc
miR name Sequence Assay Cq
% of specific signal
ssc-let-7a
UGAGGUAGUAGGUUGUAUAGUU
7a 19.10 100
ssc-let-7e
UGAGGUAG
GAGGUUGUAUAGUU
7a 26.70 0.6 ± 0.34
ssc-let-7a
UGAGGUAGUAGGUUGUAUAGUU
7a 19.10 100
ssc-let-7f
UGAGGUAGUAG
AUUGUAUAGUU
7a 26.00 1.0 ± 0.49
ssc-miR-23a
AUCACAUUGCCAGGGAUUUCCA
23a 17.30 100
ssc-miR-23b
AUCACAUUGCCAGGGAUU
ACCA
23a 22.30 3.1 ± 0.53
ssc-miR-125b
UCCCUGAGACCCUAACUUGUGA
125b 22.60 100
ssc-miR-125c
UCCCUGAGACCCUAACU
CGUGA
125b 29.90 0.7 ± 0.05
miR-150
UCUCCCAACCCUUGUACCAGUG
150 18.90 100
dre-miR-150
UCUCCCAA
UCCUUGUACCAGUG
150 26.00 0.8 ± 0.35
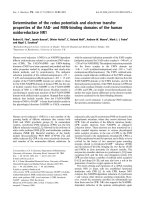
Figure 4 Discrimination between miRNAs with single nucleotide differences. A Position of the single nucleotide mismatches relative to the
PCR primers for the ssc-let-7a, ssc-miR-23a, ssc-miR-125b and ssc-miR-150 qPCR assays. The ssc-miR-23b sequence used for mismatch
discrimination was taken from miRBase and is different from the ssc-miR-23b sequence found in uterus and used for designing the ssc-miR-23b
qPCR primers (Table 1). B Discrimination between closely related miRNA templates for miR-specific qPCR assays with DNA primers. Mismatches
in the miRNA compared to the PCR primers are underlined. The data represents the results of three to four measurements. C Amplification
curves of ssc-let-7a and ssc-let-7e synthetic template in the ssc-let-7a miR-specific qPCR assays. All samples including the no template control (ntc)
contained a final concentration of 0.2 ng/μl salmon sperm DNA.
Balcells et al. BMC Biotechnology 2011, 11:70
/>Page 8 of 11
shortest of these primers that has a Tm = 59°C. (E.g.
longest possible primer is: CGCAGN
18
,whereN
18
are 18 miR-specific bases and CGCAG is a tail
sequence that is not complementary to the miR).
7. If the Tm of the forward primer is above 59°C
remove bases from the 5’ end one at a time and cal-
culate the Tm. Choose the longest of these primers
that has a Tm = 59°C.
8. Choose the longest possible reverse primer (4 to 8
bases long) that is not complementary to the 3’ end
of the forward primer.
9. Choose the reverse primer with the best 3’ end
according to steps 3-5.
10. Add 15 T’s at the 5’ end of the reverse primer.
11. If the Tm of the reverse primer is below 59°C
addthefollowingbasesatthe5’ end one at a time
and calculate the Tm: G, A, C, C, T, G, G, A, C.
Choose the shortes t of these primers that has a Tm
= 59°C. (E.g. longest possible primer is: CAGGTC-
CAGT
15
N
8
,whereN
8
are 8 miR-specific bases, T
15
are 1 5 T’ s and CAGGTCCAG i s a tail sequence
complementary to the tail of the RT primer).
Synthetic templates were DNA oligonucleotides com-
plementary to the mature sequence of the miRNAs
including t he RT primer sequence that is incorporated
1
1
A
. Fluoro.
0,1
Threshold
0.1
QuantiFast
BrilliantIII
Norm
0,01
0.01
QuantiFast
1
0,9
1
B
C
y
cle
403530252015105
0,00
d
F/ dT
0,8
0,7
0,6
0,5
QuantiFast
BrilliantIII
ntc
d
0,4
0,3
0,2
01
QuantiFast
C
ntc
deg.
80757065
0
,
1
0
R
2
0 9993
Cq
R
2
=
0
.
9993
log(number of templates)
Figure 5 MiR-specific qPCR in different qPCR master mixes. A Comparison of amplification curves of a synthetic ssc-let- 7d template in the
ssc-let-7d miR-specific qPCR assay in QuantiFast and in Brilliant III qPCR Master mixes. B Melting curve analysis of the same experiment. No
template control is labeled ntc. Melting curve analysis was performed from 60°C to 99°C. No change in fluorescence (dF/dT = 0) was observed
above 80°C and this part of the curves was omitted from the figure. C Extrapolation of Cq as function of the log
10
of the number of templates
for the same experiment as in A was a straight line (R
2
indicated on figure) and for both master mixes the PCR efficiency was 99% as calculated
from the slope of the regression line.
Table 3 Expression profiling of four miRNAs in pig
tissues measured by miR-specific qPCR with DNA primers
miRNA brain heart liver lung thymus ovary Cq
(min)
Cq
(max)
let-7a 120 87 27 120 34 98 16.2 18.8
miR-21 88 190 36 900 340 1800 15.9 20.7
miR-
23a
15 42 8 100 11 33 16.2 20.4
miR-
150
39 22 19 140 270 21 18.6 23.4
Balcells et al. BMC Biotechnology 2011, 11:70
/>Page 9 of 11
during cDNA synthesis. Sequences of primers and tem-
plates are given in Table 1. Oligonucleotides were pur-
chased from TAG Copenhagen (Denmark) and Sigma
(UK).
Primers spiked with LNA were mi croRNA LNA™
PCR primer sets designed by Exiqon (Denmark).
Quantitative PCR
Quantitative PCR of biological samples was done in 10
μl total volume wi th 1 μl of cDNA diluted 8-10 times, 5
μl of 2x QuantiFast SYBR Green PCR master mix (Qia-
gen, Germany), 250 nM of each primer (Table 1) or 2 μl
microRNA LNA
TM
primer sets (Exiqon, Denmark).
Standard curves with 10-fold dilutions (made with a
pool of equal amounts of cDNA from the 40 uterus
samples) were made for all assays to calculate qPCR
efficiency.
The same PCR condit ions were used for synthetic
templates except that 1 μl of synthetic template in 2 ng/
μl salmon sperm DNA (Sigma, USA) in TE was used
instead of cDNA. 2x Brilliant III Ultra-Fast QPCR Mas-
ter Mix (Agilent, USA) was used instead of QuantiFast
where indicated.
Cycling conditions were 95°C for 5-10 min followed
by 40 cycles of 95°C for 10-30 sec and 60°C 30-60 sec.
A melting curve analy sis (60°C to 99°C) was performed
after the thermal profile to ensure specificity in the
amplification.
QPCR of biological samples was performed on a
MX3000P machine (Stratagene, USA) and reactions
containing synthetic templates were performed on a
Rotorcycler (Qiagen, Germany). Primers spiked with
LNA were microRNA LNA™ PCR primer sets designed
by Exiqon (Denmark).
qPCR data analysis
Quantification was ba sed on determination of the quan-
tification cycle (Cq) and PCR efficiency was calculated
from the log-linear portion of the standard curves [17].
Comparison of the efficiency of qPCR with LNA-
spiked and DNA primers was done by two-sided Stu-
dent’s T-test for paired samples. Significance threshold
was set at P-value < 0.05.
Acknowledgements
The authors thank Agnieszka Podolska and Mette Lange for critical
comments on the manuscript. This work was supported by the Projects
AGL2007-66371-C02-01 and AGL2010-22358-C02-01 and by the Consolider-
Ingenio 2010 Program (CSD2007-00036) from Ministerio de Ciencia e
Innovación. IB is recipient of PIF PhD fellowship from Universitat Autònoma
de Barcelona.
Author details
1
Departament de Ciència Animal i dels Aliments, Universitat Autònoma de
Barcelona, 08193 Bellaterra, Spain.
2
Department of Animal and Veterinary
Basic Sciences, University of Copenhagen, Copenhagen, Denmark.
3
Department of Biotechnology, Chemistry and Environmental Engineering,
Aalborg University, Lautrupvang 15, 2750 Ballerup, Denmark.
Authors’ contributions
PKB designed all oligonucleotides and performed and analyzed all
experiments with synthetic templates. IB and SC collected biological
samples, purified RNA and performed and analyzed qPCR experiments with
these samples. The manuscript was written by the authors from a draft by
PKB. All authors read and approved the final manuscript.
Competing interests
PKB is designated as inventor of miR-specific qPCR in a patent filed by
Exiqon A/S. All commercial rights to method described in the patent belong
to Exiqon A/S. None of the authors have any economical interest in this
company.
Received: 18 February 2011 Accepted: 25 June 2011
Published: 25 June 2011
References
1. Schetter AJ, Heegaard NHH, Harris CC: Inflammation and cancer:
interweaving microRNA, free radical, cytokine and p53 pathways.
Carcinogenesis 2010, 31:37-49.
2. Fabbri M: miRNAs as molecular biomarkers of cancer. Expert Rev Mol
Diagn 2010, 10:435-444.
3. Ferracin M, Veronese A, Negrini M: Micromarkers: miRNAs in cancer
diagnosis and prognosis. Expert Rev Mol Diagn 2010, 10:297-308.
4. Mitchell PS, Parkin RK, Kroh EM, Fritz BR, Wyman SK, Pogosova-
Agadjanyan EL, Peterson A, Noteboom J, O’Briant KC, Allen A, Lin DW,
Urban N, Drescher CW, Knudsen BS, Stirewalt DL, Gentleman R, Vessella RL,
Nelson PS, Martin DB, Tewari M: Circulating microRNAs as stable blood-
based markers for cancer detection. Proc Natl Acad Sci USA 2008,
105:10513-10518.
5. Heneghan HM, Miller N, Lowery AJ, Sweeney KJ, Newell J, Kerin MJ:
Circulating microRNAs as novel minimally invasive biomarkers for breast
cancer. Ann Surg 2010, 251:499-505.
6. Fichtlscherer S, De Rosa S, Fox H, Schwietz T, Fischer A, Liebetrau C,
Weber M, Hamm CW, Röxe T, Müller-Ardogan M, Bonauer A, Zeiher AM,
Dimmeler S: Circulating microRNAs in patients with coronary artery
disease. Circ Res 2010, 107:677-684.
7. Zhang Y, Jia Y, Zheng R, Guo Y, Wang Y, Guo H, Fei M, Sun S: Plasma
MicroRNA-122 as a Biomarker for Viral-, Alcohol-, and Chemical-Related
Hepatic Diseases. Clin Chem 2010, 56:1830-1838.
8. Vasilescu C, Rossi S, Shimizu M, Tudor S, Veronese A, Ferracin M,
Nicoloso MS, Barbarotto E, Popa M, Stanciulea O, Fernandez MH, Tulbure D,
Bueso-Ramos CE, Negrini M, Calin GA: MicroRNA fingerprints identify miR-
150 as a plasma prognostic marker in patients with sepsis. PLoS ONE
2009, 4:e7405.
9. Liu C, Kao S, Tu H, Tsai M, Chang K, Lin S: Increase of microRNA miR-31
level in plasma could be a potential marker of oral cancer. Oral Dis 2010,
16:360-364.
10. Chen C, Ridzon DA, Broomer AJ, Zhou Z, Lee DH, Nguyen JT, Barbisin M,
Xu NL, Mahuvakar VR, Andersen MR, Lao KQ, Livak KJ, Guegler KJ: Real-time
quantification of microRNAs by stem-loop RT-PCR. Nucleic Acids Res 2005,
33:e179.
11. Mestdagh P, Feys T, Bernard N, Guenther S, Chen C, Speleman F,
Vandesompele J: High-throughput stem-loop RT-qPCR miRNA expression
profiling using minute amounts of input RNA. Nucleic Acids Res 2008, 36:
e143.
12. Kumar P, Johnston BH, Kazakov SA: miR-ID: A novel, circularization-based
platform for detection of microRNAs. RNA 2011, 17:365-380.
13. Wang H, Ach RA, Curry B: Direct and sensitive miRNA profiling from low-
input total RNA. RNA 2007, 13:151-159.
14. Shi R, Chiang VL: Facile means for quantifying microRNA expression by
real-time PCR. BioTechniques 2005, 39:519-525.
15. Busk PK: Method for Quantification of Small RNA Species. 2010, WO/
2010/085966.
16. Veedu RN, Vester B, Wengel J: Enzymatic incorporation of LNA
nucleotides into DNA strands. Chembiochem 2007, 8:490-492.
17. Bustin SA, Benes V, Garson JA, Hellemans J, Huggett J, Kubista M, Mueller R,
Nolan T, Pfaffl MW, Shipley GL, Vandesompele J, Wittwer CT: The MIQE
Balcells et al. BMC Biotechnology 2011, 11:70
/>Page 10 of 11
guidelines: minimum information for publication of quantitative real-
time PCR experiments. Clin Chem 2009, 55:611-622.
18. Pfaffl MW, Horgan GW, Dempfle L: Relative expression software tool
(REST) for group-wise comparison and statistical analysis of relative
expression results in real-time PCR. Nucleic Acids Res 2002, 30:e36.
19. Tichopad A, Dilger M, Schwarz G, Pfaffl MW: Standardized determination
of real-time PCR efficiency from a single reaction set-up. Nucleic Acids Res
2003, 31:e122.
20. Ruijter JM, Ramakers C, Hoogaars WMH, Karlen Y, Bakker O, van den
Hoff MJB, Moorman AFM: Amplification efficiency: linking baseline and
bias in the analysis of quantitative PCR data. Nucleic Acids Res 2009, 37:
e45.
21. Rutledge RG, Stewart D: A kinetic-based sigmoidal model for the
polymerase chain reaction and its application to high-capacity absolute
quantitative real-time PCR. BMC Biotechnol 2008, 8:47.
22. Bustin SA: A-Z of Quantitative PCR (IUL Biotechnology, No. 5) International
University Line; 2004.
23. Raymond CK, Roberts BS, Garrett-Engele P, Lim LP, Johnson JM: Simple,
quantitative primer-extension PCR assay for direct monitoring of
microRNAs and short-interfering RNAs. RNA 2005, 11:1737-1744.
24. Nielsen KE, Singh SK, Wengel J, Jacobsen JP: Solution structure of an LNA
hybridized to DNA: NMR study of the d(CT(L)GCT(L)T(L)CT(L)GC):d
(GCAGAAGCAG) duplex containing four locked nucleotides. Bioconjug
Chem 2000, 11:228-238.
25. Chen Y, Gelfond JAL, McManus LM, Shireman PK: Reproducibility of
quantitative RT-PCR array in miRNA expression profiling and comparison
with microarray analysis. BMC Genomics 2009, 10:407.
26. Arora A, Kaur H, Wengel J, Maiti S: Effect of locked nucleic acid (LNA)
modification on hybridization kinetics of DNA duplex. Nucleic Acids Symp
Ser 2008, 52:417-418.
27. Sambrook J, Russell DW: Molecular Cloning: A Laboratory Manual Cold
Spring Harbor Laboratory Press; 2001.
28. Latorra D, Arar K, Hurley JM: Design considerations and effects of LNA in
PCR primers. Mol Cell Probes 2003, 17:253-259.
29. SantaLucia J: A unified view of polymer, dumbbell, and oligonucleotide
DNA nearest-neighbor thermodynamics. Proc Natl Acad Sci USA 1998,
95:1460-1465.
doi:10.1186/1472-6750-11-70
Cite this article as: Balcells et al.: Specific and sensitive quantitative RT-
PCR of miRNAs with DNA primers. BMC Biotechnology 2011 11:70.
Submit your next manuscript to BioMed Central
and take full advantage of:
• Convenient online submission
• Thorough peer review
• No space constraints or color figure charges
• Immediate publication on acceptance
• Inclusion in PubMed, CAS, Scopus and Google Scholar
• Research which is freely available for redistribution
Submit your manuscript at
www.biomedcentral.com/submit
Balcells et al. BMC Biotechnology 2011, 11:70
/>Page 11 of 11