Ele ctricity Use d by Office Equipment and Netw ork Equipment in the U.S.: Detailed Report and A ppendices ppt
Bạn đang xem bản rút gọn của tài liệu. Xem và tải ngay bản đầy đủ của tài liệu tại đây (359.36 KB, 50 trang )
LBNL-45917
Ele ctricity Use d by Office Equipment and Netw ork Equipment in the U.S.:
Detailed Report and A ppendices
Kaoru Kawamoto, Jonat han G. Koomey, Bruce Nor dman,
Richard E . Brown, Mar y Ann Piette, Michael Ti ng, and Alan K. Meier
Energy Analysis Depar tment
Environmental E nergy Technologies Division
Ernest Or lando Lawrence Ber keley National Laborator y
Uni versit y of Califor nia
Ber keley, CA 94720
To download thi s report, associat ed dat a, and relat ed research, go to
htt p://enduse.l bl.gov/Projects/InfoTech.html
February 2001
This work was s upported by the Of fice o f Atmo spheric Prog rams o f the U.S. Environ mental Protection Agency .
Prepared for th e U.S. Depar tment of Energy un der Co ntract No. DE- AC03-7 6SF000 98.
Table of Contents
Abs tract 1
Introduction 1
Methodology 2
Res ults a nd Dis cussion 8
Conclusions and Future Work 12
Acknowledgements 13
Reference s 13
Appendix (I. Office Equipme nt) 15
Appendix (II. N etwork Equipment) 44
Appendix Reference s 46
1
Ele ctricity Use d by Office Equipment and Netw ork Equipment in the U.S.
Kaoru Kawamoto, Jonat han G. Koomey, Bruce Nordman,
Richard E . Brown, Mary Ann Piette, Michael Ti ng, and Alan K. Meier
Lawrence Berkel ey Nat ional Laboratory
ABS TRACT
In spite of the recent explosive gr owth in the use of office and networ k equi pment, there
has been no recent st udy that est imates in detail how much electricit y is consum ed by that
equipment in the Unit ed States.
In this study, we examined energy use by offi ce equipment and network equipm ent at the
end of 1999. We classified office equipment into 11 types; for each type we estimated annual
energy consumpt ion for resi dential, com mercial, and industrial use by combi ning estimat es of
stock, power requirem ents, usage, and saturat ion of power management. We al so classified
net work equipment int o six types and estimated the annual energy consumption for each t ype.
We found that total direct power use by office and networ k equi pment is about 74 TWh
per year, which is about 2% of total electr icity use in the U.S. When el ectricity used by
tel ecommunicati ons equipment and electr onics manufacturing is i ncluded, that figure rises to 3%
of all el ectricity use (Koomey 2000). More than 70% of the 74 TWh/year is dedicated to office
equipment for commercial use. We also found that power management cur rently saves 23
TWh/year, and compl ete saturati on and proper functioning of power managem ent would achieve
additional savi ngs of 17 TWh/year . Furt hermor e, com plete saturation of night shut down for
equipment not r equired to operat e at night would r educe power use by an additional 7 T Wh/year.
Finally, we com pared our current estimate wit h our 1995 forecast for 1999. We found
that the total differ ence between our current estim ate and the previous for ecast is less than 15%
and ident ified the factors that led to inaccuracies in the previous forecast. We also conduct ed a
sensitivi ty analysis of the uncer tainti es in our current forecast and ident ified the data set s that
have the largest impact on our current estimate of energy use.
Introduction
Use of the Internet has spr ead rapidly. During the past 10 year s, the number of registered
dom ain names
1
has incr eased from 16,000 to 15 million, and the number of wor ld-wide web sites
has increased from zero to 10 mil lion. Meanwhile, annual shipments of computers have
increased by a factor of five (Inform ation Technology Industr y Council 1998), and net work
devices like routers and switches have become ubiquitous. In spite of this growth, ther e has been
no recent study that assesses in detail how much el ectricity is dedicated to computer equipment
or networ k equi pment in the United Stat es. The last compr ehensi ve study in this area is Lawrence
Ber keley National Laborator y’s st udy in 1995 (Koomey et al. 1995), prior to the Internet’s
emergence as an impor tant f orce i n the U.S. economy.
In this study, we examined energy use by offi ce equipment and network equipment in
bot h offi ce and non-office settings in the U. S. We classi fied office equipm ent into 11 types. For
each type, we estimat ed annual energy consumption ( TWh/year) for resi dential, com mercial, and
industrial use by com bining the stock, power requir ement, usage, and saturation of power
1
A d efinition of “domain nam e” can be fo und at <http://ww w.register.com/faq /gloss ary.cg i>.
2
management. We estimated el ectricity use for the case of complete sat uration of power
management and proper funct ioning of those features, as well as current practice for power
management and operat ion. Further , we estimat ed energy use in the case of complet e shut down
dur ing ni ghts and weekends of all office equi pment except servers, mi nicomputers, mainf rames,
and facsi mile ( fax) m achines. We also evaluat ed the uncer tainti es in our estimate by conducti ng a
sensitivi ty analysis.
We classi fied network equipment into si x types and estimated annual energy use
(TWh/year ) for each type based on sales revenue. We also surveyed energy use for the LBNL
net work and com pared the results to our U.S. estimate to assess its r easonableness.
Finally, for energy use by commer cial office equipm ent, we compared our cur rent
est imate with our 1995 forecast and identified the factor s that led to inaccuraci es in the pr evious
for ecast.
Methodology
Off ice Eq uipmen t
Classification. We classified office equipment i nto 11 types as shown in Table 1. Multi-function
devices (MFDs) fal l into sever al dif ferent categories, and although good energy data on these
product categor ies ar e not available, all indications are that the energy use of each type behaves
sim ilarly to a conventional singl e-function t ype (copier, laser print er, or inkjet printer). Theref ore,
we allocated MFDs into appropriate singl e-function categor ies. Further , we classif ied each
equipment type as residenti al, commerci al, or industrial, based on the place wher e it i s used.
Table 1. Classification of Office Equipment
Equ ipment Type Def initio n
Por table Computer Notebook or sub -noteb ook co mputer
Des ktop Computer Des ktop o r des kside computer that is u sed as a client co mputer and h as a p rice
low er than $25,000
Ser ver Des ktop o r des kside computer that is u sed as a ser ver co mputer and h as a p rice
low er than $25,000
Min icompu ter Com puter whose price is between $ 25,000 and $ 350,00 0. Per ipherals such as
tap es and disk storag e are consid ered p art of minicomputers
Mainframe Com puter whose price is hig her th an $35 0,000. Perip herals such as tap es and
dis k stor age ar e cons idered part of mainframes
Ter minal Non -progr ammable term inal u sually connected to main frames or minicomp uters
Dis play Dis play f or des ktop computer, including CRT and LCD
Las er Printer Includes multif unctio n devices wh ose major fu nction is laser pr inting
Ink jet Pr inter Includes dot matrix p rinter s and multif unctio n devices wh ose major fu nction is
ink jet pr inting
Cop ier Includes multif unctio n devices wh ose major fu nction is co pying
Fax Facsimile machines
Def inition of Power Managem ent (P M). For computers, displays, and laser printers, we
considered only one low-power mode. Alt hough many machines have more than one PM mode,
we do not believe that the power level differ ences and availabl e data on the dist ributi on of
dif ferent modes justi fy usi ng mor e than the one mode we chose.
For inkjet printers and faxes, we ignor ed PM, because their power requirements ar e
usually below the ENERGY STAR st andard low-power level even wi thout PM, and because
3
many of t hese m achines have no low-power mode.
There are many terms for operating modes. For consi stency among all the equipment
types, we used only three terms, “active,” “l ow-power,” and “of f” as shown in Table 2. We
def ined active mode for copiers, faxes, and printer s as the state dur ing which devices are ready
but not printing or copying. Inst ead of defining another mode for pri nting or copying, we
est imated the extra energy use for copying or print ing separately.
Table 2. PM Mode*
Term in T his Paper Active ! Lo w-Power ! Off
Desktop/P ortable/Serv er Active ! Standby ! Su spend(Sleep) ! Off
Display/T erminal Active ! Sleep ! Deep Sleep ! Off
Laser Printer Ready ! Sleep ! Off
Ink jet Printer Ready ! Sleep ! Off
Cop ier Ready(Standby) ! Sleep(En ergy Z ero) ! Manual-O ff/Auto-Off
Term in Industry
Fax Ready(Standby) ! Sleep
! Off
*Mo des sh own ab ove with str ikethr ough a re ign ored in our analys is.
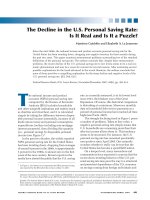
Gen eral Methodology. For each type of equipment , we estimat ed residenti al, commerci al, and
industrial ener gy use as summarized in Figure 1.
Figure 1. Calcu lation Flow
Fir st, we estim ated total stock using shipment data and device lifeti mes. Second, we
all ocated total stock into residential, commercial, and i ndustr ial stocks using r esidential saturat ion
rat es and ratios of commercial st ock to industrial stock.
Thi rd, we estim ated the average power requirement of each mode (active, low-power ,
Shipments (units/year)
Lifetime (years)
Residential Saturatio n (units/hou sehold )
Ratio of Commercial to Indu strial Stock
Usage (ho urs/week)
(Active/Low /Off)
Pow er Req uirements (W )
(Active/Low /Off)
Pow er-Man agemen t-Enab led Rate (%)
Extra Energy Use for Printing or Cop ying (kWh/year)
Total Sto ck (un its)
Com mercial Stock (units)
Residential Sto ck (un its)
Ind ustrial Stock (units)
Com mercial Energy Use (TWh/year)
Residential Energy Use (TWh /year)
Ind ustrial Energy Use (TWh/year)
Com mercial & In dustrial UEC (kWh/year)
Residential UEC (kWh/year)
4
off ), average usage ( mode distribution over a week) , and the PM-enabl ed rat es for residential and
non-residential (i.e. commercial and industri al) use. We did not diff erenti ate these parameters
bet ween commercial and industrial equipment. For pr inters, copi ers, and faxes, we estim ated the
ext ra energy use for printi ng or copying by combini ng the average imaging rate (number of
images pr inted or copied in a year) wit h the average ener gy use for each im age. This estimate is
important because the power used when printing or copying is much higher than the active
power.
Fourth, we esti mated the unit energy consumpt ion (UEC) for resi dential and non-
residenti al devices by combining the power requirem ent, usage, power- management-enabled
rat e, and the extra energy use for printing or copying (where applicable) f or each devi ce.
Finally, multiplying the UE C by the stock, we arrived at estimates of residential ,
com mercial, and industrial energy consumption.
Stock. Fir st, we estim ated the tot al stock for each type of equi pment based on shi pment data
(Informat ion Technology Industry Counci l 1998, Appl iance Magazi ne 1999). Li fetimes were
der ived f rom a previous study (Koomey et al. 1995). The use of a single lif etime for each type of
equipment is a simpli ficati on, but the available data do not justify a more compl ex for mulati on.
Second, the residenti al stock for each type of equi pment is der ived from published
residenti al equipment satur ation rates (DOE 1999, CEMA 1998, CE MA 1999). For laser
pri nters, survey data resul ts indicate that t he residenti al stock is larger than the commerci al stock,
but we believe this result to be unreal istic. We concluded that this inaccuracy is caused by
tendency of sur vey respondents to mistake inkjet pr inters for laser printer s, so we cor rected by
assuming that half of the people responding t o these surveys made thi s mist ake.
Finally, we est imated non-r esidential stock by subt racting resi dential stock from the total
stock and split ting the rem ainder into commer cial and industrial stocks based on the ratio of
com mercial floor space to industr ial conditioned space fr om Com mercial Buil ding Energy
Consumpti on Sur vey in 1995 (DOE 1998) and Manufacturing Energy Consum ption Survey in
1994 (DOE 1997) .
Table 3 shows the stock for each type of equipm ent. The accuracy of com mercial and
industrial stock esti mates depends heavily on the accuracy of the assumed lifetim es. There ar e
also some uncer tainti es in the resident ial st ock of print ers because of the appar ent inaccuracy of
sur vey data.
5
Tab le 3. Stocks of Of fice Equipment at the en d of 1999 (m illion s)
Tot al Res identi al Commercia l Ind ustria l
Por table Computer
Des ktop Computer
Ser ver
Min icompu ter
Mainframe
Dis play
Ter minal
Las er Printer To tal
<8 ppm
8-1 2 ppm
>12 ppm
Ink jet/Do t Prin ter
Cop ier Total
<21 cpm
21- 44 cpm
>44 cpm
Fax
22
110
3.3
2.0
0.1 1
110
13
28.0
7.8
8.7
11
74
11
6.6
2.8
1.9
28
16
55
0
0
0
55
0
6.3
6.3
0
0
50
3.8
3.8
0
0
6.3
5.3
48
2.9
1.5
0.0 96
48
10
19
1.3
7.6
10
21
6.5
2.5
2.4
1.6
19
0.7 6
6.8
0.4 2
0.5 0
0.0 11
6.8
3.3
2.7
0.1 8
1.1
1.4
2.9
0.9 3
0.3 5
0.3 5
0.2 4
2.7
Power Req uirement. For all equipment except servers, minicomputers, and mainframes, we
est imated power requi rement s based on our own measurement s (unpublished) or measurement s
by others (Nordman et al. 1998, Brown 2000, and EPA 2000) . To calculate power levels for
copiers and laser pri nters, we took the wei ghted average of t he power levels across device speeds
because power levels vary considerably by the speed (images/minute) of each unit. We assumed
that the power requir ements for residential use are same as those for commercial and industri al
use except for desktop computers, laser print ers, and copiers.
For servers, we measured the power requirements for sever al machines and found them
to range from 50 W to 270 W. We estimated average power use as 75 W.
For minicomputers and mainf rames, it is diffi cult to esti mate the average power
requirement because of the wide r ange of power requirements for CPUs
2
and the various kinds of
per ipherals such as t apes and disk stor age.
For minicomputers, we assum ed that the IBM AS /400 is the representati ve machine and
est imated the average power requi rement for the CPU based on measured data (IBM 1999). By
assuming the power requirem ent for peri pheral s combined with the power requirement for the
CPU, we estimat ed the average power requirement for minicomputers as 1,000 W.
For mainf rames, we had two more difficulties, one of which is the recent significant
decrease in power requirements and the other is the lack of measured data. We separated the
stock of mainfr ames into the new stock shipped from 1996 until now and the old st ock which
wer e shipped before 1996. We assumed that the IBM S/390 i s the representati ve machine for the
new stock and estimat ed the power requi rement for one type of IBM S/390 whose pri ce is close
to the average price of mai nframes. We also estimat ed the average power requirement for the old
stock based on Koomey et al . (1995). Fi nally, based on a wei ghted average of power
requirements for the new st ock and the old st ock, we esti mated the average requir ement for
2
We use the ter m “CPU ” to r epresent the centr al pro cessin g units and intern al drives of minicomputers and
mainframes. Per ipherals such as external discs and tape d rives are no t included in CPUs .
6
mai nframes at 10 kW.
We also assumed that CPUs of mini comput ers and mainframes are always on but their
associated peri pheral s are off at night . We did not consi der power management for
minicomputers and mai nframes.
In sum, there are significant uncertainties in the power requir ements for servers,
minicomputers, and mainfram es.
PM- Enabled Rate. The PM-enabled rate i s the percentage of equi pment that has PM capabi lities
and whose power management is properly operat ing. Equipment that has PM capabilit y but that
has not been correctl y enabled is not i ncluded in t his category.
We estimated the rate for each type of equi pment mainly based on the results of audit s for
nighttime status (Nor dman et al. 1998 and Nor dman et al. 2000). For portabl e computers and
ser vers, we made assumptions because of the l ack of data, so there ar e some uncer tainti es.
Usage (Mode Distribut ion). We estim ated the average usage (mode distribution over a week)
for each type of offi ce equipment in the case that it has PM capabili ty and that it is enabled.
Several f actors combi ne to determ ine the aver age mode distribut ion. T he causative factors are the
wor k habi ts of the machines’ user s, the confi gurati on of PM features, and the degree to which
equipment is turned off manually. We defined the following three parameters that descri be those
factors.
1. Dayti me Len gth – the le ngth o f the time d uring which the eq uipmen t is r egular ly use d
2. Dayti me Sta tus – whethe r the equipment is activ e, at low-po wer, o r off during dayti me
3. Night time S tatus – whet her th e equi pment is act ive, a t low- power, or of f duri ng nig hts an d week ends
These par ameter s for commer cial and industrial use are estimated mainly based on the
results of power dat aloggi ng and audit s for night status (Nordman et al. 1998, Nordman et al .
2000, and Brown 2000) . However, we were not able to locat e any compar able data about servers,
minicomputers, and mainfram es, so we made assumptions for those three types of equipment.
The usage param eters for resident ial use are estimat ed based on the survey data (DOE 1999 and
CEMA 1998), other studies (Meyer and Schaltegger 1999) and some assumptions. Although
som e busi nesses are run out of homes and some computers are provided by businesses for use at
hom e, we folded those situations into our residenti al use estim ate.
Based on the estimated parameters, we calculated the average mode di stribution of each
type of office equipm ent. T here i s significant uncertaint y in t he usage for servers, mi nicomputers,
and mainf rames. There are also some uncertainties in resi dential usage because of the lack of
dat a.
Ext ra Energy Use for Printi ng or Copyin g. Ext ra energy use for printi ng or copying is the
energy required beyond the energy used in act ive mode. We estim ated this extra energy use by
com bining the average imagi ng rat e
3
wi th the average ext ra energy use for each image. Making
assumptions about paper use rates
4
and duplexing rates
5
, we esti mated the im aging rate for each
type of equipment. We also assumed the average extr a ener gy use for each im age as 1 Wh for al l
3
Th e imag ing rate is the av erage number of im ages p rinted or co pied b y each unit in a y ear.
4
Th e paper use rate is the averag e amou nt of paper printed or copied by each unit in a year.
5
Th e dup lexing rate repres ents the ratio of images placed onto dup lexed sheets to im ages p laced onto s ingled -sided
sheets. A 100% dup lexing rate uses h alf as much paper as a 0 % dup lexing rate. Dup lexing rate = (imaging r ate –
pap er use rate) * 2 / imaging rate.
7
the types of equipment based on Nordman et al . (1998) and Brown (2000).
Because most assumpti ons ar e based on data ci ted by other paper s or on our own
judgments, ther e are uncert ainties. However, this methodology is potentiall y more accur ate si nce
tot al paper consumpti on is well known, thus limiting the inaccuracies in total energy
consumpti on for print ing or copyi ng.
Uni t Energy Con sumpti on (UEC). UE C is the average annual energy used by each piece of
equipment . The UEC for each type can be descr ibed by Equation 1.
UEC SPM PA HA PL HL PO HO
SPM PA HA HL PO HO EPC
iiiiiiii
iiiiii i
=××+×+×
()
()
×
+−
()
××+
()
+×
()
()
×+
//
//
7 365 10
1 7 365 10
3
3
(1)
where
UEC
i
= Unit Energy Consum ption for eq uipmen t type i ( kWh/year)
i = index for equipment typ e
PA
i
= Averag e active mod e power for equipm ent type i ( W)
PL
i
= Averag e low- power mode p ower for equ ipment type i ( W)
PO
i
= Averag e off mode p ower for equ ipment type i ( W)
HA
i
= Hours of operation in active m ode fo r equipment type i ( hours/week)
HL
i
= Hours of operation in lo w-power mode for equipment typ e i ( hours/week)
HO
i
= Hours of operation in off mode for equipment typ e i ( hours/week)
SPM
i
= Power-m anagem ent-en abled rate for equ ipment type i ( %)
EPC
i
= Extra energy for p rintin g or copying for equipment typ e i ( kWh/year)
6
3 65 = d ays per year
7 = days per week
The UEC f or each type of equipment is shown i n Tabl e 4.
Tab le 4. Best Estimat e of Unit En ergy Consump tion f or Off ice Eq uipmen t in 1999
Equ ipment Type Res identi al UEC
(kWh/year )
Commercia l/Indu strial UEC
(kWh/year )
Por table Computer
Des ktop Computer
Ser ver
Min icompu ter
Mainframe
Ter minal
Dis play
Las er Printer
Ink jet/Do t Prin ter
Cop ier
Fax
8.6
49
*
*
*
*
57
16
22
288
70
24.6
213
560
5,8 40
58,400
183
205
283
74
874
119
* We assu me tha t ther e are no ser vers, minico mputer s, mainframe s, and terminals in the reside ntial sector .
Net work Equipment
Classification. We classi fied network equipment into si x types as shown in Tabl e 5. We did not
include t he swi tching equipment contained in the telephone syst em.
6
EPC
i
is zero for co mputer s, dis plays, and terminals.
8
Table 5. Classification of Network Equipment
Equ ipment Type Def initio n
Rou terWAN
7
Equ ipment
Swi tch
Thr oughpu t-capa city i s mult i-giga bit. I nterfa ces an d cont roller s
are speci alized for WAN (e.g. Cis co 120 00).
Rou ter
Swi tch
Rou ters a nd swi tches usuall y used for LAN (e.g. Cis co 250 0,
450 0, 700 0).
Acc ess De vice Acc ess co ncentr ators and ac cess s ervers
LAN
8
Equ ipment
Hub Pas sive h ubs an d swit ching hubs
Gen eral Methodology. We were unable to get any shipment dat a for networ k equi pment so we
had no al ternat ive but to estimat e ener gy use in the U.S. by using worldwide sales revenue for
each equi pment type. First, we estimated the domest ic sal es revenue during the past four year s by
all ocating the worldwide revenue based on the ratio of the number of host names or domain
nam es in the U. S. to the world. Second, we assumed a repr esentative model for each equi pment
type and estimated the virt ual st ock number of the representati ve model by dividi ng the domestic
revenue by the unit price of the representati ve model. Fi nally, assum ing al l the networ k
equipment operates for 24 hours per day throughout the year, we estim ated annual power use for
each type of network equipm ent by the f ollowi ng equation:
TEC REV PRICE PA
ii ii
=
()
××//8760 1000
(2)
where
TEC
i
= Total annual energ y cons umptio n of a ll equ ipment type i ( kWh/year)
i = index for equipment typ e
REV
i
= Domestic sales revenue for equ ipment type i ( $ )
PRI CE
i
= Price of rep resentative model for eq uipmen t type i ( $)
PA
i
= Averag e active-mod e power of r epresentative model for equipm ent type i ( W)
8,760 = hou rs per year
Res ults and Dis cussion
Results
Tables 6 and 7 show annual energy use for offi ce equipment and network equipment,
whi ch tot als 74 TWh/year for both types of equipment.
Figure 2 shows the percentage of annual energy use by residenti al, commerci al, and
industrial offi ce equipment and network equipment. Commer cial office equipm ent accounts for
mor e than 70% of ener gy use, ener gy use for network equipment is less than 5%, and the
rem ainder is evenly split between residential and i ndustr ial.
Figure 3 shows the percentage of annual energy consumed in acti ve, low-power , off, and
pri nting/ copying mode. We found that 86% of all energy ( 64 TWh/year) is consumed in active
mode, and 4% of all energy (3 TWh/year) is consumed in of f mode.
7
WA N mean s Wide Area Networ k.
8
LAN means Local Area Networ k.
9
Tab le 6. Best Estimat e of Annual Energy Use b y Offi ce Equ ipment in 1999 (TWh/year)
Equ ipment Type Res identi al Commercia l Ind ustria l Tot al
Por table Computer
Des ktop Computer
Ser ver
Min icompu ter
Mainframe
Ter minal
Dis play
Las er Printer
Ink jet/Do t Prin ter
Cop ier
Fax
0.1 4
2.6 7
0
0
0
0
3.1 3
0.1 0
1.1 0
1.1 0
0.4 4
0.1 3
10.21
1.6 0
8.8 6
5.6 2
1.8 3
9.8 2
5.3 6
1.5 6
5.7 1
2.2 6
0.0 2
1.4 6
0.2 3
2.9 5
0.6 3
0.6 1
1.4 0
0.7 7
0.2 2
0.8 2
0.3 2
0.2 9
14.34
1.8 3
11.81
6.2 5
2.4 4
14.35
6.2 3
2.8 8
7.6 3
3.0 2
Total 8.6 7 52.95 9.4 2 71.04
Fig ure 2. Per centag e of Annual Energy Use Fig ure 3. Pe rcenta ge of Annual Energ y Use
by Sector at the end of 199 9. by Power Mode a t the end of 1999.
Tab le 7. Best Estimat e of Annual Energy Use b y Network Eq uipmen t in 1999 (TWh/year)
Equ ipment Type Ann ual En ergy Use
WAN Rou ter
Switch
0.0 5
0.2 4
LAN Rou ter
Switch
Access Device
Hub
0.6 8
1.3 1
0.2 9
0.6 5
Total 3.2 2
Residential
11.7%
Commercial
71.3%
Industrial
12.7%
Network
4.3%
Active
86.3%
Low-Power
8.6%
Off
3.8%
Printing or
Copying
1.3%
10
Energy Savings by Power Man agemen t and Night Shutdown
Figure 4 shows a breakdown of annual energy use by equipm ent type in the following
cases: 0% satur ation of PM; best estimates of current PM saturation and operation; complete
sat uration of properl y functioning PM; and complete satur ation of PM with complet e night
shutdown of all office equi pment except servers, mi nicomputers, mainf rames and faxes.
Fig ure 4. Elect ricity Use by Equi pment Type a s a Function of Po wer-Ma nageme nt Lev els
0
10
20
30
40
50
60
70
80
90
100
0% Saturation
of PM
Current Case
(1999)
100%
Saturation of
PM
100%
Saturation of
PM & Night-Off
Portable Computer
Desktop/Deskside Computer
Display
Terminal
Laser Printer
Inkjet Printer
Copier
Fax
Server Computer
Mini Computer
Mainframe Computer
Network Equipment
Annual Energy Use (TWh/year)
11
Cur rent saturat ion of PM has achi eved energy savings of 23 TWh/ year, compar ed to the
hypotheti cal case wit h 0% PM present and enabled. Complet e saturation of PM (capability and
enabling) would save an additional 17 TWh/year. Most of these savings would come from
desktop computers, di splays and copiers since the PM-enabled rate for deskt op com puters is low
(= 25%) and the power reductions from PM for displays and copiers are large (for displays,
act ive power = 85 W, low power = 5 W; f or copiers, power in aut o-off is less than 10 W) .
Fur thermore, complete satur ation of night shutdown for al l equi pment except servers,
minicomputers, mainfr ames, and faxes would reduce energy use by an extra 7 TWh/year. Most
of these savings woul d be achieved by night shutdown of desktop computers and laser pri nters
since power reductions by night shutdown for desktop computers and laser pr inters are large
(low-power level for desktop computers and laser pr inters is 25 W) and laser printers are
frequentl y left on at night (according to our survey, 73% of laser pr inters are on at night).
Uncertain ty
For all the input dat a for office equipment, we conducted sensi tivity analyses to evaluate
the uncer tainty in our esti mates of energy use. We estimated the error range for each piece of
input dat a and calcul ated the resulting error range in our esti mate of annual energy use caused by
the error associated with each pi ece of input data. We found that the uncer tainti es in the
fol lowing data have the lar gest impact on our estim ate of annual ener gy use, with each
contribut ing potential error greater than 2 T Wh/year:
1. Stock of com mercial/industrial deskt op com puters, displays, minicomputer s, mai nframes,
laser pri nters, and copiers;
2. Active power requi rement s for minicomputer s;
3. Usage for commercial/ indust rial desktop computers, minicomputer s, and displ ays.
To check whether our estimate for LAN network equipment is reasonable or not, we
est imated the power requirement of the LBNL network equipment, which connects about 5,000
com puters, and compar ed the resul t with our estimat e by scaling the L BNL network to the size of
all networks in the U.S. We found that the total di fference in LAN network energy per personal
com puter was less than 20% between LBNL and the U.S . We were not able to check the
accuracy of our estim ate for WAN equipm ent though we are confident that the total error in our
est imate for network equipm ent is less than 1.5 TWh/year.
Com parison with Our 1995 Forecast
We compar ed our current est imate for commerci al off ice equipment with our 1995
for ecast for the year 1999 (Koomey et al. 1995). Results are shown in Figur e 5 for the office
equipment types that are common to both studi es. The total diff erence is less than 15%. Energy
use for desktop computers, printers, and displays is higher than in our 1995 forecast. This
dif ference arose because desktop comput ers and laser printers are lef t on at night more frequently
than we expected and also because active power for displays is higher than we expected (active
power for displ ays is 85 W; while our previous forecast was 63 W) . Ther e is little differ ence in
energy use for minicomputer s and mainfr ames.
12
Fig ure 5. Compa rison of Cur rent Forecas t of Commerc ial Of fice Equipme nt Ele ctrici ty Use and
199 5 Fore cast ( Koomey et al . 1995 )
Conclusions and Futur e Work
Annual energy use by office and network equipment is about 74 TWh/year, whi ch is
about 2% of tot al U.S . electricit y consumption today. When electricit y used by
tel ecommunicati ons equipment and electr onics manufacturing is i ncluded, that figure rises to 3%
of all el ectricity use (Koomey 2000).
Mor e than 70% of the 74 TWh/year is dedicated to of fice
equipment for commercial use, and less than 5% is for net work equipment. The rest is split
equally between residential and industr ial uses. About 3 TWh/year, which is 4% of all t he energy
use, is consumed in off mode.
Cur rent energy savings achi eved by power management are estimat ed at 23 TWh/year.
Com plete saturation and proper functioning of PM would achieve additi onal savings of 17
TWh/year. Furthermore, complete saturat ion of night shutdown for appl icable equipment types
would reduce power use by an extr a 7 TWh/year .
The difference between the current esti mate and our previ ous forecast (Koom ey et al.
1995) is less than 15%. The differences are caused mainly by the fact that people leave office
equipment on at night more frequently t han we predi cted in 1995. Equi pment with P M oper ating
may be left on at night mor e frequently than conventional equipment. A sensitivit y anal ysis
showed that the most import ant uncertai nties in our current est imate involve comm ercial and
industrial stocks of minicomputer s, mai nframes, desktop computers, di splays, laser printers,
copiers, and the usage patt erns of resi dential desktop computer s and displays.
Thi s study esti mated the energy use and the energy savings potential for current office
equipment . However, office and network equipment changes rapidly. New equi pment such as
0
10
20
30
40
50
60
Koomey's 1995 Forecast for 1999 Current Best Estimate for 1999
Printers
Desktop/Portable/Server Computers
Displays/Terminals
Mainframe/Minicomputers
Copiers/Faxes
Annual Energy Use (TWh/year)
13
int ernet appliances, web phones, and palm-size computers are al ready available. We need to
est imate energy use for such equi pment in the near future. We also need to estimate the energy
used by the tel ephone system, whi ch is not included in our curr ent estimates. Additionally, we
need to consider that the use of office and network equipment m ay inf luence energy and resour ce
use in indirect ways that can be import ant. A compl ete assessment of these effect s is beyond the
scope of this paper but is a wort hy topic of future research.
Acknowledgments
Thi s anal ysis was conducted principally by Kaoru Kawamoto under the supervi sion of
Jonathan Koomey and with the advi ce and assistance of the other coauthors. Thi s work was
supported by the Offi ce of Atmospheric Programs of the U. S. Environmental Protect ion Agency
and prepared for the U.S. Departm ent of Energy under Cont ract No. DE- AC03-76SF0098. We
would like to thank Skip Laitner at EPA for funding this work. We would also thank Jeff Harri s
and Karen Rosen of LBNL and Kurt Roth of A.D. Litt le, Inc. for their helpf ul com ments.
Reference s
Appliance. 1999. Appl iance 46
th
Annual Report: Stati stical Review. pp 51-54.
Brown, R. 2000. “Power Consumption of Commercial Pr inters.” Draft LBNL report.
CEMA (Consumer Electr onics Manufacturing Association). 1998. “Digital Camer a Interest and
Awareness – November 1998.” Available at <htt p://www.ebrain.org/>.
CEMA (Consumer Electr onics Manufacturing Association). 1999. “CE Product Ownershi p –
February 1999.” Available at <htt p://www.ebrain.org/>.
IBM (International Business Machi nes). 1999. “Energy Use Compar ison of AS/400 Products. ”
Available at <htt p://www-1.ibm.com/ server s/eser ver/iseries/ greenpen/ecp11.htm >.
Inf ormati on Technology Industry Council . 1998. Inf ormati on Technology Industry Data Book,
1960-2008. Washingt on, D. C.: Informat ion Technology Industry Counci l.
Koomey, J.G., Cramer, M., Piette, M.A., and J.H. Eto. 1995. “Eff iciency Impr ovements in U.S.
Off ice Equipment: Expected Policy Impacts and Uncer tainti es.” LBNL-37383.
Ber keley, CA: Lawrence Berkeley National Laboratory. Also avai lable at
<htt p://enduse.l bl.gov/projects/of feqpt. html>.
Koomey, Jonathan G. 2000. Rebuttal to Testimony on ‘Kyoto and the Internet: The Energy
Implicati ons of the Digital Economy’. Berkeley, CA: Lawrence Berkeley National
Laborator y. LBNL-46509. August. <htt p://enduse.l bl.gov/projects/infotech.html>.
Meyer & Schaltegger AG. 1999. “Bestimmung des Energieverbrauchs von
Unt erhalt ungsel ektronikgeraten, Bur ogerat en und Aut omaten in der Schweiz.” St.
14
Gal len, S witzer land: Federal Offi ce for Energy.
Nor dman, B., Meier, A., and M.A. Pi ette. 2000. “PC and Moni tor Ni ght St atus: Power
Management Enabling and Manual Turn-off .” LBNL-46099. Berkeley, CA: Lawrence
Ber keley National Laborator y.
Nor dman, B., Pi ette, M.A., Pon, B., and K. Kinney. 1998. “It’s Midnight … Is Your Copier On?:
Energy St ar Copier Performance.” LBNL-41332. Berkeley, CA: Lawrence Berkeley
Nat ional Laboratory.
US DOE (US Department of Energy). 1997. “Manufactur ing Consumpt ion of Energy 1994.”
DOE /EIA-0512(94). Washington D.C. : Ener gy Inf ormati on Adm inistr ation.
US DOE (US Department of Energy). 1998. “A Look at Commer cial Buildings in 1995:
Character istics, Ener gy Consumpti on, and Ener gy Expenditures.” DOE /EIA-0625(95).
Washington D.C. : Ener gy Inf ormati on Adm inistr ation.
US DOE (US Department of Energy). 1999. “Resi dential Ener gy Consumpti on Sur vey (RECS):
Household Energy Consumption and Expenditures 1997. ” DOE /EIA-0632(97).
Washington D.C. : Ener gy Inf ormati on Adm inistr ation.
US EPA (US Envi ronmental Pr otecti on Agency). 2000. “Energy Star Label ed Off ice
Equipment .” Washington, DC: US EP A, Cli mate Protect ion Di vision, Energy St ar
Labeling Branch. Avai lable at <htt p://www.epa. gov/appdstar /esoe/ index. html>.
15
APPENDIX
Thi s appendix present s the detail ed assumptions of the calculat ions present ed in the main par t of
the repor t. It descri bes equipment lifetimes, shipm ents, stocks, power requirements, hourly usage,
power-management-enabling rates, and extra energy used for printing and copying. It also
provides a detailed uncertainty analysi s and compar ison with our 1995 forecast (Koomey et al.,
1995). There ar e two major sections, one for office equipment and one for network equipment.
I. OFFICE EQUIP MENT
Lif etimes of Of fice Equipment
Equipment lifet ime is a cri tical factor in the esti mation of st ocks. The meaning of “li fetime” in
thi s cont ext is the total amount of tim e equi pment is used, not just by the origi nal owner but by
all subsequent owners. Furt hermor e, “li fetime” measures the tot al amount of time equipm ent is
act ually in use (not just their lifetim e unti l disposal) since some equipment, particul arly
com puters and printer s, can linger for several year s without being pl ugged in or turned on before
bei ng disposed.
In Koomey et al . (1995), the calculated stocks were compared wi th those der ived from reported
equipment satur ations (wher e data were available) to help validate assumpti ons about equipment
lif etimes. In this st udy, we assumed the same lifet imes as those used in Koomey et al. (1995) .
The average lif etime for each type of office equipm ent is shown in Table A- 1.
Table A-1. Average Office Equipment Lifetimes
Equipment Type Lif etime (years)
Por table Comput er 4
Des ktop Compute r 4
Ser ver Co mputer 4
Min icompu ter 8
Mai nframe Compu ter 9
Ter minal 4
Dis play 4
Las er Pri nter 6
Ink jet Pr inter 6
Cop ier 6
Fax 6
Shi pments of Of fice Equipment
The shipm ent data are derived from actual sal es dat a and estimates made by the Informat ion
Technology Industry Council (1998) and Appliance Magazine (1999).
Mul ti-function devices (MFDs) fal l into sever al dif ferent categories. While there are no good
energy data for these categories, all indicat ions are that the energy use of each type of MFD
behaves similar ly to a conventional single-function device (e.g., copier, laser printer , or inkjet
pri nter) and so can be aggr egated with these types of devices for energy estimates. Sal es dat a
generally cite MFDs separately, so we separate the MFDs by type and aggr egate them as
appropriate to single-funct ion categori es.
16
We split the sales of laser print ers and copi ers respecti vely into three cl asses based on pri nting or
copying speeds. This is useful for esti mating average power requirements, because power
requirements depend heavily on pr inting or copying speed. We could not spli t the sales of copiers
from 1991 to 1993 because of a lack of data. However, we could nonetheless estimate the stock
of copier s by assuming that the average lifet ime of copiers is 6 year s.
We did not need sales data for di splays, because we assum ed the stock of di splays is same as that
of desktop computers.
Table A-2 shows shipm ents of each type of off ice equipment from 1991 to 1999.
Tab le A-2. Offi ce Equ ipment Sales from 1991 t o 1999 (thou sands)
Equ ipment Type
199 1 199 2 199 3 199 4 199 5 199 6 199 7 199 8 199 9
Portable Computer 1,7 11 2,1 11 2,6 32 3,5 33 4,2 68 5,1 90 6,0 25 6,6 65 7,3 32
Desktop + Server 7,8 21 9,7 63 13,059 14,756 18,109 21,393 25,775 30,035 35,239
Min icompu ter 237 242 247 252 256 252 263 255 255
Mainframe 12 12 12 12 11 12 12 12 12
Terminal 3,0 05 3,1 30 3,2 25 3,3 10 3,3 50 3,3 00 3,3 10 3,3 40 3,3 80
Laser Printer to tal
<8 ppm
8-12ppm
>12 ppm
2,9 00
1,0 00
1,9 00
0
2,9 00
1,2 00
1,7 00
0
3,3 50
1,7 00
1,0 00
650
4,2 13
1,7 47
1,1 30
1,3 36
4,3 23
1,8 16
1,0 95
1,4 13
4,4 45
1,6 47
1,0 48
1,7 23
4,6 72
1,2 59
1,6 40
1,7 73
5,0 65
801
1,8 08
2,4 57
5,2 69
485
2,0 08
2,7 75
Ink jet Printer 836 1,7 00 3,5 00 5,7 54 9,0 41 9,2 44 13,081 16,479 20,475
Cop ier total
<21 cpm
21-44cpm
>44 cpm
1,4 44 1,4 66 1,5 23 1,6 30
1,0 59
359
212
1,7 01
1,0 52
390
258
1,8 98
1,1 15
461
322
1,9 54
1,1 27
488
339
2,0 11
1,1 33
519
359
2,0 64
1,1 37
541
386
Fax 1,9 66 2,1 41 2,3 86 2,5 26 2,7 78 4,3 45 5,5 29 6,0 82 6,6 90
Residenti al Stock of Office Equip ment
Portable Comput ers, Desktop Compu ters, and Di splays. According to the Consumer
Electroni cs Manufacturing Association (CEMA), 42% of U.S. households had one desktop
com puter, and 5.7% of U.S. households had mor e than one desktop computer in 1999. CEMA
also says 13% of U.S. households had one port able computer, and 1.3% of U.S . households had
mor e than one portabl e computer in 1999 (CEMA 1999) . According to Mor isette (1999), 52
mil lion households had at least one com puter (deskt op or portable com puter) in 1999. According
to the U. S. Department of Energy (DOE) (1999) , 35.6 milli on households had at least one
com puter (deskt op or portable com puter) in 1997. Si nce there has been explosive growth in the
residenti al stock of comput ers over the last five years, the DOE data appear outdated. Although
the CEMA number s appear high, onl y CEMA expli citly report s the saturation of port able
com puters, so we use the CE MA dat a for our best est imate.
Assuming that all households that have more than one desktop or portable computer have two
desktop or two portable com puters, respectively, we estim ated the residenti al sat uration of
desktop and por table comput ers as 0.53 and 0. 16 uni ts/household, respectively. The number of
U.S . households is estimated to be about 101 million in 1998 (U.S. Census Bureau 1999).
Mul tiplyi ng the residential satur ation of com puters by the number of U.S. households, we
est imated the residential stock of desktop and port able computers as 55 mil lion and 16 million,
respectively.
17
We assumed the residential stock of displays is sam e as t hat of deskt op com puters.
Laser Pri nters and In kjet Printers. According to CEMA (1998), 16% or 16.2 million U.S.
households have laser print ers. Accordi ng to US DOE (1999), 12. 6 mill ion househol ds had laser
pri nters in 1997. Bot h the CEMA and DOE estim ates account for more than hal f of the tot al
stock of laser printers (even excluding MFDs, in the case of DOE). In other wor ds, both of these
sur vey results indicate that the residential stock of laser pri nters is lar ger than the commercial
stock. However, we believe this result is unr ealist ic. We concl ude that the inaccuracy is a result
of the tendency of survey respondents to mist ake inkjet printer s for laser printers. We assum ed
that this error was made in 50% of cases; therefore, we estimat ed the residential stock of laser
pri nters at 6.3 milli on, which is half of the DOE estimat e. We assumed that all residential laser
pri nters are low-speed models (< 8 pages per minute or ppm ).
To estimate the residential stock of al l types of printer s, we assumed that 80% of resi dential
com puters (incl uding both desktop and portabl e computers) have printers. Our esti mate of the
tot al stock of residential printers was thus 56.5 m illion.
Finally, by subtracti ng the residential stock of laser pr inters from the total st ock of residential
pri nters, we estimated the residential stock of inkjet pr inters as 50.2 mil lion.
Copiers and Faxes. According to DOE (1999), 3.8 million households had copiers and 6.3
million households had faxes in 1997. Assuming there are no households that have more than
one copier or fax, we estimated the residential stock of copiers and faxes as 3.8 million and
6.3 million, respectively. We also assumed that all residential copiers are low-speed models
(<21 copies per minute or cpm).
Sep aratin g the Stock of Servers f rom Desktop Comput ers
Com puters can be generally classi fied into cl ient-use and server-use comput ers. Most
minicomputers and mai nframes are server -use computers, but ther e are both client- and server-
use computers among microcomputer s (com puters whose price are lower than $25,000) . The
usage and power requi rement s are differ ent for client- and server-use computers, so we divided
the stock of mi crocom puters into these two categori es.
As defined in Table 1, client-use deskt op-deskside microcomputers (desktop- deskside comput ers
whose pri ce is lower than $25,000) are referr ed to here as “desktop computers” and server-use
desktop-deskside microcomputers are refer red to as “servers”.
From Tabl e A-1 and A- 2, we calcul ated the tot al stock of desktop computers and servers
com bined (112 million). By subtracting our st ock estimate for residential desktop computers (55
mil lion) and assuming that all servers are used in non-resident ial applicat ions, we arr ive at a
stock est imate of 58 million for all non-resi dential computers (deskt ops and servers). We then
used Tabl es A-1 and A-2 to calcul ate the stocks of minicomputer s and mainfr ames (2.0 and 0.11
mil lion, respectively). Next we assumed that the total st ock of server-use comput ers (i ncludi ng
ser vers, minicomputer s, and mainf rames) is 10% of the stock of non-resident ial desktop
com puters, based on forecasts of server stocks publ ished by the Business Technology
Associati on (2000). We then estim ated the stock of server -use computers and non-r esidential
desktop computers at 5.45 m illion and 54.6 mi llion, respectivel y. Finally, by subtracti ng the total
18
stock of minicomputer s and mainfr ames from the stock of server- use computer s, we estimated
the stock of servers at 3.33 mill ion.
All ocatin g Non- Residential Stock into Commercial an d Indu strial Stock s
For all types of equi pment except minicomputers, mainfram es, and term inals, we assumed that
the ratio of commerci al stock to indust rial stock is equal to the rat io of commer cial floor space to
industrial conditioned floor space. According to DOE (1998), total commerci al floor space in the
U.S . is about 60 bill ion square feet. Accordi ng DOE (1997), tot al industrial conditioned floor
space is 8.4 bi llion square feet. Based on these data, we estim ated the rat io of commer cial stock
to indust rial stock at 7 : 1.
For minicomputers, mainfram es, and term inals, we assumed the same rat io as used i n Koom ey et
al. (1995).
Table A-3 shows the commercial and industrial shares of non-residenti al off ice equipment stock.
We split non-resident ial st ock into com mercial and indust rial stocks based on these rat ios.
Table A-3. Commercial and Industrial Shares of Non-Residential Office Equipment
Stock
Equ ipment Type Ind ustria l Shar e Commercia l Shar e
Portable Comput er 12. 5% 87. 5%
Des ktop C omputer 12. 5% 87. 5%
Server 12. 5% 87. 5%
Min icompu ter 25. 0% 75. 0%
Mai nframe 10. 0% 90. 0%
Terminal 25. 0% 75. 0%
Dis play 12. 5% 87. 5%
Las er Pri nter 12. 5% 87. 5%
Ink jet Printer 12. 5% 87. 5%
Cop ier 12. 5% 87. 5%
Fax 12. 5% 87. 5%
Power Requirements of Office Equipment
Gen eral Methodology. For all equipment types except servers, minicomputers, and mainframes,
we estimated the power requirements based pri marily on our own measur ements or
measurements made by others. To calculate power levels for copi ers and laser printers, we use a
wei ghted average of power levels across device speeds since power levels vary considerably by
the speed (images/minute) of each unit.
We assumed that the power requirements for commerci al and industrial equipm ent ar e the same.
We also assumed that the power requirem ents for residenti al equipment are t he sam e as t hose for
com mercial and indust rial use except for desktop computer s, laser pri nters, and copiers.
Results. Table A-4 shows the weighted average power requirement for each type of office
equipment.
19
Table A-4. Power Requirements for Office Equipment
Equ ipment Type Active
(W)
Low-Power
(W)
Off
(W)
Por table Computer 15 3 2
Des ktop Computer Residential Use
Com mercial/Indu strial Use
50
55
25
25
1.5
1.5
Ser ver 75 25 1.5
Min icompu ter 1,0 00 500 0
Mainframe 10,000 5,0 00 0
Ter minal 75 5 0.5
Dis play 85 5 0.5
Las er Printer Residential Use
Com mercial/Indu strial Use
30
77
20
25
1
1
Ink jet Pr inter 17 * 2
Cop ier Residen tial U se
Com mercial/Indu strial Use
115
185
62
76
1.5
8.7
Fax 11 * 0
Notes on Portable Computers
Active Mode – According to measurements by Lawrence Berkeley National Laboratory
(LBNL), the active-mode power requirements of portable computers range from 12 W to 22
W when the battery is fully charged. We estimated the average active-mode power
requirement at 15W. Because of the limited set of measurements, there is uncertainty
associated with this estimate.
Low-Power Mode – According to measurements by LBNL, the power requirements of
portable computers in low-power modes range from 1.5 W to 6 W when the battery is fully
charged. According to Nordman et al. (1997), the average power requirement for low-power
mode is 3W. We estimated the average power requirement in low-power mode at 3W.
Because of the limited set of measurements, there is uncertainty associated with this estimate.
Off Mode – According to a measurement by LBNL, off-mode power requirements range
from 1.5 W to 2 W when the battery is fully charged. We estimated the average off-mode
power requirement as 1.5 W. Because of the limited number of measurements, there is
uncertainty associated with this estimate.
Not es on Desktop Computers
Active Mode – The average active power requirement of PCs varies considerably, with some
machines using less than 30 W and others using more than 55 W. According to the
specification tables for IBM PCs, the average active power requirements of new home and
business PCs are about 50 W and 65 W, respectively. According to measurements by LBNL,
the average active power requirement of Macintoshes, Pentium PCs, and pre-Pentium PCs
are 47 W, 54 W, and 50 W, respectively. We estimated the average active power
requirements of the residential and non-residential desktop computer stock at 50 W and 55
W, respectively.
Low-Power Mode – According to the U.S. Environmental Protection Agency (EPA) (2000),
the average power requirement of new E
NERGY STAR compliant PCs in low-power mode is
20
about 25 W. We estimated the average low-power mode power requirement of desktop
computers at 25 W. We assumed that there is no difference in the power requirements of
residential and non-residential desktop computers in low-power mode.
Off Mode – According to measurements by LBNL, the off-mode power requirements of
Macintosh computers range from 2 W to 3 W, and the off-mode power requirement of PCs is
less than 1 W. We estimated the average off-mode power requirement of desktop computers
at 1.5 W. Because of the limited number of measurements, there is uncertainty associated
with this estimate. We assumed there is no difference in the off-mode power requirements of
residential and non-residential desktop computers.
Not es on Server Compu ters
Active Mode – The average active power requirement for server computers varies
considerably, since some servers are simply high-end regular PCs while others are
specifically manufactured as servers and have more capabilities and higher power demand.
The line between a high-end server and a minicomputer is not clear.
According to measurem ents by LBNL , the active-mode power requir ements of server computers
range from 50 W to 270 W. Server comput ers whose power requirem ents are higher than 100 W
usually have more than one CPU. We esti mated the average active-mode power requir ement at
75 W. Because of the limited number of measur ements, there is uncertaint y associated with this
est imate.
Low-Power Mode, Off Mode – We assumed the power requirements for server computers in
low-power mode and off mode are same as those for desktop computers. Again because of
the limited number of measurements, there is uncertainty associated with this estimate.
Not es on Mainframes ( with P eripherals)
Active Mode – It is difficult to estimate the average power requirement of mainframe
computers because of:
1. The wide range of power requirements for Cent ral Pr ocessi ng Uni ts
1
(CPUs) and the
var ying t he num ber of CPUs used i n mainframe comput ers.
2. The various kinds of peripherals associ ated with mainfram es such as external discs and
tapes.
3. The recent decr eases in power requirements resulting from the emergence of C-MOS
technology and internal disc syst ems.
4. The lack of measured data.
We separated the stock of mainframes into stock shi pped between 1996 and pr esent (55%) and
stock shi pped before 1996 ( 45%).
We assumed that the IBM S/390 is a repr esentative machine for new stock based on sales data
1
We use th e term “CPU” for the cen tral p rocess ing un its, m otherb oards, and p ower s upplies of m inicom puters and
mainframes. Per ipherals such as tape dr ives and external disks are no t included in CPUs .
21
and its close-t o-the- average price for mainfr ames. We est imated the power requirement of the
CPU and internal discs at 2.0 kW by assuming that the power requirement is approximatel y half
of the rated power requirem ent. We also assum ed the power requi rement for per ipherals (tapes,
etc.) is 2.0 kW. Thus, the average power requirement of the new stock of mainfram es plus
per ipherals was estim ated at 4.0 kW.
Based on Koomey et al . (1995), we estim ated the average power requirement of the old st ock of
mai nframes with peripherals at 13.3 kW.
Finally, based on a wei ghted average of power requirements for the new and ol d stock, we
est imated the average power requi rement for mainframes at 10 kW. Ther e is signifi cant
uncertainty in this estimat e.
Low-Power Mode – Based on Koomey et al. (1995), we define the low-power mode for
mainframes as the time when peripherals are off at night. Low-power mode of mainframes
does not mean power management; it means that peripherals are off but CPUs are still on.
We estimated that the average power requirement for mainf rames in low-power mode is 5.0 kW
since the power requi rement of peripher als accounts for about half of the active- mode power
requirements of mainf rames. There is si gnificant uncertai nty in this estimate.
Off Mode – Off mode for mainframes describes machines that have useful life but are not
plugged in, such as spares. Therefore we assumed the off-mode power requirement of
mainframes to be 0 W.
Not es on Minicomputers (wit h Peri pheral s)
Active Mode – It is difficult to estimate the average power requirement of minicomputers
because of:
1. The wide range of power requirements for CPUs and the var ying number of CPUs used in
minicomputers.
2. The various kinds of peripherals associ ated with mi nicomputers such as external discs and
tapes.
Based on sales data, we assumed t hat the IBM AS/400 is a representati ve minicomputer machine.
We estimated the aver age power requirem ent of the CPU and inter nal di scs as 500 W based on
measured data (IBM 1999). By assuming that the power requirement for peripherals is also 500
W, we est imated the average power requi rement of mi nicomputers as 1.0 kW. There is
significant uncertainty in this estimat e.
Low-Power Mode – As with mainframes, the low-power mode of minicomputers does not
mean power management; it means that peripherals are off but CPUs are still on. We
estimated that the average power requirement for minicomputers in low-power mode is 500
W since the power requirement of peripherals accounts for about half of the active-mode
power requirements of minicomputers. Again, there is uncertainty in this estimate.