After-hours Power Status of Office Equipment and Inventory of Miscellaneous Plug-Load Equipment doc
Bạn đang xem bản rút gọn của tài liệu. Xem và tải ngay bản đầy đủ của tài liệu tại đây (348.46 KB, 33 trang )
LBNL-53729
After-hours Power Status of Office Equipment and
Inventory of Miscellaneous Plug-Load Equipment
Judy A. Roberson, Carrie A. Webber, Marla C. McWhinney,
Richard E. Brown, Margaret J. Pinckard, and John F. Busch
Energy Analysis Department
Environmental Energy Technologies Division
Ernest Orlando Lawrence Berkeley National Laboratory
University of California
Berkeley CA 94720, USA
January 2004
To download this paper and related data go to:
/>The work described in this paper was supported by the Office of Atmospheric Programs, Climate
Protection Partnerships Division of the U.S. Environmental Protection Agency and prepared for the U.S.
Department of Energy under Contract No. DE-AC03-76SF00098.
LBNL-53729
i
Table of Contents
Table of Contents i
List of Tables, List of Figures ii
Abbreviations, Acronyms, and Glossary of Terms iii
Acknowledgements iv
Abstract 1
Introduction 2
Methodology 3
Building Sample 3
Survey Protocol 5
Office Equipment Data Collection 5
Miscellaneous Equipment Data Collection 6
Limitations of This Methodology 7
Results and Discussion 7
Equipment Density 7
Office Equipment 8
Computers 9
Laptop Computers 10
Monitors 11
Printers 14
Multi-Function Devices 15
Copiers 15
Fax Machines 15
Scanners 16
Office Equipment: Comparison of 2000 and 2003 Turn-off and PM Rates 16
Miscellaneous Equipment 17
External Power Supplies 18
Conclusions 19
Future Work………………………………………………………………………………………21
References 22
Appendix A: Building Descriptions 23
Appendix B: Flowchart for Auditing Desktop Computer Power State 25
Appendix C: Miscellaneous Equipment Taxonomy 26
Appendix D: Miscellaneous Equipment Numbers, by Category and Site 27
LBNL-53729
ii
List of Tables
Table 1. Building Sample and Computer Density ______________________________________________4
Table 2. Office and Miscellaneous Equipment: Number of Units and Density ________________________7
Table 3. Office Equipment: After-hours Power States __________________________________________9
Table 4. Ratio of Laptop to Desktop Computers at Two Sites____________________________________11
Table 5. Analysis of Monitor Power Management by Computer Power State________________________11
Table 6. Number and Percent of LCD Monitors, by Site________________________________________13
Table 7. Office Equipment Turn-off and Power Management Rates_______________________________16
List of Figures
Figure 1. Comparison of LBNL and CBECS Commercial Building Samples 5
Figure 2. Office and Miscellaneous Equipment Density, by Building Type (and number) 8
Figure 3. Office Equipment Power States 10
Figure 4. Monitor After-hours Power Status, by Building Type 13
Figure 5. Printer Sample, by Technology 14
Figure 6. Laser Printers: Powersave Delay Settings 14
Figure 7. Fax Machine Technology 15
Figure 8. Miscellaneous Equipment Numbers, by Category and Building Type 18
Figure 9. External Power Supplies: Number, Type and Frequency 19
LBNL-53729
iii
Abbreviations, Acronyms, and Glossary of Terms
As Used in This Report
CRT cathode ray tube (monitor)
CPU central processing unit
ICS integrated computer system, in which computer and monitor share a power cord, (e.g., an LCD
monitor powered through a computer) and may also share a housing (e.g., an Apple iMac)
ILPS in-line power supply: a type of external power supply found on the cord between the plug and
the device; aka “fat snake” because it looks like the power cord swallowed a box or cylinder
LBNL Lawrence Berkeley National Laboratory (aka LBL or Berkeley Lab)
LCD liquid crystal display (monitor)
MFD multi-function device: a unit of digital equipment that can perform at least two of the following
functions: copy, fax, print, scan
OEM original equipment manufacturer
OS operating system (e.g., Windows XP or Mac OS X)
PC personal computer: a generic term that includes laptop computers, desktop computers and
integrated computer systems; it includes both Apple and Intel-architecture machines
PDA personal digital assistant; a cordless (i.e., rechargeable) hand-held computer device
PIPS plug-in power supply: a type of external power supply that is incorporated into the cord’s plug;
aka “wall wart”
PM power management: the ability of electronic equipment to automatically enter a low power
mode or turn itself off after some period of inactivity; PM rate is the percent of units not off
that are in low power.
PM rate: the extent to which a given sample or type of equipment is actually found to have automatically
entered a low power mode or turned itself off.
PM Enabling rate: the extent to which settings in the user interface of a given sample or type of
equipment indicate the equipment is set to automatically enter low power or turn itself off.
XPS external power supply: a power supply external to the device that it powers; a voltage
regulating device incorporated into either the power cord or the wall plug of a device
LBNL-53729
iv
Acknowledgements
This study would not have been possible without the support of the ENERGY STAR Office Equipment and
Commercial Buildings programs, as well as the cooperation of the owners and facility managers of the
businesses, institutions, and organizations that participated, and whose anonymity we promised to maintain.
We would like to thank our reviewers: Jim McMahon, Bruce Nordman, and Steve Greenberg of LBNL;
Kent Dunn and Michael Thelander of Verdiem: Energy Efficiency for PC Networks, Seattle WA;
and Terry O’Sullivan of Energy Solutions, Oakland CA.
LBNL-53729
1
After-hours Power Status of Office Equipment and
Inventory of Miscellaneous Plug-Load Equipment
Judy A. Roberson, Carrie A. Webber, Marla C. McWhinney,
Richard E. Brown, Margaret J. Pinckard, and John F. Busch
Abstract
This research was conducted in support of two branches of the EPA ENERGY STAR program, whose overall
goal is to reduce, through voluntary market-based means, the amount of carbon dioxide emitted in the U.S.
The primary objective was to collect data for the ENERGY STAR Office Equipment program on the after-
hours power state of computers, monitors, printers, copiers, scanners, fax machines, and multi-function
devices. We also collected data for the ENERGY STAR Commercial Buildings branch on the types and
amounts of “miscellaneous” plug-load equipment, a significant and growing end use that is not usually
accounted for by building energy managers. This data set is the first of its kind that we know of, and is an
important first step in characterizing miscellaneous plug loads in commercial buildings.
The main purpose of this study is to supplement and update previous data we collected on the extent to
which electronic office equipment is turned off or automatically enters a low power state when not in active
use. In addition, it provides data on numbers and types of office equipment, and helps identify trends in
office equipment usage patterns. These data improve our estimates of typical unit energy consumption and
savings for each equipment type, and enables the ENERGY STAR Office Equipment program to focus future
effort on products with the highest energy savings potential.
This study expands our previous sample of office buildings in California and Washington DC to include
education and health care facilities, and buildings in other states. We report data from twelve commercial
buildings in California, Georgia, and Pennsylvania: two health care buildings, two large offices (> 500
employees each), three medium offices (50-500 employees), four education buildings, and one “small
office” that is actually an aggregate of five small businesses. Two buildings are in the San Francisco Bay
area of California, five are in Pittsburgh, Pennsylvania, and five are in Atlanta, Georgia.
LBNL-53729
2
Introduction
Since the 1980s there has been continual growth in the market for electronic office equipment, particularly
personal computers and monitors, but also printers and multi-function devices (MFDs), which are replacing
discrete copiers, fax machines and scanners in some office environments. According to 2003 projections
by the Department of Energy, annual energy use by personal computers is expected to grow 3% per year,
and energy use among other types of office equipment is expected to grow 4.2%; this growth is in spite of
improvements in energy efficiency, which are expected to be offset by “continuing penetration of new
technologies and greater use of office equipment” (EIA 2003).
In 1992 the US Environmental Protection Agency (EPA) launched the voluntary ENERGY STAR program,
designed to curb the growth of CO
2
emissions by labeling the most energy-efficient electronic products for
the mutual benefit of manufacturers, consumers, and the environment.
1
The first products to be labeled
were computers and monitors; printers were added in 1993, fax machines in 1994, copiers in 1995, and
scanners and multi-function devices in 1997 (EPA/DOE 2003). Continued improvement in energy savings
among office equipment remains a focus of the ENERGY STAR program, which updates its product
specifications as necessary to respond to changes in technology, energy consumption, and usage patterns.
ENERGY STAR labeled office equipment reduces energy use primarily through power management (PM), in
which equipment is factory-enabled to automatically turn off or enter low power (any power level between
off and on) after some period of inactivity, usually 15 or 30 minutes. Most office equipment is idle more
often than it is active; among equipment that users tend to leave on when not in use, such as shared and
networked devices, PM can save significant energy. ENERGY STAR devices have a large market share, but
the percentage that actually power manage is lower for several reasons. Power management is sometimes
delayed or disabled by users, administrators, or even software updates that change the factory settings in
the interface; in addition, some network and computing environments (e.g., the Windows NT operating
system) effectively prevent PM from functioning.
To accurately estimate energy savings attributable to the ENERGY STAR program, and target future efforts,
current data are needed on the extent to which each type of office equipment is turned off or successfully
enters low power mode when idle. Combined with measurements of the energy used in each power state,
we can estimate typical unit energy consumption (UEC), which, combined with number of units currently
in use, provides an estimate of total energy use, and program savings (Webber, Brown et al. 2002).
In our ongoing technical support of the ENERGY STAR program, the Energy Analysis Department at
Lawrence Berkeley National Lab (LBNL) has conducted after-hours surveys (aka night-time audits) of
office equipment in commercial buildings. Our previous series of surveys was conducted during the
summer of 2000; it included nine buildings in the San Francisco Bay area and two in the Washington DC
area. We recruited and surveyed a diversity of office types and documented just over 100 computers per
site, on average. We collected data on the types, power states and PM delay settings of ENERGY STAR
labeled office equipment (computers, monitors, copiers, fax machines, printers, scanners and multi-function
devices). The methods and results of that study were reported previously (Webber, Roberson et al. 2001).
1
The ENERGY STAR® program has expanded to include residential appliances and heating and cooling equipment,
consumer electronics, building materials and components, refrigeration equipment, commercial buildings and new
homes. Since 1996 it has been jointly administered by the U.S. EPA and DOE ( />LBNL-53729
3
We also recorded (but did not report) the numbers of some types of “miscellaneous office equipment”, such
as computer speakers and external drives, portable fans and heaters, boomboxes and typewriters.
In this report, we present the results of our most recent (2003) after-hours survey of commercial buildings,
which was expanded to include:
• buildings in Pittsburgh, Pennsylvania and Atlanta, Georgia,
• education buildings, health care buildings, and small offices, and
• an inventory of miscellaneous plug-load equipment.
As part of our ongoing effort to improve the accuracy of data used to evaluate the ENERGY STAR program,
we wanted to capture data from a wider range of commercial building types and geographic regions. While
our sample is not large enough to distinguish regional differences in equipment night-time or after-hours
power status, we hope to improve the robustness of our data by increasing its geographic diversity. Also,
because office equipment is not confined to offices or office buildings, we wanted to capture data from
other types of commercial buildings that have significant amounts of office equipment, such as schools.
Collecting data on after-hours power status involves visiting buildings when most employees are gone.
Given the difficulty of arranging after-hours access to most commercial buildings, we used this opportunity
to simultaneously collect data for the ENERGY STAR Commercial Buildings program on the types and
numbers of miscellaneous plug-load equipment, and to develop a taxonomy by which to categorize them.
These data allow us to begin to better characterize the large “plug-load” building energy end use category.
Methodology
The protocol used in this series of surveys changed significantly from that of 2000 because of the need to
develop and integrate a data collection protocol for miscellaneous equipment with that of office equipment.
Building Sample
Table 1 below outlines the twelve buildings in our sample, which are identified by a letter. Appendix A
describes them in more detail, but in generic terms only, to preserve the anonymity of their occupants. As
in 2000, our initial target was to collect data on at least 1,000 computers. In selecting types and numbers of
commercial buildings to comprise that sample, we referred to data on computer densities provided by the
Commercial Building Energy Consumption Survey (CBECS) (EIA/CBECS 2002). According to CBECS,
in 1999, 74% of the U.S. population of computers were found among office, education, and health care
buildings; therefore, our building recruitment effort focused on these three types of buildings. CBECS
further characterizes offices by number of employees: 0-19 (small), 20-499 (medium), and 500+ (large).
To familiarize ourselves with what to expect (in recruitment effort and equipment found) in schools and
health care buildings, we began by surveying a high school and a medical clinic in the San Francisco area.
We then recruited and surveyed a variety of buildings in Pittsburgh in April, and Atlanta in June 2003.
Site recruitment is one of the most difficult and time consuming aspects of commercial building surveys.
Usually it involves cold-calling from a list of prospective business or building types (e.g., high schools),
briefly describing our research activity, and trying to connect with the person who is able and willing to
grant after-hours access, which involves providing a key and/or escort. Most facilities have real concerns
about safety, security, and privacy (e.g., of client or patient records), which of course must be addressed.
In each building, we surveyed as much area as possible in four hours or until we covered the area
accessible to us, whichever came first. At two sites we surveyed a single floor, at four sites we surveyed
LBNL-53729
4
the entire space available to us, and at the remaining six sites we surveyed portions of two or three floors.
In general, the greater the density and variety of equipment found, the less area we covered in four hours.
Floor areas are approximate gross square feet, based on floor plans or information from facility managers.
Table 1. Building Sample and Computer Density
in area surveyed (approximate no.)
computer density per
site
state
building type
occupancy
computers
ft
2
employees
1000 ft
2
employee
A
GA
education
university classroom bldg
171
28,000
n/a
6.1
n/a
B
PA
medium office
non-profit headquarters
182
55,000
128
3.3
1.42
C
GA
large office
corporate headquarters
262
28,000
120
9.4
2.18
D
CA
education
high school
112
40,000
n/a
2.8
n/a
E
GA
medium office
business consulting firm
37
22,000
70
1.7
0.53
F
PA
education
high school
248
100,000
n/a
2.5
n/a
G
CA
health care
outpatient clinic
177
45,000
n/a
3.9
n/a
H
GA
medium office
information services dept
153
24,000
76
6.4
2.01
J
PA
health care
private physicians’ offices
56
26,000
n/a
2.2
n/a
K
PA
small office
5 small businesses combined
117
20,000
77
5.9
1.52
M
PA
large office
corporate headquarters
73
40,000
125
1.8
0.58
N
GA
education
university classroom bldg
95
20,000
n/a
4.8
n/a
total
1,683
448,000
n/a = not available
Our characterization of offices differs slightly from that of CBECS. By our definition a small office has
<50 employees, a medium office has 50-500 employees, and a large office has >500 employees on site.
Also, CBECS appears to classify offices by the number of employees per building, while we classify them
by the number of employees per location. For example, our site E is a “medium office” (50-500
employees) that occupies one floor of a high-rise office tower; however, CBECS might consider the same
office to be part of a “large office” (over 500 employees) that includes all offices within the entire building.
Our “small office” is actually the aggregated results for five small businesses in three different buildings:
• a graphics and printing business,
• an environmental consulting firm,
• a commodity brokerage firm,
• a software development firm, and
• an engineering firm.
Their approximate number of employees ranged from 4 to 25, with a collective total of 77 employees.
For the six offices in our sample, Table 1 also shows the approximate density of computers by gross square
feet as well as per employee. We do not have number of employees (or computer density per employee)
for education and medical facilities. For high schools, where the number of students is known, equipment
density per student could be a useful metric if we had surveyed the entire building, which we did not. The
number of students regularly using a university classroom building, as well as the number of employees in
both education and medical buildings is much more variable and difficult to determine.
Although we used the CBECS data as a starting point in our building selection and recruitment efforts, our
resulting building sample does not necessarily correspond to the much larger CBECS building sample.
Figure 1 below compares our building sample to CBECS, based on the sum of floor area surveyed and
number of computers found among all office, education, and health care buildings in each sample.
Compared to CBECS, offices are somewhat under-represented in our current sample, while education and
health care buildings are somewhat over-represented. In addition, new buildings and high schools may be
over-represented in our building sample, though we don’t have corresponding CBECS data for comparison.
LBNL-53729
5
Figure 1. Comparison of LBNL and CBECS Commercial Building Samples
Survey Protocol
Each survey takes four people up to four hours to complete, and occurs on a weekday evening or weekend.
We usually work in two teams of two people, with one calling out information and the other recording it.
Using a floor plan, clipboard, flashlight and tape measure, we systematically record each plug-load device.
The flashlight helps in tracing cords to plugs, and the tape is used to measure TV and monitor screen sizes.
Our data collection is as unobtrusive as possible; we don’t turn computers on or off or access any programs,
settings, or files. If a workspace is occupied or obviously in use, we skip it and return later, if possible.
Office Equipment Data Collection
For our purposes in this study, office equipment includes the following equipment categories and types:
• computers: desktop, laptop (notebook or mobile), server, and integrated computer system (ICS);
• monitors: cathode ray tube (CRT), and liquid crystal display (LCD);
• printers: impact, inkjet, laser, thermal, solid ink, and wide format;
• fax machines: inkjet, laser, and thermal;
• copiers;
• scanners: document, flatbed, slide, and wide format; and
• multi-function devices (MFDs): inkjet and laser.
For each unit of office equipment, we recorded the make (brand) and model as it appears on the front or top
of the unit (we did not record information from the nameplate on the bottom or back of the unit). We
recorded the diagonal measurement, to the nearest inch, of monitor screens, except those of laptops (note:
for CRT monitors this measurement is smaller than the nominal screen (or tube) size). For laser printers
and MFDs we scrolled through the menu options available in the user interface to find the “power save
delay setting,” which usually ranges from 15 minutes to “never.”
We tried to record each unit of office equipment that had an external power supply (XPS). These devices
offer significant potential for energy efficiency improvement because they draw power even when the unit
of which they are part is turned off or disconnected (e.g., when a laptop computer or cell phone is removed
51%
12%
42%
30%
32%
37%
16%
42%
0%
10%
20%
30%
40%
50%
60%
70%
office education health
care
built
2000-03
high
schools
CBECS 1999 LBNL 2003
Percent of Floor Area Surveyed
in These Types of Buildings
64%
9%
14%
22%
21%
28%
49%
37%
0%
10%
20%
30%
40%
50%
60%
70%
office education health
care
built
2000-03
high
schools
CBECS 1999 LBNL 2003
Percent of Computers Found
in These Types of Buildings
LBNL-53729
6
from its charger, which remains plugged in). We distinguish two types of external power supply: a plug-in
power supply (PIPS), in which an AC/AC voltage transformer is incorporated into the plug, and an in-line
power supply (ILPS), which is incorporated into and appears as an enlarged part of the power cord. We
also tried to record whether or not each printer, copier, and MFD was connected to a network via cable (to
the extent that networks become wireless, network connection will become more difficult to determine).
The power state of each unit was recorded as on, low, off, or unplugged (exception: we did not record units
that were unplugged if it appeared they were never used). Although some office equipment, particularly
copiers, may have features that enable them to turn off automatically or enter low power manually (by user
action), we assume that the vast majority of units found off were turned off manually (i.e., by a user) and
that units found in low power entered that state automatically (i.e., without user action).
If a monitor/computer pair were both on, we recorded the screen content; the most common occurrences are
a screensaver, application, log-in or other dialog box (e.g., “It is now safe to turn off your computer”).
When a monitor is off and the computer to which it is connected is not, it can be difficult to tell whether the
computer is on or in low power. The method we used to determine a PC’s power state is outlined in
Appendix B; in short, a clampmeter is used to measure relative current in the computer power cord before
and after initiating a computer wake function, such as touching the mouse or keyboard (McCarthy, 2002).
The power state of a laptop computer is usually difficult to determine, unless it is in use and obviously on.
A closed laptop has few external indicators, and those that are present are often ambiguous and inconsistent
(e.g., between brands or models). In terms of improving our estimates of laptop unit energy consumption,
the most relevant data is the amount of time each laptop spends plugged in, and how often its battery is
(re)charged. Therefore, we recorded, at a minimum, whether or not each laptop was plugged in.
In this report the term “computer workstation” refers to any combination of computer(s) and monitor(s)
physically used by one person at a time; generally, there is a workstation associated with each office chair.
Workstation configurations vary widely; most common is one desktop computer connected to one monitor,
but we have noticed growing numbers of other configurations, including multiple computers with one
monitor, multiple (usually LCD) monitors with one computer, and laptops used with a docking station and
monitor. In this series of surveys, we identified each computer workstation by a unique number; i.e., all
components of each workstation were identified by the same number. We did this for two reasons: first, to
facilitate subsequent analysis of the relationship between computer and monitor power states; and second,
to be able to characterize the variety of workstations found. These analyses are discussed in the Results.
Miscellaneous Equipment Data Collection
Miscellaneous equipment (ME) refers to plug-load devices whose energy use is not usually accounted for
by building energy managers because they are portable, often occupant-provided units whose number,
power consumption and usage patterns are largely unknown. All ME in this report, including lighting, is
plug-load, as opposed to hard-wired, although for some equipment (e.g., commercial refrigerators) we did
assume a plug. The sheer variety of ME necessitates developing a taxonomy by which it can be
categorized and summarized. Appendix C presents our current miscellaneous equipment taxonomy.
For each unit of miscellaneous equipment we recorded any information (e.g., power state or rated power)
that could be used to estimate unit energy consumption (UEC). For lighting we recorded lamp type (e.g.,
halogen), wattage, and fixture type (desk, floor, track, etc.). For battery chargers, we noted the portable
component (drill, oto-opthalmoscope, walkie-talkie. etc.) and whether the charger was empty or full. For
vending machines, we recorded temperature and product (e.g., cold beverage) and any lighting. For
unknown equipment we noted make and model for later determination of identity and power specifications.
LBNL-53729
7
As with office equipment, we noted if there was a PIPS or ILPS. We also recorded PIPSs and ILPSs that
were plugged in but unattached to equipment (such as a PIPS used to charge an absent cell phone) and
those whose equipment could not be identified, such as among a maze of cords in a server room.
Nevertheless, we undoubtedly missed some, so our reported number of PIPSs and ILPSs is actually a
conservative estimate.
Limitations of This Methodology
One advantage of conducting after-hours building walk-throughs to collect data on office equipment power
status is that more buildings can be surveyed with a given amount of time and money. On the other hand,
the data collected represents a snapshot in time, and does not capture variations in user behavior over time,
which would require automated long-term time series metering of equipment power state and power levels.
This is our most robust sample of buildings to date for collecting data on the after hours power status of
office equipment. It includes data on 1,683 computers (including desktops, ICSs, laptops and servers) and
about 448,000 ft
2
in 12 commercial buildings, including schools and health care facilities in California,
Georgia, and Pennsylvania. (In comparison, our previous (2000) survey included 1,280 computers in 11
office buildings in California and Washington DC.) However, we do not suggest that this sample is
representative of commercial buildings as a whole or in part (e.g., by type, size, age, or location), or that the
results presented here are statistically significant. It is a record of what we found that we hope will be of
use to policy makers, researchers, and building managers.
Results and Discussion
Equipment Density
Table 2 shows the number and density, per 1000 approximate gross square feet, of office equipment (OE),
miscellaneous equipment (ME), and the sum of OE and ME in each building, and for all buildings. Our
survey captured data on over 10,000 units of equipment, including almost 4,000 units of office equipment.
Table 2. Office and Miscellaneous Equipment: Number of Units and Density
sorted by Density of Office Equipment (units/1000 ft
2
)
Number of Units
Density (units/1000 ft
2
)
Density (units/employee)
bldg type
site
OE
ME
OE+ME
OE
ME
OE+ME
OE
ME
OE+ME
medium office
E
98
441
539
4.5
20.0
24.5
1.4
6.3
7.7
education
F
574
596
1,170
5.7
6.0
11.7
large office
M
227
753
980
5.7
18.8
24.5
1.8
6.0
7.8
education
D
258
291
549
6.5
7.3
13.7
health care
J
171
458
629
6.6
17.6
24.2
medium office
B
410
422
832
7.5
7.7
15.1
3.2
3.3
6.5
education
N
204
234
438
10.2
11.7
21.9
health care
G
460
1,002
1,462
10.2
22.3
32.5
education
A
377
259
636
13.5
9.3
22.7
small office
K
275
528
803
13.8
26.4
40.2
3.6
6.9
10.4
medium office
H
340
630
970
14.2
26.3
40.4
4.5
8.3
12.8
large office
C
540
612
1,152
19.3
21.9
41.1
4.5
5.1
9.6
all buildings
3,934
6,226
10,160
8.8
13.9
22.7
3.2
5.7
8.9
LBNL-53729
8
Note that the numbers of miscellaneous equipment units in Table 2 are lower than those in Appendix D
because Table 2 does not include plug-in and in-line power supplies, while Appendix D does.
Figure 2 illustrates office and miscellaneous equipment density (per 1000 square feet), by building type.
Figure 2. Office and Miscellaneous Equipment Density, by Building Type (and number)
From Table 2 we see that the two buildings with the lowest combined equipment density are high schools,
and Figure 2 shows that education buildings in our sample had the lowest equipment densities overall.
Among our sample of 12 buildings, building types with the highest densities are small and large offices.
We suggest that small offices may have high equipment density because every office needs certain devices
(e.g., copier, fax machine, microwave oven, refrigerator), regardless of how many (or few) people share it.
Medium offices exhibited a range of density (see Table 2, sites B, H), but on average their office equipment
density is similar to and their miscellaneous equipment density is lower than that of health care facilities.
Closer examination of the results for each building reveals some underlying trends. For example, the only
two buildings with a computer density less than 2 per 1000 ft
2
(from Table 1) were offices (one medium,
one large) whose employees tend to rely on laptop computers, most of which were absent during our visit;
one of these companies requires employees to take their laptops home or lock them up when not at work.
Office Equipment
Our sample includes data on the power state of 1,453 desktop computers (well above our target of 1,000),
1,598 monitors, 353 printers, 89 servers, 79 MFDs, 47 fax machines, 45 ICSs, 34 scanners, and 33 copiers.
Among printers, our discussion of results will focus on the 158 laser and 123 inkjet printers found.
13.8
11.3
8.9
8.4
7.5
8.8
26.4
20.1
20.6
14.8
7.3
13.9
0
5
10
15
20
25
30
35
40
45
small office (1) large office (2) health care (2) medium office (3) educational (4) all buildings (12)
Equipment Density (units per 1000 sq. ft.)
Miscellaneous Equipment
Office Equipment
LBNL-53729
9
Among all buildings, computer density ranges from 1.7 to 9.4 per 1000 ft
2
gross floor area, (see Table 1).
Among office buildings only, computer density ranges from 0.53 to 2.18 per employee. Office equipment
density ranges from 4.5 to 19.3 units per 1000 ft
2
gross floor area, with an average of 8.8 (see Table 2).
Among offices, office equipment density ranges from 1.4 to 4.5 units per employee, with an average of 3.2.
When analyzing the numbers of equipment in each power state, we are primarily interested in two values:
turn-off rates and power management (PM) rates. ‘Turn-off rate’ is the percent of each equipment type that
is turned off, while “PM” rate is the percent of those not off that are in low power.
Table 3 shows the numbers of each type of office equipment, and their after-hours power state. Table 3
does not include laptop computers, units that were unplugged, or units whose power state was unknown.
Table 3. Office Equipment: After-hours Power States
Equipment
Number
Percent
Category
Type
on
low
off
sum
on
low
off
PM rate
computers
desktop
869
60
524
1453
60%
4%
36%
6%
server
87
2
89
98%
0%
2%
n/a
ICS
7
11
27
45
16%
24%
60%
61%
monitors
CRT
259
648
422
1329
19%
49%
32%
71%
LCD
56
164
49
269
21%
61%
18%
75%
printers
laser
53
81
24
158
34%
51%
15%
60%
inkjet
86
37
123
70%
n/a
30%
n/a
impact
16
6
22
73%
n/a
27%
n/a
thermal
31
7
38
82%
n/a
18%
n/a
wide format
2
6
8
25%
0%
75%
0%
solid ink
1
3
4
25%
75%
0%
75%
MFDs
inkjet
9
4
3
16
56%
25%
19%
31%
laser
36
14
13
63
57%
22%
21%
28%
copiers
all
12
5
16
33
36%
15%
48%
29%
fax machines
all
44
3
47
94%
6%
0%
6%
scanners
all
8
12
14
34
24%
35%
41%
60%
Note: “PM rate” is the percent of units not off that were in low power.
Not surprisingly, turn-off rates were lowest among fax machines and server computers. Turn-off rates were
highest for integrated computer systems (60%), copiers (48%), and scanners (41%). PM rates were highest
among LCD monitors (75%), CRT monitors (71%), ICSs (61%), scanners (60%), and laser printers (60%).
The lowest power management rates were among desktop computers and fax machines (6% of each).
Because copiers and MFDs often have long (2-4 hour) PM delay settings that may not have elapsed at the
time of our visit, PM rates in Table 3 for this equipment should be considered a minimum or lower bound.
Figure 3 (below) graphically shows the breakdown by power state of each major type of office equipment.
Computers
We categorized computers as either desktop, integrated computer systems (ICSs), servers, or laptops.
Among 1,453 desktop computers the turn-off rate was 36%; it ranged from 5% (at Site E, medium office)
to 67% (at Site B, medium office). Only 6% of all desktop computers that were not off were in low power.
This PM rate is similar to the 5% rate found in a previous study (Webber, Roberson et al. 2001). Among
the 45 ICSs in Table 3 the turn-off rate was 60%, and the PM rate was 61%. However, it is possible that of
the 11 ICSs found in low power, only the display (but not the CPU) was in low power.
LBNL-53729
10
Figure 3. Office Equipment Power States
Among education buildings in our sample, the majority of the desktop computers, monitors and ICSs were
found in classrooms clearly dedicated to computer-based learning. These “computer labs” typically have a
1:1 ratio between computers and chairs. Among the two high schools, 65% of desktop computers and ICSs
were found in computer labs with at least 15 (and up to 77) computers each; among the two university
classroom buildings, 68% of desktop computers and ICSs were found in computer labs with at least 15 (and
up to 57) computers each. Because a single instructor likely controls the after-hours power status of all
equipment in these rooms, and also because school buildings in general experience more ‘after-hours’ per
year than other buildings, computer labs present a target for energy-efficiency efforts in schools.
Laptop Computers
There are 50 laptop computers in our sample, and we recorded information on the power state of 37. Of
those 37, all but two (or 95%) were plugged in, either through their power cord or a docking station. Nine
(or 24%) of the 37 laptops were clearly on; i.e., their display showed a desktop, application, or login screen.
Sixty percent (60%, or 21) of the 35 laptops that were plugged in were plugged into docking stations.
2
Of
the 107 docking stations found, 20% (21) were “full”, i.e., contained laptop computers, while 80% (86)
were “empty,” or without laptops. Those empty docking stations are evidence of at least 86 more laptop
computers that were absent at the time of our visit. In addition, we found 35 power cords with ILPSs that
we identified as “laptop charger, empty” (and which we consider in the “power” category of miscellaneous
equipment). Combined with the 50 laptop computers and 86 empty docking stations found, we conclude
2
We consider docking stations to be in the “computer peripheral” category of miscellaneous equipment, whereas
laptop computers are office equipment.
0% 20% 40% 60% 80% 100%
scanners
fax machines
copiers
MFDs
inkjet printers
laser printers
LCD monitors
CRT monitors
ICS
desktop computers
on
low
off
LBNL-53729
11
that at least 171 laptop computers are in use among our sample of buildings. Of course, this number does
not include – and we did not attempt to estimate – the number of people who take both their laptop
computer and its power cord/battery charger home or lock them in a drawer at night.
If we compare this minimum number of laptop computers to the total number of non-server computers in
our sample, from Table 3 (1,453 desktops + 45 ICSs, + 171 laptops = 1669 total), laptops comprise
approximately 10% of non-server computers found in our survey; again, this is a conservative estimate.
Some offices appear to have largely switched from desktop to laptop computers. Table 4 shows that in two
(of six) offices in our sample – one large and one medium office – the sum of laptop computers, empty
docking stations and empty laptop battery chargers (ILPSs) outnumbered the desktop computers found.
Table 4. Ratio of Laptop to Desktop Computers at Two Sites
number of laptop computers
Site
no. of desktop
computers
laptops found
empty docking stations
empty laptop chargers
estimated total
E
20
4
11
9
24
M
41
26
40
9
75
Monitors
The average turn-off rate among 1,329 CRT monitors was 32%; it ranged from 17% at Site E (medium
office) and N (university) to 62% at Site D (high school). 71% of CRT monitors that were not off were in
low power. Among the 269 LCD monitors in Table 3 the turn-off rate was 18% and the PM rate was 75%.
Assigning a unique number to each computer/monitor workstation enabled us to analyze the relationship
between computer power state and monitor power state. Table 5 shows the results of that analysis. (Note:
Table 5 does not include monitors connected to more than one computer.)
Table 5. Analysis of Monitor Power Management by Computer Power State
Monitor Power Management *
Monitor Power State
Computer
Computer Power state
No.
Off
Low
On
Monitor PM Rate
(computer is off
or in low power)
PC-initiated
Monitor PM Rate
(computer is on )
Desktop
Off/no signal
433
184
244
5
98%
Low
59
4
53
2
96%
On
689
154
286
249
53%
Laptop **
Absent or empty docking station
55
13
42
0
100%
Plugged-in or in docking station
23
4
15
4
79%
Server
On
32
14
10
8
56%
*
*Monitor Power Management is the percent of monitors not off that are in low power
* These data refer to external monitors connected to laptop computers, not to the laptop display.
Computers can initiate low power modes in ENERGY STAR monitors. Power management settings in the
computer operating system (OS) control panels determine if and when the computer sends a signal to the
monitor that causes the monitor to enter low power. If an ENERGY STAR monitor is attached to a computer
that is on, it will enter low power only if it receives this signal. “PC-initiated monitor PM rate” refers to the
share of systems in which the computer signals the monitor to initiate PM, and the monitor responds. We
can infer this rate only among systems in which the computer is on and the monitor is not turned off.
LBNL-53729
12
An ENERGY STAR monitor can also enter low power if there is no video signal from the computer, either
because the computer is off, it is in low power, or the monitor is disconnected from the computer. “Monitor
PM rate” refers to the share of monitors that power manage in the absence of a signal from the computer.
Among monitors that were not turned off, those connected to computers that were off or absent had
monitor power management rates of 98% (with desktop computers) and 100% (with laptops); monitors not
off and connected to desktop computers that were in low power had a 96% monitor PM rate. In the
remaining cases, the monitor may have been incapable of power managing (i.e., it was non-ENERGY STAR).
Monitors not off and connected to desktop or server computers that were on had PC-initiated monitor PM
rates that were much lower: 53% (for desktop computers) and 56% (for servers). Clearly, monitors that
depended on a computer signal to initiate power management were much less likely to enter low power.
In our 2000 study we did not uniquely identify each workstation and so could not conduct this analysis.
However, our 2003 monitor ”PC-initiated PM rate” differs from the monitor “PM enabling rate” of another
recent but unpublished study. In 2001, researchers at Energy Solutions in Oakland CA (O'Sullivan 2003)
used EZ Save software
3
to remotely obtain (via local area networks) the PM settings of over 7,000
computer monitors at 17 commercial and institutional sites in the San Francisco Bay area. They found that
monitor PM settings in the computer OS control panel were enabled for 44% of monitors. We would
expect the share of monitors that actually power manage when the computer is on to be lower than the
share of computers enabled to power manage their monitors (because some monitors may not be ENERGY
STAR, there may be network interferences with PM, etc). However, our “PC-initiated PM rate” of 53% for
desktop computers is higher than the 44% “PM enabling rate” found by Energy Solutions. There are
several possible explanations for this:
1) Energy Solutions’ 2001 sample contained significantly more computers using the Windows NT OS
(which does not support PM and is no longer supported by Microsoft) than LBNL’s 2003 sample,
2) Newer computers may be more successful at initiating monitor power management, and newer
computer equipment (like newer buildings) may be over-represented in our 2003 sample,
3) Our PC-initiated PM rate is calculated from a subset of monitors (those left on and attached to a PC
left on), while Energy Solutions’ enabling rate represents all monitors. If turn-off and enabling
rates are not independent (i.e., if people who leave their devices on at night are more likely to
enable than those who turn their devices off), that could explain part or all of the discrepancy.
4) PC-initiated monitor PM rates actually have risen, as individuals and organizations respond to
ENERGY STAR or other educational programs about the energy savings potential of monitor PM, or
5) Our 2003 sample includes a wider variety of commercial building types and locations, and so is
more representative than data collected only from office buildings in California,.
In any case, the ability of computers to power manage monitors deserves further scrutiny and improvement.
In the report on our 2000 office equipment field surveys (Webber, Roberson et al. 2001) we speculated that
monitors in low power might be thought by users to be off. Among buildings in this report, Site M, a large
office, offers anecdotal evidence regarding user (mis)interpretation of monitor power state. According to
the facility manager, this company’s strict policy is that employees turn their monitors off before leaving,
and security personnel turn off any monitors found left on. Our data show that only 4% of monitors were
on, but only 29% were actually off; the remaining 65% were in low power mode. This confirms our field
observations that if a display is black or blank, users often assume the monitor is off, even though the front
panel power indicator (which is amber and/or blinking when the unit is in low power) indicates otherwise.
3
EZ Save software was developed by the Department of Energy and adapted by the EPA ENERGY STAR program.
LBNL-53729
13
LCD monitors were not even mentioned in the report on our 2000 field surveys of office equipment, but in
2003, LCDs were 17% of all monitors. As shown in Table 6, at three sites (including two high schools, D
and F) we found no LCD monitors, but at two sites (E, medium office; A, university building), LCD
monitors outnumbered CRT monitors, and at three others (B and H, both medium offices; and J, health
care) LCDs were over 25% of all monitors found.
Table 6. Number and Percent of LCD Monitors, by Site
sorted by percent of LCD monitors
site
D
F
C
M
G
K
N
J
H
B
A
E
all
LCDs
0
0
2
4
12
14
13
18
40
66
96
21
286
CRTs
89
248
254
97
162
88
76
46
104
111
79
12
1366
total
89
248
256
101
174
102
89
64
144
177
175
33
1652
% LCDs
0%
0%
0%
4%
7%
14%
15%
28%
28%
37%
55%
64%
17%
While our building sample is not large enough to draw reliable conclusions about office equipment power
management based on building type, we did some analysis within our sample. Figure 4 shows the after-
hours power status of monitors (both CRT and LCD) based on building type. (A similar analysis for
desktop computers and ICSs is not shown here because almost all the computers found in low power were
in a single (health care) building, which may be anomalous.)
Figure 4. Monitor After-hours Power Status, by Building Type
In our sample, monitor PM rates were by far the lowest in high schools (44%) and highest in university
buildings (85%) and large offices (87%). Monitor turn-off rates were lowest in university buildings (13%)
and highest in small offices (50%). In addition to the low monitor PM rate, a relatively high number (35%)
of monitors were on in high schools, where all monitors found were CRTs, which use significantly more
power when on than LCDs (Roberson, 2002). This strengthens the evidence that there is significant energy
savings potential among office equipment in computer classrooms, and particularly those in high schools.
18%
24%
10%
17%
35%
13%
13%
32%
41%
65%
51%
27%
74%
59%
50%
35%
24%
32%
37%
13%
28%
0%
20%
40%
60%
80%
100%
S office
(n=101)
PM=64%
M office
(n=338)
PM=63%
L office
(n=357)
PM=87%
all office
(n=796)
PM=75%
high school
(n=330)
PM=44%
university
(n=260)
PM=85%
health care
(n=212)
PM=82%
% off
% low
% on
LBNL-53729
14
Printers
We categorize printers based on imaging technology: laser, inkjet, impact, thermal, wide format, solid ink.
4
Figure 5 shows the composition of our sample. Of 385 printers, 45% (174) were laser, 34% (132) were
inkjet, 11% (41) were thermal, 6% (25) were impact, 2% (8) were wide format, and 1% (4) were solid ink.
Figure 5. Printer Sample, by Technology
impact
6%
inkjet
34%
thermal
11%
wide
format
2%
laser
46%
solid ink
1%
Of 158 laser printers in our sample, 15% were off, and 60% of those not off were in low power mode.
Among the 123 inkjet printers the turn-off rate was 30%; we found no inkjet printers in low power. Of 38
thermal printers, which do not power manage, the turn-off rate was 18%. Of four solid ink printers none
were off, but three (75%) were in low power.
For laser printers we tried to record “powersave” (i.e., low power) delay settings and whether or not they
were networked. We did not record delay settings for laser printers that were off, or for those that did not
have user interactive menus. Of 78 laser printers for which we actually recorded delay settings, 18% (14)
were set to 15 minutes, 59% (46) were 30 minutes, 12% (9) were 60 minutes, 6% (5) were 180-240
minutes, and 5% (4) were set to “never” or off. Figure 6 displays this graphically.
Figure 6. Laser Printers: Powersave Delay Settings
18%
59%
12%
6%
5%
15 min
30 min
60 min
180-240 min
never
4
Wide-format is not an imaging technology, but rather an ENERGY STAR category for printers that accommodate 17”x
22” or larger paper. Of 8 wide format printers in our sample, 7 used inkjet, and one used impact technology.
LBNL-53729
15
Among printers for which we recorded the presence or absence of a network connection, 63% of laser
printers but only 7% of inkjet printers were networked.
Only 60% of laser printers not off were actually found in low power (see Table 3). Not all laser printers
can power manage (i.e., they are not ENERGY STAR), and so do not have powersave delay settings. Among
laser printers that can power manage, there are several reasons they might be found on during our survey:
(1) the printer has a long (3-4 hour) powersave delay setting, which had not elapsed, (2) the printer was
recently used, and (3) the printer is in error mode, which effectively prevents it from entering low power.
Multi-Function Devices
The ENERGY STAR Office Equipment program distinguishes “digital copier-based MFDs,” which are
covered by their MFD program, from printer- and fax-based MFDs, which are covered by their printer
program. In this study, we identify any multi-function device as an MFD, and distinguish between them on
the basis of imaging technology (inkjet or laser), which we think is most relevant to power consumption.
Many units of office equipment that we identified in the field as copiers, fax machines, or printers turned
out, on later examination of their specifications, to actually be multi-function devices (MFDs). Among the
80 MFDs eventually identified, 80% (64) used laser technology, and the remaining 20% (16) were inkjets.
Turn-off and PM rates were similar for laser and inkjet MFDs. Of 63 laser MFDs in Table 3 the turn-off
rate was 21%, and 28% of those that were not off were in low power. Of 16 inkjet MFDs (at least some of
which can power manage) the turn-off rate was 19%, and 31% of those not off were in low power.
Copiers
Of the 33 copy machines in Table 3, 48% were off and 29% of those that were not off were in low power.
This low PM rate may be due in part to the fact that copiers often have powersave delay settings of two
hours or more, and some of the copiers that we found on would eventually have entered low power.
Our 2000 field surveys of office equipment included 34 copiers and 11 ‘digital copier-based MFDs,’ which
yields a copier to ‘digital copier-based MFD’ ratio of 3:1. Our current sample includes 33 copiers and 64
laser or ‘digital copier-based MFDs,’ which yields a 2003 copier to ‘digital copier-based MFD’ ratio of
0.5:1. These numbers confirm our field observations that MFDs are replacing copiers in the marketplace.
Fax Machines
It can be difficult to tell whether a fax machine
is on or in low power. Also, many units meet
ENERGY STAR’s low power requirement when
on but idle or ‘ready’, and so do not need a
separate low power mode. In this study, unless a
fax machine gave a visual indication that it was
in low power, we recorded it as being on. Of the
47 units in our sample and in Table 3, none were
off and 6% (3) were in low power. Of the 44 fax
machines whose technology we were able to
determine, 69% (30) were laser, 20% (9) were
thermal, and 11% (5) were inkjet. Figure 7
displays this graphically.
Figure 7. Fax Machine Technology
laser
69%
inkjet
11%
thermal
20%
LBNL-53729
16
Scanners
Of the 34 scanners in Table 3, 41% were off and 60% of those that were not off were in low power. Of the
total 37 scanners in our sample, 76% (28) were flatbed scanners, 14% (5) were specialized document
scanners, 5% (2) were wide format, and 5% (2) were slide scanners. Among flatbed scanners only, 18%
(5) were on, 43% (18) were in low power, 29% (8) were off, and 11% (3) were unplugged. All five
document scanners were off; both wide format scanners were found in the same room, and were on.
Office Equipment: Comparison of 2000 and 2003 Turn-off and PM Rates
A primary goal of this study is to update information on office equipment turn-off and power management
rates from previous studies, and to broaden the range of buildings in which this data is collected. Table 7
compares the office equipment turn-off and PM rates from this series of surveys to those from our 2000
field surveys of office buildings in California (Webber, Roberson et al. 2001).
In most cases, our 2003 field data yield turn off and PM rates that are virtually the same as those found in
2000. Notable exceptions are that monitor PM rates were higher (72% in 2003 c.f. 56% in 2000) and MFD
PM rates were much lower in 2003 than in 2000 (29% in 2003 c.f. 56% in 2000). Also, copier and scanner
turn-off rates were higher in 2003 than in 2000.
Table 7. Office Equipment Turn-off and Power Management Rates
Turn-off Rate
PM Rate
Category
Type
no. in 2003
2000
2003
2000
2003
computers
desktop + ICS
1,498
44%
37%
5%
7%
desktop
1,453
36%
6%
ICS
45
60%
61%
monitors
all
1,598
32%
29%
56%
72%
CRT
1,329
32%
71%
LCD
269
18%
75%
printers
all
353
25%
23%
44%
31%
monochrome laser
24%
53%
high-end color
15%
61%
laser
158
15%
60%
inkjet
123
31%
30%
3%
0%
impact
22
31%
27%
0%
0%
thermal
38
18%
0%
wide format
8
57%
75%
32%
0%
solid ink
4
0%
75%
MFDs
all
79
18%
20%
56%
29%
inkjet
16
19%
31%
laser
63
21%
28%
copiers
all
33
18%
49%
32%
28%
fax machines
all
47
2%
0%
6%
scanners
all
34
29%
41%
60%
For computers, the 2003 PM rate of 6% is similar to the estimated 2000 rate of 5%, but the 2003 turn-off
rate of 36% for desktop computers is lower than the 2000 turn-off rate of 44% for all computers.
LBNL-53729
17
The 2003 turn-off rate of 32% for CRTs matches the 2000 turn-off rate for all monitors, but the 2003 turn-
off rate of 18% for LCD monitors is much lower. In 2003 we found a much higher PM rate for both CRT
and LCD monitors (71% and 75%, respectively) than the 56% PM rate reported for all monitors in 2000.
For all laser printers (of which <2% are color) our 2003 turn-off rate of 15% is lower than the 2000 rate of
24% for monochrome laser printers. The 2003 turn-off rates for inkjet (30%) and impact (27%) printers are
similar to the 2000 rates for both (31%). Among our small sample of 8 wide format printers in 2003, the
75% turn-off rate is significantly higher than the 57% reported in 2000. The 2003 turn-off rate of 0% for (a
sample of four) solid ink printers is lower than the 2000 turn-off rate of 15% for high-end color printers.
The 2003 PM rate of 60% for laser printers is similar to the 2000 rate of 61% for “high end color” printers.
In 2000 some inkjet and wide-format printers were in low power, but in 2003 we found none.
The 2000 study did not report on thermal or solid ink printers, probably because few or none were found.
Solid ink is not a widespread printer technology; in 2003 we found four, all in the same building. Of 41
thermal printers in our 2003 sample, only 15% were found in offices; another 15% were in education
buildings, but 70% were found in health care buildings. For thermal printers the 2003 turn-off rate is 18%;
for solid ink printers it is 0%. The 2003 PM rate for thermal printers is 0%; for solid ink it’s 75%.
In 2003 we distinguish between laser and inkjet MFDs, but their turn-off rates (19 and 21%, respectively)
are similar to the 2000 rate of 18% for all MFDs. However, in 2003 the PM rate for both inkjet and laser
MFDs (31 and 28%, respectively) are significantly lower than the 2000 rate of 56% for all MFDs.
Copiers had a much higher turn-off rate in 2003 (49%) than in 2000 (18%), but their PM rate in 2003
(28%) is slightly lower than in 2000 (32%). Because of confusion about fax machine power state, no PM
rate was reported in 2000; however, in 2003, at least 6% of fax machines were in low power. For scanners,
the turn-off rate rose from 29% in 2000 to 41% in 2003; the 2003 PM rate was 60%.
Miscellaneous Equipment
Miscellaneous equipment outnumbered office equipment in every building except one, at a university (site
A); at one medium office (site E), the ratio of miscellaneous equipment to office equipment exceeded 4:1.
For all buildings combined, if external power supplies are included as miscellaneous equipment, the ratio of
miscellaneous equipment (7,66 units, Appendix D) to office equipment (3,934 units, Table 2) is almost 2:1.
For all buildings combined, the most numerous equipment types in each ME category are as follows:
• audio/visual: television (27% of audio/visual category), VCR (23%), overhead projector (14%)
• food/beverage: microwave oven (16%), undercabinet refrigerator (15%), coffee maker (12%)
• portable hvac: 8-16” diameter fan (35%), heater (21%), < 8” diameter fan (20%)
• laboratory: scale (24%), spectrophotometer (18%), tabletop centrifuge (13%)
• lighting: fluorescent undercabinet lamp (60%), 13W compact fluorescent lamp (15%)
• medical: oto-opthalmoscope charger (25%), exam light (18%), x-ray light box (12%)
• networking: switch (30%), hub (22%), modem (14%)
• office misc.: clock and/or radio (22%), compact audio system (18%), pencil sharpener (17%)
• peripheral: computer speaker pair (52%), laptop docking station (12%), PDA dock (11%)
• power: lighted power strip (36%), plug-in power supply (35%), in-line power supply (8%)
• telephony: powered phone (42%), headset with network box (13%), conference phone (11%)
• maintenance: vacuum cleaner (21%), floor polisher (14%), clothes washer or dryer (12%).
Appendix D lists the number of miscellaneous equipment (ME) units, by category, found in each building.
For all sites combined, the most numerous miscellaneous equipment categories are power (including
LBNL-53729
18
external power supplies, which are discussed in the following section), lighting, and computer peripherals.
The least numerous categories of plug-load miscellaneous equipment are money exchange and security.
Figure 8 shows the relative amounts of each category of miscellaneous equipment, by type of building.
Figure 8. Miscellaneous Equipment Numbers, by Category and Building Type
Not surprisingly, laboratory and medical equipment is the largest miscellaneous equipment category in
health care buildings and audio/visual equipment is a significant category in education buildings.
Networking equipment appears to be a smaller category in large offices, but this result may be because we
did not have access to network closets in the two large offices in our sample.
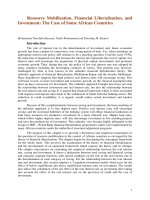
External Power Supplies
Figure 9 shows the types of equipment we found with external power supplies, the number of units of each
equipment type that had an external power supply (XPS), the type of power supply (ILPS or PIPS), and the
minimum percent of each equipment category that had an external power supply. It is a minimum value
because although we tried to record every occurrence of an XPS, we did not capture all of them.
The most numerous external power supplies were among computer speakers, LCD monitors, fluorescent
desk lamps (whose PIPS included a magnetic ballast), powered phones (including conference and speaker
phones), laptop and PDA docking stations. The highest percentage of units with external power supplies
were among powered phones, fluorescent desk lamps, laptop and PDA docking stations. ILPSs were
prevalent among LCD monitors and laptop docking stations, while PIPSs prevailed among computer
speakers, fluorescent desk lamps, powered phones and PDA docks. Equipment among which we found
both ILPSs and PIPSs (though not on the same unit) were computer speakers, powered phones, PDA docks,
inkjet printers, thermal printers, and scanners.
0 400 800 1200 1600 2000
Small office (1)
Health Care (2)
Education (4)
Large office (2)
Medium office (3)
Number of units
PIPSs/ILPSs
power
lighting, portable
peripheral
laboratory/medical
audio/visual
office miscellany
food/beverage
networking
telephony
hvac, portable
other
LBNL-53729
19
Figure 9. External Power Supplies: Number, Type and Frequency
Conclusions
For all buildings combined, the average plug-load equipment density in units per 1000 gross ft
2
, was about
9 for office equipment and 14 for miscellaneous equipment, for a sum of about 23 units per 1000 gross ft
2
.
Educational buildings, where large floor areas are devoted to classrooms, had the lowest density of both
office and miscellaneous equipment. However, two-thirds of computers and monitors found in educational
buildings (and thus most of the energy savings potential) were concentrated in computer-based classrooms.
Among offices only (for which we were able to estimate number of employees, or occupants), the average
equipment density, in units per employee, was approximately 3 units of office equipment and 6 units of
miscellaneous equipment per employee, for a sum of about 9 electrical plug-load devices per employee;
note that this includes equipment found in common areas such as kitchens, print centers, and utility closets.
Because we have not attempted to estimate equipment density before, these data represent a baseline for
reference and comparison with future data.
Office Equipment
A good overview of our results regarding office equipment power states is provided by Figure 3 (page 10),
which allows a visual comparison of the percent of units found on, in low power, or off, by equipment type.
Power management, indicated by the middle segment of each bar, is most successful among monitors and
laser printers; and least successful among desktop computers, inkjet printers, copiers, and fax machines.
Turn-off rates, indicated by the right segment of each bar, are highest (≥ 40%) among integrated computer
systems (ICS), copiers, and scanners; and lowest (≤ 20%) among laser printers, LCD monitors, and MFDs.
59%
93%
96%
90%
86%
31%
49%
18%
8%
54%
0
50
100
150
200
250
300
Computer
speakers
LCD
Monitor
Fluor desk
lamp
Powered
phone
Laptop dock PDA dock Inkjet
Printers
Thermal
Printers
Scanners Inkjet MFD
Number
of Units
0%
10%
20%
30%
40%
50%
60%
70%
80%
90%
100%
in-line power supply
plug-in power supply
Min. % of units with
external power supply