MEASUREMENT OF ATMOSPHERIC DEPOSITION UNDER FOREST CANOPIES: SOME RECOMMENDATIONS FOR EQUIPMENT AND SAMPLING DESIGN docx
Bạn đang xem bản rút gọn của tài liệu. Xem và tải ngay bản đầy đủ của tài liệu tại đây (279.79 KB, 35 trang )
MEASUREMENT OF ATMOSPHERIC DEPOSITION UNDER FOREST
CANOPIES: SOME RECOMMENDATIONS FOR EQUIPMENT AND
SAMPLING DESIGN
ANNE THIMONIER
Swiss Federal Institute for Forest, Snow and Landscape Research, CH-8903 Birmensdorf,
Switzerland
(Received 18 March, 1996; accepted 25 February, 1997)
Abstract. Quantification of the forest water flux provides valuable information for the understanding
of forest ecosystem functioning. As such, throughfall (and stemflow to a lesser extent) has been
frequently measured. Although throughfall collection may seem relatively simple, the requirements
to obtain reliable estimates are often underestimated. This review addresses the criteria to take into
account whenworkingout thesamplingprocedure, from theselection ofequipment to implementation
in the field. Sound sampling of the forest water flux is difficult due to its high spatial and temporal
variation. The high costs entailed by the ideal sampling design often prohibit its implementation.
Different procedures are available, some of which are compromises between the aim of the study
(monitoring orexperimental study,short or long termobjectives, absolute or relativeestimates, quality
of the assessment to be achieved) and the available means.
Key words: atmospheric deposition, methodology, sampling, spatial variation, temporal variation,
throughfall, stemflow, water chemistry
1. Introduction
Precipitation under forest canopies is frequently measured in forest ecosystem
studies. Terms and definitions used to describe it differ, but Parker’s (1983) desig-
nations have been most commonly used. Two components of the forest water flux
are distinguished. Throughfall consists of the water dripping from the canopy as
well as the portion of precipitation reaching the forest floor without having being
intercepted by the crowns. Stemflow is the water running down the branches and
the trunk and depositing at the base of the tree (Parker, 1983). Throughfall usual-
ly makes up the major portion of precipitation under the canopy and, as such, is
the most commonly measured component of the forest water flux. Stemflow can
represent a substantial fraction of the total water input in stands of smooth-barked
species with upright branches, but it makes a negligible contribution to the water
flux in forests of rough-barked species (Parker, 1983; Brechtel, 1989).
Throughfall and stemflow are two major pathways in forest nutrient cycling,
and their quantification is necessary to establish both water and nutrient budgets.
Although they may supply less material than litterfall, they constitute a source
of dissolved minerals readily available for plant uptake (Parker, 1983). Water
and nutrient inputs via throughfall and stemflow influence all soil chemical and
biological processes, including pedogenic transformations, turnover of nutrient
Environmental Monitoring and Assessment 52: 353–387, 1998.
c
1998 Kluwer Academic Publishers. Printed in the Netherlands.
354 A. THIMONIER
pools, accumulation and mobilisation of possibly toxic substances, and buffering
reactions (Mayer, 1987).
Throughfall and stemflow sampling is also useful in assessing and monitoring
the pollution climate to which forest ecosystems are exposed (e.g. Johnson and
Lindberg, 1992; Matzner and Meiwes, 1994; Meesenburg et al., 1995). Through-
fall and stemflow composition does not readily differentiate between the origin of
the elements reaching the forest floor, but parallel sampling of the incident precip-
itation in the open field or above the forest canopy helps discriminate the influence
of vegetation (filtering effect of dry and occult deposition and exchange processes)
from wet deposition. Derivation of dry deposition from throughfall measurements
has been attempted, although not always successfully (Ulrich, 1983; Lovett and
Lindberg, 1984; Bredemeier, 1988; Puckett, 1990; Potter et al., 1991; Beier et al.,
1992; Joslin and Wolfe, 1992; Draaijers and Erisman, 1993; Brown and Lund,
1994; Neary and Gizyn, 1994; Rustad et al., 1994; Cappellato and Peters, 1995;
Reynolds, 1996). However, as the throughfall method has the advantage of being
relatively inexpensive and simple compared to other methods directed towards the
measurement of more specific pathways of atmospheric deposition (Erisman et
al., 1994), it has been used extensively in studies dealing with deposition mea-
surements. Throughfall can provide a valuable quantification of the total inputs
to the forest floor of critical chemicals involved in acidification or eutrophication
processes, such as nitrogen and sulphur compounds.
It is thus crucial to obtain a representative measurement of throughfall and
stemflow, or at least to be aware of the limitations of the estimates. This review
focusesonthe criteriathatshouldbeconsidered whenselectingthe typeofcollector,
its design, and the siting in the field. It is more specifically directed towards the
requirements in monitoring studies and reviews some of the manuals which have
been written to harmonise the sampling procedures at national and international
levels. This contribution concentrates on the sampling of precipitation in the wet
form; problems related to snow collection are not addressed.
2. Sampling Equipment
2.1. T
YPE OF COLLECTOR
2.1.1. Incident Precipitation and Throughfall
Wet-only collectorsagainstcontinuouslyopencollectors.Deposition of atmospher-
ic compoundsbyrain (wet deposition)is theoreticallybestmeasured with specially
designed collectors, which are closed by a lid during dry periods and open when-
ever raindrops (or snowflakes) are detected by a sensor. Such a system prevents
the deposition of particles and gases on the walls of the collector during dry peri-
ods, as occurs in continuously open collectors. Downwash of the dry-deposited
compounds can significantly affect the composition of the sample collected in con-
tinuously exposed collector (bulk precipitation) (Erisman et al., 1994; Draaijers et
MEASUREMENT OF ATMOSPHERIC DEPOSITION UNDER FOREST CANOPIES 355
Table I
Examples of bulk/wet concentration ratios taken from the literature (only case studies where the collection interval was the same for both wet
and bulk collectors are presented). The given volume corresponds to the cumulative precipitation height in mm over the sampling period. Volume
weighted mean concentrations are given in
eq l
1
Pallanza Den Helder Eskdalemuir Stoke Ferry Ithaca
(Italy) (The Netherlands) (United Kingdom) United Kingdom) (United States)
Mosello et al., 1988 Slanina et al., 1979 Stedman et al., 1990 Stedman et al., 1990 Galloway and Likens, 1976
Three day-collection Variable collection intervals
Event-based collection interval Daily collection Daily collection (from 7 days to 24 days)
wet-only mean bulk/ wet-only mean bulk/ wet-only mean bulk/ wet-only mean bulk/ wet-only mean bulk/
collector wet ratio collector wet ratio collector wet ratio collector wet ratio collector wet ratio
rain : 1.07
volume rain+snow : 1.13 148.9 0.98 1142 1.15 387 1.22 – 1.07
Ca 25 1.31 4.5 1.06 1.7 1.29 3.6 1.55 – 2.00
Mg 7 1.38 8.7 0.87 4.1 1.05 2.5 1.33 – 1.50
K 2 1.00 3.8 1.22 2.3 1.11 2.8 1.09 – 1.10
Na 10 1.03 97.6 1.18 63.0 1.08 34.8 1.36 – 1.20
Cl 12 1.11 125.2 1.14 79.0 1.07 47.4 1.29 – 1.40
NH
4
52 1.06 57.8 1.13 22.1 0.87 67.1 0.80 – 1.10
NO
3
43 1.12 52.0 1.03 19.3 0.93 35.7 1.06 – 1.10
SO
4
80 1.08 26.5 1.02 10.3 0.98 17.2 1.05 – 1.00
H 46 0.98 64.9 0.95 27.0 0.89 25.0 1.16 – 0.92
356 A. THIMONIER
al., 1996; Table I). Differences in chemical composition of precipitation collected
by wet-only and bulk collectors have been assessed in a number of comparative
studies (Galloway and Likens, 1976; Galloway and Likens, 1978; Slanina et al.,
1979; Soederlund and Granat, 1982 in Slanina, 1986; Dasch, 1985; Mosello et al.,
1988; Richter and Lindberg,1988; Stedmanet al., 1990; Bredemeier and Lindberg,
1992). The usually higher precipitation volumes collected by bulk collectors (ratio
bulk/wet
1 for precipitation amount, Table I) may be related to the higher aero-
dynamic blockage by the wet-only collector, reducing catch efficiency (Stedman et
al., 1990). The sensitivity of the sensor driving the opening of the lid on wet-only
collectors may also influence the precipitation amount that is collected, especial-
ly at low precipitation rates. Calcium (Ca), magnesium (Mg), and potassium (K)
concentrations are often higher in bulk samples than in wet-only samples, because
of the deposition of soil-derived particles on the walls of the collectors during
rain-free periods. Differences for nitrogen compounds (nitrate NO
3
, ammonium
NH
4
) and sulphate (SO
4
2
) are usually smaller, but local or regional sources of
emissions can significantly influence the composition of bulk samples (Stedman et
al., 1990). Part of the differences between wet-only and bulk concentrations may
alsobe the resultof delayedopeningofthelid at the onset of precipitation,whenthe
concentrations of compounds may be highest: below-cloud scavenging of aerosols
and gases in the atmosphere (washout) leads to substantially higher concentrations
in rain drops in the early stage of an event (e.g. Hansen et al., 1994; Minoura and
Iwasaka, 1996; Burch et al., in press). Wet-only collectors may then underestimate
wet deposition (Slanina et al., 1979; Claassen and Halm, 1995a).
A number of studies have been carried out to assess the collection efficiency
of various wet-only or wet/dry collectors (collectors with an additional bucket
collecting deposition during dry periods) (Galloway and Likens, 1976; Slanina et
al., 1979; Bogen et al., 1980; De Pena et al., 1980; Schroder et al., 1985; Graham
et al., 1988; Graham and Obal, 1989; Hall et al., 1993; Claassen and Halm, 1995a
and 1995b). These studies showed that the performances of the collectors could
be quite variable according to the robustness of the device, the tightness of the lid,
and the sensitivity of the sensor. Most of all, however, wet-only collectors have
the drawback of being expensive and of requiring a power supply. An exception
may be the low-cost wet-only device developed by Glaubig and Gomez (1994),
involving a counter-weighted cover held in place over the collector by a piece of
water-soluble paper; but as the system must be re-installed after the end of each
rain event, this collector would be only suitable in regions characterised by heavy
rainstorms interrupting long dry periods. The following review concentrates on
continuously open collectors only.
Funnels against troughs. Funnel-type gauges are generally used in the open
field to measure rain amount and chemistry. Although it has been recommended
that collectors of the same design as open-field collectors should be employed for
throughfall measurements(e.g. Environmental Data Centre, 1993), no generalcon-
sensus over this has beenreached.A review of studies involving throughfall collec-
MEASUREMENT OF ATMOSPHERIC DEPOSITION UNDER FOREST CANOPIES 357
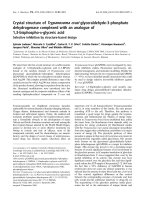
Figure 1. Bird’s-eye view of trough-type collectors used in the French network of forest ecosystem
monitoring (after Ulrich and Lanier, 1993)
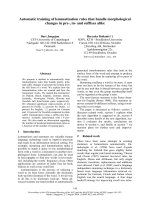
Figure 2. Examples of funnel-type rainwater collectors. (a) Collector proposed by EMEP (1977) and
Environmental Data Centre (1993). (b) Collector used in the ‘Swedish wet deposition measurement
network’ (after TheWorking Group for Environmental Monitoring, 1989). (c) ‘M
¨
unden 100’ collector
used in the Hessian Research Programme ‘Forest Damage by Air Pollution’ (after Brechtel, 1989).
(d) Collector used at the Klosterhede research site in Denmark (after Beier and Rasmussen, 1989).
tion reveals that two types of collectors, troughs (Figure 1) and funnels (Figure 2),
are in common use. Troughs are believed to collect more representative volumes,
as this type of gaugeintegrates a larger area and thus a variety of canopy conditions
(e.g. Reigner, 1964, in Helvey and Patric, 1965; Kostelnik et al., 1989; Draaijers
358 A. THIMONIER
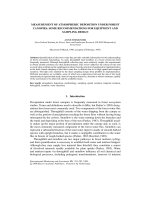
Figure 3. Examples of throughfall collectors: spiral-type and collar-type (after Rasmussen and Beier,
1987).
et al., 1996). The two types of gauge have been compared against each other in a
few studies: Reynolds and Leyton (1963, in Crockford and Richardson, 1990) and
Hogg et al. (1977, ibid.) found that troughs and rain gauges yielded similar mean
volumes. Kostelnik et al. (1989) obtained significantly larger throughfall amounts
in troughs relative to funnels. Crockford and Richardson (1990) also sampled high-
er volumes with troughs than with standard rain gauges. Conversely, Reynolds and
Neal (1991) observed a small bias toward a lower catch in troughs. Troughs were
shown to slightly reduce the variance ofthe estimates (Reynolds and Leyton (1963,
in CrockfordandRichardson,1990)andHogg et al. (1977,ibid.), butincreasingthe
collection area by using troughs rather than funnels does not reduce the number of
gauges necessary in the same proportions (Helvey and Patric, 1965). Stuart (1962,
in Kostelnik et al., 1989) reported that an increase in sampling area of throughfall
gauges only slightly reduced the variance of throughfall volume estimates. Potter
et al. (1991) still needed at least 12 randomly selected1.0
0.1 m trough collectors
to stabilise the coefficient of variation for base cation canopy exchange and dry
deposition values estimated from throughfall measurements. Generally speaking,
although sampling efficiency canvary according to the collector type, the sampling
strategy (number and location of collectors) is more important than the type of
gauge. Yet, in very heterogeneous canopies inducing a large variability in through-
fall distribution, troughs might collect a more representative sample (Weihe, 1976;
Crockford and Richardson, 1990).
MEASUREMENT OF ATMOSPHERIC DEPOSITION UNDER FOREST CANOPIES 359
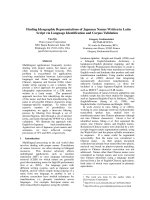
Figure 4. Stemflow amount collected per stem versus height of incident precipitation for three tree
species (after Cepel, 1967).
2.1.2. Stemflow
Stemflow is traditionally sampled with gutter-like collectors coiled in spiral or
collar around the stem of individual trees, and connected to a storage bottle by
a tube (Figure 3). As large amounts of stemflow can be collected (Figure 4), the
collection vessel must either have a high capacity or consist of several containers of
smaller capacity connected in series. An automated tipping-bucket system, allow-
ing continuous recording of volumes and sampling of representative proportional
fractions, is probably preferable over the long-term whenthe sampled species yield
large amounts of water.
2.2. D
ESIGN OF THE COLLECTORS AND SAMPLING ACCURACY
2.2.1. Incident Precipitation and Throughfall
Sources of errors. The accuracy required for the measurement of both precipitation
amount and chemistry is difficult to achieve using a single type of gauge (Hall
et al., 1993). To avoid contamination of the sample by splashing and by wind-
raised material from the ground, the collector must be set at a sufficient height,
but it then creates an obstacle to the windflow, resulting in a lower catch of the
falling precipitation (Rodda et al., 1985; Rodda and Smith, 1986; Sevruk, 1989;
Sevruk et al., 1994). The collection is especiallybiased against snowflakesand fine
rain (Rodda et al., 1985). The consequences for precipitation chemistry might be
substantial as fine rain drops are more concentrated than drops with greater radii
(B
¨
achmann et al., 1993). Wind-field deformation due to a funnel-type gauge can
360 A. THIMONIER
account for 2–10% of water losses for rain and up to 15% for snow according to
WMO (1971, in The Working Group for EnvironmentalMonitoring, 1989). Sevruk
et al. (1994) stated that losses due to aerodynamic blockage could be as large as
3–25% for rain and up to 100% for snow.
Windshields are usually not regarded as a satisfactory solution to the problem
in precipitation chemistry sampling, as they can also be a source of contamination.
Studies have been dedicated to improve the aerodynamic performance of the col-
lector itself. The value of two parameters describing the change in windflow over
the opening of a collectorshouldbe reduced (Hallet al., 1993): the relative increase
in wind speed measured above the collector inlet (acceleration) and the height of
maximum wind speed above the inlet opening relative to the diameter of the inlet
opening (called displacement by Hall et al., 1993). Comparing different shapes of
collectors with equivalent depth to diameter ratios, Hall et al. (1993) showed that
funnels induced comparable or greater acceleration, but lower displacement than
cylinder-type collectors. Rodda et al. (1985) also tested various shapes of gauge
and established that a simple funnel yielded rainfall depths which most closely
matched those measured by a gauge at ground level.
Beside shape characteristics, the aerodynamic performance of a collector de-
pendsonits depth andtheratio of depthto diameter(Halletal., 1993). Reducingthe
collector depth reduces the aerodynamic blockage caused by the collector. Shallow
collectors howeverare lessefficientindrainingthe collectedsample into thestorage
vessel, and are much more susceptible to splashing losses. Wind-driven circulation
inside the collector may also cause the ejection of collected precipitation, especially
in the form of snow or fine rain droplets, as well as increased evaporation from the
wetted collector walls. Experiments conducted on cylindrical collectors showed
that internal air circulation was highest for a ratio of depth to diameter around
unity. With increasing ratios (deeper collectors for a same diameter), ejection of
material became increasingly difficult (Hall et al., 1993).
Other sources of errors in the deposition estimates are due to wetting (adhesion
of water on the walls of the collector) and evaporation, accounting for 2–10% and
0–4% water losses, respectively, for funnel-type gauges. Wetting and evaporative
losses are likely to be higher for troughs due to their larger surface area. The
collector should also be designed to prevent rain from splashing in and out. WMO
(1971, in EMEP, 1977) recommends that precipitation gauges should comply with
the following:
– the area of the aperture should be known to the nearest 0.5% and the construc-
tion should be such that this area remains constant;
– the rim of the collectorshouldhave a sharp edge andshouldfall awayvertically
inside and should be steeply bevelled outside. Sevruk (1989) showed that
increasing the thickness of the rim led to an increasing wind speed increment
above the opening of a gauge;
– the vertical wall of the collector should be sufficiently deep and the slope
steep enough (at least 45
) to prevent loss by splashing and to allow good
MEASUREMENT OF ATMOSPHERIC DEPOSITION UNDER FOREST CANOPIES 361
drainage. According to Crockford and Richardson (1990), troughs should
similarly contain a V-section close to that of the ideal funnel-type gauge;
– the receiver should have a narrow neck and should be sufficiently protected
from radiation to prevent loss of water by evaporation.
Diameter of the opening. In the case of funnels, manuals often recommend
rather large diameter openings (20–40 cm). When the sampling interval is short,
large diameters have the advantage of providing enough solution for analysis
(Lewis and Grant, 1978). In forest stands, preference for large diameter funnels
additionally results from the reasoning that a larger area will sample a broader
variety of canopy conditions (see the above discussion on trough- and funnel-type
collectors). However, when the collection frequency is low and when rainfall is
potentially high over the defined sampling interval, the large volumes collected
by larger openings require high capacity containers, which can be difficult to
handle. Some studies have concluded that the sampling area of the collectors had
actually a minor influence on the precision of rainfall quantification, as already
mentioned in the previous discussion on the type of collector. A few investigations
more specifically dealt with the comparison of collectors of the same design but
with various collection areas: in forest stands. Weihe (1985) found no significant
differences betweenthroughfallamountscollected by 100 cm
2
and 200 cm
2
surface
area funnel-type gauges. In the open, Huff (1955) successfully tested several sizes
of smaller surface area gaugesagainst standard rain gauges;the results showed that
the small orifice gauges could be used in place of the standard gauge without loss
of accuracy. These studies were not concerned with the influence of the sampling
area on water chemistry; however, these few results support the use of relatively
small diameters when the rainfall depth over the sampling period would otherwise
require high capacity containers.
The volume of the vessel connected to the funnel or to the trough should
be large enough to contain the maximum precipitation amount expected at the
sampling location during the defined sampling interval. Commonly, for funnel-
type collectors, the diameter of the funnel and the sampling frequency are such that
the bottle connected to the funnel has a 2 to 5 l capacity. Figure 2 shows different
examples of gauges in use.
Use of a standard rain gauge for more accurate volume estimates. It would be
valuable to measure precipitation in the open with both a standard rain gauge and
the chosen device so that comparisons can be made of the volumes collected. Such
an exercise is useful in the open, where the influence of wind is more critical than
in forest stands.
The amount of precipitation recorded by the standard rain gauge enables the
correction of the water flux. The use of the values of the standard rain gauge
to compute fluxes of elements may however be inappropriate. Concentrations in
the collector might be enhanced due to evaporation, and the water amount and
concentrations from the same collector should then be used in order to offset
362 A. THIMONIER
this bias. On the other hand, as collection efficiency of non aerodynamically-
shaped gauges isbiasedagainstmore concentratedfineraindroplets,concentrations
measured in the collector may be lower than if the collector had the same catch
efficiency as a standard rain gauge.
Positioning in the field. In the open field, the opening of the rain gauges must
be set horizontal above the ground level rather than parallel to the ground surface.
There is no consensus over the height at which the collecting surface should be
positioned. The manual of the International Co-operative Programme on Assess-
ment and Monitoring of Air Pollution Effects onForests(ICP-Forests) (Programme
Coordinating Centres, 1994) recommends that the height should be approximate-
ly 1.5 m above ground level. The Working Group for Environmental Monitoring
(1989) advocates a height of between 1.5 m and 2 m. The manual of the Interna-
tional Co-operative Programme on Integrated Monitoring of Air Pollution Effects
(Environmental Data Centre, 1993) recommends 1.20 m. ISO/DIS 4222 (in The
Working Group for Environmental Monitoring, 1989) standardised the height at
1.8
0.2 m.
In forest stands, when funnel-type gauges are used, the opening area must
be set horizontal, as in the open field. Conversely, troughs must be tilted (25
according to Draaijers et al., 1996) to allow drainage towards the container. This
might be an additional factor affecting the water amount sampled (Sevruk, 1989).
In the monitoring sites of the Nordic countries, collectors have been set directly
on the ground or on a short pole (0.5 m) (The Working Group for Environmental
Monitoring, 1989). The ICP-Forests manual (Programme Coordinating Centres,
1994) recommends however that the opening area should be raised to a height of
approximately 1 m over the ground level to avoid contamination by soil.
2.2.2. Stemflow
High volumes of stemflow are usually collected from each sampled tree (Figure 4).
Rasmussen and Beier (1987) suggested that the wide opening of some collecting
devices led to an overestimation of the amounts of stemflow by including a fraction
of throughfall. It might be advisable to adjust the very small diameter slit (2 mm)
they recommend (Figure 3) to the species sampled. The opening should also not
be blocked too easily.
The stemflow collectors should be placed around the stem of the trees between
0.5 m and 1.5 m above ground level (Programme Coordinating Centres, 1994).
Care should be taken not to damage the bark, as stem exudates may contaminate
the sample.
2.3. M
ATERIAL
Whatever the type of collector chosen, all components should be made of chemi-
cally inert material. Quality Teflon (with smooth surfaces) is ideal but is expensive.
Alternatively, polyethylene is recommended for analyses of macro-ions in most
MEASUREMENT OF ATMOSPHERIC DEPOSITION UNDER FOREST CANOPIES 363
monitoring manuals, and has been used extensively. Polyethylene retains dry-
deposited particles more efficiently than Teflon surfaces (Dasch, 1985), and the
composition of bulk precipitation may thus be more influenced by dry deposition
when polyethylene collecting surfaces are used; but adsorption of gaseous SO
2
,
NO
2
and HNO
3
on polyethylene surfaces is insignificant, unless the surface is
wet (Dasch, 1985). Collection of precipitation for trace metals analysis is possi-
ble in polyethylene gauges but then a special cleaning procedure of all vessels is
required, and samples have to be acidified in the collection bottles to re-mobilise
the cations adsorbed on the walls. For special studies involving analysis of organic
components, Teflon or glass should be used (EMEP, 1977). Glass is not suitable
for other elements as the glass surface can act as an ion exchanger. It is also prone
to breakage (Galloway and Likens, 1976; 1978).
The collectors should be washed in acid and thoroughly rinsed with deionised
water after each sampling (Galloway and Likens, 1978). Washing is especially
recommended when the storage vessel has a small capacity, as the error due to
contamination by any remaining solution in the container is then proportionally
higher.
Silicon rubber has suitable chemical and physical properties for the gutter-like
component of the stemflow collectors. Polyethylene foam has also been used (e.g.
Ulrich and Lanier, 1993). Silicone sealant can be used to attach the collector to the
tree trunk. The flexibility of this material prevents the stem from being damaged
in the short term. However, on long-term monitoring sites, in view of tree growth,
the collecting device should be occasionally replaced.
3. Conservation in the Field and Collection Frequency
Contamination by coarse material. During the collection period the sample is
exposed to contamination by coarse material such as insects or leaves. This conta-
mination risk can be minimised by anet fitted at the junction between the collecting
part of the device and the storage bottle or the tube leading to it. Small glass beads
(Brechtel, 1989) orglasswool have also been used.Glasswool has the disadvantage
of presenting a large surface area which could adsorb dissolved substances (Lewis
and Grant, 1978). The nets used as filters may have the drawback of providing
an environment favourable to the growth of algae which may influence nitrogen
transformations (Ferm, 1993). The mesh size should not be too small (
0.25 mm
according to Draaijers et al., 1996), to limit humidity retention and subsequent
evaporation. A sufficiently large mesh size also reduces the chance of the filter
becoming clogged. With stemflow collectors, a narrow gutter opening has the
advantage of reducing the risk of collecting organic debris. Another source of con-
tamination is bird droppings. On funnel-type collectors, guard rings mounted a few
centimetres from the collecting surface (Figures 2a and 2c) have been a successful
preventative measure.
364 A. THIMONIER
Biochemical changes over the sampling interval. The concentration of some
elements or compounds can vary over time due to biochemical reactions in the
sample. Several studies have been concerned with the effects of the length of the
collection interval on the sample’s chemical composition. In these studies, samples
collected from shorter intervals are compared to samples collected after a longer
period in the field. In the following, ‘eventsamples’ refer to samples collected after
every precipitation event, ‘daily’, ‘weekly’, ‘biweekly’ or ‘monthly’ samples relate
to samples collected after 24 h, one week, two weeks, one month, respectively.
Some studies report only a minor influence of the collection interval. Mad-
sen (1982) compared wet-only precipitation volume and element concentrations
from daily, weekly and biweekly collection intervals in Florida (U.S.A.); volume-
weighted averagesfrom daily samples overone or two weeks were not significantly
different from measured values on the corresponding weekly or biweekly sam-
ples. In Ithaca (U.S.A.), Galloway and Likens (1976) obtained a good agreement
between bulk deposition estimated from summed amounts of samples collected
after every rain event and deposition assessed from collectors emptied after 2 to 4
weeks in winter. Under Scandinavian conditions, Granat (1974, in Slanina et al.,
1987) reported that precipitation samples were stable for at least one month. In The
Netherlands,Slanina et al. (1987) found no clear indication of changes which could
be ascribed to biological activity in wet-only subsamples of a precipitation event
kept in the field for different time intervals (0 to up to 86 days). More commonly,
however, significant alterations of the chemical composition of precipitation with
lengthening of the collection intervals have been observed. Phosphorus and nitro-
gen compounds are especially unstable (Draaijers et al., 1996). Van der Maas and
Valent (1989) observed increased ammonium concentrations in their throughfall
samples which they related to ammonification, but reports of decreasing ammoni-
um concentrations over time are the most frequent (Galloway and Likens, 1978;
de Pena et al., 1985; Sisterson et al., 1985; Tang et al., 1987; Liechty and Mroz,
1991; Ferm, 1993). The changes havebeenascribed to transformations into organic
formsbymicro-organisms or to nitrification (LiechtyandMroz, 1991;Ferm,1993).
Ammonia (NH
3
) exchanges and adsorption on the walls of the container were also
suggested as possible causes for the decrease in ammonium concentration (M
¨
uller
et al., 1982; de Pena et al., 1985), as storage in the dark and at cold temperatures
(
0 C), conditions under which biological activity is inhibited, yet was insuffi-
cient to prevent losses (M
¨
uller et al., 1982). Finally, although Ferm (1993) found
negligible denitrification as measured by changes in N
2
O content of the air above
his throughfall samples, denitrification might be anadditional factor accounting for
nitrogen losses under certain conditions, as suggested by Draaijers et al. (1996).
pHalsovaries with storagetime in the field.LiechtyandMroz (1991) observeda
decrease in pH in their throughfall samples, which they attributed to the production
of protons (H
) associated with ammonium transformations. The opposite trends
for pH have also been observed. Burch et al. (in press) measured higher pH on
precipitation samples in the laboratory than expected from the weighted mean of
MEASUREMENT OF ATMOSPHERIC DEPOSITION UNDER FOREST CANOPIES 365
pH measured in the field on sequentially sampled events. Camuffo et al. (1988)
similarly observed an increase in pH some hours after the rain event. Sisterson
et al. (1985) and de Pena et al. (1985) found that pH of weekly wet deposition
samples was higher than precipitation-weighted average pH from event samples
overthe correspondingweek.Severalpossible causesforthispHincrease havebeen
suggested: slow dissolution of alkaline (Ca, Mg, K) soil or dust particles (Peden
and Skowron, 1978; Sisterson et al., 1985; Camuffo et al., 1988), consumption of
organic acids by micro-organisms in the sample prior to analysis in the laboratory
(Keene and Galloway, 1984), neutralisation by the polyethylene vessels (Peden,
1988, in Bigelow et al., 1989), and field handling (Bigelow et al., 1989). In some
cases, seasonal trends were observed (Keene and Galloway, 1984; Bigelow et al.,
1989): higher neutralisation in summer was associated with the disappearance
of organic acids initially in larger concentrations (associated with organic matter
production during growing season).
Calcium and magnesium concentrations in wetprecipitation samplescanincrease
(Sisterson et al., 1985), while de Pena et al. (1985) observed lower Ca and Mg
concentrations with time. Evolution of Ca and Mg concentrations may be con-
trolled by two processes acting oppositely: slow dissolution of soil particles and
biological uptake. Sulphate concentrations may be influenced by exchanges with
gaseous SO
2
in the atmosphere above the sample (Sisterson et al., 1985). Lastly,
contamination during sample handling and evaporation may also partly account
for the increase in the concentrations of some elements. Volume losses with longer
sampling intervals have been observed by Galloway and Likens (1978), de Pena et
al. (1985), Liechty and Mroz (1991).
The diversity of conclusions from these studies may be related to the variety
of conditions prevailing at the study sites or during the period of investigation
(climate, local sources of contamination, and measures adopted to improve sample
conservation in the field). The type of sample examined (bulk precipitation, wet
deposition, throughfall) may also influence the results: Peden and Skowron (1978)
showed that the chemical composition of precipitation sampled by a wet/dry device
was more stable over time than that of samples from continuously open collectors.
Lastly, the initial chemical properties of the precipitation sample may partly con-
trol its evolution: acidic precipitation is unfavourable to biological activity and
may impede changes in the sample (Galloway and Likens, 1976); high nitrogen
concentrations in the sample may be a pre-condition for nitrification of ammonium
to take place (Liechty and Mroz, 1991).
Preventative measures against changes in chemical composition in the field.In
view of sample instability, event-based or weekly collection of the samples is best.
This improves the estimation of nutrient fluxes, as data variance increases with
longer collection intervals (Kimmins, 1973; Galloway and Likens, 1978), due to
increased probability for contamination, evaporation, and chemical or biological
changes. Furthermore, samples with higher concentrations due to contamination
are best detected over a shorter collection interval (Slanina et al., 1990). Sampling
366 A. THIMONIER
over a longer period leads to a ‘dilution’ of the error caused by a single event, and
thus to a general overestimation of deposition. Lastly, the consequencesof possible
data loss (due for instance to contamination) on the quality of the monitored time
series are smaller when sampling intervals are shorter (Programme Coordinating
Centres, 1994).
Very often, however, the sampling frequency must be lowered for logistic rea-
sons. Biological activity in the water sample can then be reduced by shielding
the collectors from sunlight and preventing warming. Storage of the collectors in
the ground meets these requirements, but the collecting surfaces must be raised
to avoid contamination by splashing. Tubes can be used for this purpose (Fig-
ures 1 and 2d). However, the use of tubes is inadvisable when careful cleaning
is necessary. Cleanliness of all parts of the collecting device is especially critical
in the case of funnel-type gauges, which sample lower volumes of water than
troughs. As an alternative to storage in the ground, funnel-type collectors can also
be wrapped in aluminium foil, or painted black (Ferm, 1993). Storage inside PVC
pipes has also been suggested (Brechtel, 1989; Figure 2c). Non-volatile chemical
preservatives can be added, but they should not interfere with the elements being
measured or they should be added in known amounts which can later be taken into
account. Galloway and Likens (1978) tested a variety of preservatives (CuSO
4
,
Na
2
SO
3
,Na
2
S
2
O
5
, HCHO [formaldehyde], CH
3
OH [methanol], CHCl
3
[chloro-
form], C
6
H
5
CH
3
[toluene], Hg(Ac)
2
[mercuric acetate]). All these biocides had
disadvantages, because of contamination (with the active compound or with impu-
rities in the reagent), reactions with the solutes in the sample, or interference with
the analytical method. Iodine has been further suggested as preservative as it has
a low vapour pressure and is not harmful to the environment. Ferm (1993) added
0.5 g of iodine to 5 l collection bottles before each sampling interval. Compari-
son of collectors with preservatives against black collectors without preservatives
showed however that keeping collectors dark impeded nitrogen transformation
quite effectively (Ferm, 1993). The use of preservatives can therefore be seen as an
additional precaution. In any case, electrical conductivity and pH will be modified
by the addition of preservatives. However, to evaluate the degree of transformation
of particular molecules, such as nitrogen compounds, it may be of interest to run
two parallel collectors, one with preservative and one without. Measurement of
organic nitrogen in addition to the analysis of the mineral forms may also provide
useful information about total input for this element.
Whatever the sampling frequency chosen, it should be the samefor all measure-
ments (throughfall, stemflow and open field precipitation).
Storage in the laboratory prior to analysis. pH and conductivity should be
measured immediately after arrival of the samples if not performed in the field.
Samples should then be filtered at 0.45
as soon as possible. Filtering significantly
improves sample conservation, partly by removing soil-derived particles, which
otherwise slowly dissolve in the sample or act as a cation exchange medium
(Peden and Skowron, 1978). Storage at 4
C in the dark is then usually considered
MEASUREMENT OF ATMOSPHERIC DEPOSITION UNDER FOREST CANOPIES 367
sufficient, although M
¨
uller et al. (1982) stated that only freezing could impede
ammonium losses during storage.
4. Sampling Design
4.1. T
HROUGHFALL
4.1.1. Spatial Variation of Throughfall
Throughfallamountandqualitycanvary according to site conditions (Parker, 1983;
Reynolds et al., 1989; Nord
´
en, 1991), tree species, stand structure, stand age, tree
vitality, or phenological stage (e.g. Parker, 1983; Levett et al., 1985; Carleton and
Kavanagh, 1990; Potter et al., 1991; Draaijers et al., 1992; Van Ek and Draaijers,
1994). Proximity of aerosol, dust or gas sources (Parker, 1983) and direction of
prevailing winds can influence deposition fluxes (Beier et al., 1993). Distance from
the forest edge is also a strong factor of variation, with effects being apparent over
a range of up to 100 m (Hasselrot and Grennfelt, 1987;Draaijers et al., 1988;Beier
and Gundersen, 1989; Ferm, 1993; Neal et al., 1994; Thimonier, 1994). Volume
and chemistry are thus highly variable in space, from local to regional scales.
Variation at the tree scale. At the tree scale, measurements at various distances
from the stem display strong intra-tree variations for fluxes and concentrations
(Stout and McMahon, 1961; Aussenac, 1970; Ford and Deans, 1978; Freiesleben
et al., 1986; Edwards et al., 1989; Carleton and Kavanagh, 1990; Johnson, 1990;
Pedersen, 1992; Beier et al., 1993; Hansen, 1995; Seiler and Matzner, 1995). In
somestandswith treespecies having awell-definedandsystematicbranchstructure,
such as Norway spruce (Picea abies (L.) Karst.) or Sitka spruce (Picea sitchensis
(Bong.) Carr.), this spatial variation across the crown shows consistent patterns
which can be modelled as a function of the distance from the trunk (Aussenac,
1970; Ford and Deans, 1978; Johnson, 1990; Pedersen, 1992; Beier et al., 1993;
Hansen, 1995). Ford and Deans (1978) measured greater amounts of throughfall
close to the tree stems in a 14-year-old Picea sitchensis plantation. Conversely,
Johnson (1990) obtained higher throughfall volumes at the crown edge of 50-
year-old Picea sitchensis trees. Pedersen (1992) also found increasing throughfall
amounts as well as decreasing concentrations from the stem to the canopy edge in
a 30-year-old Picea sitchensis stand. A similar increase in throughfall amount with
increasing distance from the stem was obtained in Picea abies stands (Aussenac,
1970; Beier et al., 1993; Hansen, 1995) and Scots pine (Pinus sylvestris L.) and
grand fir (Abies grandis (Dougl.) Lindl.) stands (Aussenac, 1970). These gradients
seem to be steeper in young conifer stands, with homogeneous circular crowns,
than in mature stands characterised by heterogeneous crown structure (Seiler and
Matzner, 1995). Deviceshavebeendesignedto integrate this non-randomintra-tree
variability, with collecting surface areas proportional to the projected area of the
crown at increasing distance from the stem (Rasmussen and Beier, 1987; Beier
and Rasmussen, 1989; Figure 5). However, the use of this type of device is limited
368 A. THIMONIER
Figure 5. Non-random throughfall collection by integrating trough or funnels with varying diameters
(after Rasmussen and Beier, 1987).
because its design must be adapted to the sampled tree, and because wind may
cause drift of incoming water from areas other than directly above the collector.
Furthermore, a single device of this type is insufficient to sample the variability of
the stand, which has been shown to be substantial at the small plot scale (Robson
et al., 1994). Variability is also important in uniform even-aged stands: in a 40-
year-old Picea abies plantation, Beier et al. (1993) observed a strong tree-to-tree
variability which was related to tree height and diameter.
Variation at the stand scale.Thenumberof gaugesnecessarytocover the spatial
variabilityat the stand scale and provide reliable estimates of throughfall deposition
has been estimated in a few studies. These studies involve a number of collectors
considered sufficiently large to allow the assumption that they provide the ‘true’
mean of the investigated throughfall parameter. Several approaches have then been
used.
A first method consists of calculating the range of variation of the estimates
for the investigated parameter for increasing numbers of collectors. Estimates are
computed from repeated combinations of randomly selected collectors ranging
from 1 to the total number of collectors. Results are plotted to visualise the rate of
improvement of the estimates with increasing numbers of collectors. This method
has been applied by Czarnowski and Olszewski (1970), Kimmins (1973), Puckett
(1991), Lawrence and Fernandez (1993). Czarnowski and Olszewski (1970) found
that for an old-growth oak stand, 30 gauges could be used to obtain a reliable
estimate of throughfall volume. Similarly, in a 30 to 40-year-old western hemlock
– western red cedar (Tsuga heterophylla (Raf.) Sarg. – Thuja plicata Donn) stand,
Kimmins (1973) found that the rate of improvement of the estimate of the mean
throughfall amountslowed down significantlybeyond30 collectors.In a deciduous
stand (Quercus sp.), Puckett (1991) showed that the rate of improvement of the
estimates was high during the addition of the first 10 collectors, then considerably
slowed down beyond 20 collectors. Lawrence and Fernandez (1993) computed the
minimum and maximum estimates of the mean deposition for the sampling month
MEASUREMENT OF ATMOSPHERIC DEPOSITION UNDER FOREST CANOPIES 369
with median variation. The number of collectors required to achieve convergence
of the estimates with a given precision (in percentage of the mean) was then
determined. In a spruce-fir forest, nutrient deposition on a seasonal or annual basis
could be estimated with 20 to 30 collectors within 20% of the mean. Examination
of the evolution of the variation coefficient (instead of the mean) with increasing
numbers of collectors has also been used to determine the number of collectors
required.Duijsings et al. (1986) thus foundthatin order to obtainannualdeposition
estimates within 10% of the mean (calculated from 11 collectors only), at least 5
collectors were required for calcium and sulphate, 8 for hydrogen.
A second method was developed by Peterson and Rolfe (1979). They analysed
the throughfall volumes collected in a deciduous forest by 96 fixed collectors for
12 precipitation eventsdistributed over a whole year. Mean throughfall volume and
standard deviation were determined for several combinations of different numbers
ofcollectors.Fromthis setofdata, for each season, a regressionofthe standarderror
in percent of the mean against the necessary number of samples was established.
With this method 14 collectors were necessary to achieve a standard error of 5%
of the mean in summer, 5 collectors in winter. Higher variability in summer was
ascribed to the foliage, which provided more sheltered areas or drip points in the
canopy than the branches alone.
Athird method,mostwidelyapplied(Kimmins,1973;Weihe,1985; Kostelniket
al.,1989;Puckett,1991;Lawrenceand Fernandez, 1993;SeilerandMatzner,1995),
consists of calculating the number of collectors necessary for a given confidence
interval and precision, using the following equation
2
n 1
2
E
2
(1)
where
= number of collectors;
1
= Student’s t value at the level;
= coefficient of variation;
= acceptable error (desired confidence interval), as a percentage of
the mean.
Helvey and Patric (1965) applied a particular case of Equation (1), with a 68%
confidence interval (t=1), by calculating the sample size with Equation (2)
standard deviation standard error
2
(2)
As pointed out by Kimmins (1973), Equation (2) is based on a desired standard
error, not on a desired confidence interval. Equation (2) yields a lower number of
necessary collectors than Equation (1).
From Equation (1), undercomparable mixed-hardwood forest canopies, Kostel-
nik et al. (1989) and Puckett (1991) obtained a number of respectively 14 and 11
370 A. THIMONIER
Table II
Average number of throughfall collectors needed to estimate ion concentrations and precipitation volume at the 95% confidence level within 10%
of the mean. 1. Under mixed-hardwood canopies (Kostelnik et al., 1989 and Puckett, 1991), 2. under a spruce-fir canopy (Lawrence and Fernandez,
1993) and 3. under a Picea abies canopy (Seiler and Matzner, 1995)
Kostelnik et al., 1989 Puckett, 1991 Lawrence and Fernandez, 1993 Seiler and Matzner, 1995
(6 precipitation events) (5 precipitation events) (using median coefficient of (samples mixed
mean (standard deviation) mean (standard deviation) variation for 23 monthly samples) over a 6 month period)
Volume 14 (5) 11 (3) 24 1
H
48 (27) 41 (39) 68 47
Ca
2
179 (78) 64 (82) 168 41
Mg
2
177 (65) 72 (56) 208 45
K
382 (226) 106 (58) 122 35
Na
132 (101) 71 (54) 105 72
Cl 152 (78) 104 (100) 90 143
Mn
2
– 65 (46) – 44
SO
2
4
69 (74) 20 (18) 43 54
NH
4
69 (57) 310 (502) 208 23
NO
3
13 (6) 19 (14) 221 31
DON
a
––– 23
TotalN––– 17
DOC
b
– – 141 –
a
DON: dissolved organic nitrogen.
b
DOC: dissolved organic carbon.
MEASUREMENT OF ATMOSPHERIC DEPOSITION UNDER FOREST CANOPIES 371
collectors on average to estimate the mean volume within 10% at the 95% confi-
dence level (Table II). In a mature Picea abies stand, Seiler and Matzner (1995)
calculated that onecollector would be sufficientto estimate the average throughfall
amountwiththe same precisionandconfidencelevel;however, intheircalculations,
they used samples pooled in proportion to the volumes over the 6-month sampling
period; conversion into seasonal or annual values decreases the spatial variation
of throughfall deposition, as the influence of values for shorter time intervals with
atypically high variability is decreased when these values are summed (Duijsings
et al., 1986; Lawrence and Fernandez, 1993). Other factors may affect the results.
For example, the number of gauges necessary to estimate throughfall amount is
higher in the case of low intensity and short duration precipitation events, when
water saturation of foliage is not reached (Helvey and Patric, 1965; Aussenac,
1970). Asymptotic decreases in variation coefficients for throughfall amount esti-
mates with increasing incident precipitation have been observed by several authors
(Aussenac, 1970; Kimmins, 1973; Duijsings et al., 1986; Loustau et al., 1992). Yet
no clear pattern of variation of the coefficient of variation for the concentrations
of elements with throughfall volumes was observed (Kimmins, 1973; Duijsings
et al., 1986); the number of gauges required to estimate element concentrations
will thus vary independently of the throughfall volume. This minimum number
for estimates of nutrient concentrations or fluxes is usually much higher than for
estimates of throughfall amount (Kimmins, 1973; Levett et al., 1985; Duijsings et
al., 1986; Kostelnik et al., 1989; Puckett, 1991; Lawrence and Fernandez, 1993;
Seiler and Matzner, 1995; Figure 6 and Table II). It is especiallyhigh on sites with a
heterogeneous structure of the canopy: in a youngPinus radiata D. Don plantation
and a Nothofagus truncata stand, Levett et al. (1985) calculated that a precision
of 10% of the mean annual flux for the most variable element could be achieved
with 30 throughfallfunnel-typecollectors on an annual basis, whereas substantially
greater numbers of collectors were necessaryin the case of a thinned Pinus radiata
plantation or a very heterogeneous Podocarp-hardwood forest. Seasonally induced
patchystructure may also significantly increase the required sample size (Duijsings
et al., 1986).
The large sampling effort required in terms of number of collectors has led
to the development of alternate methods. The ‘roving’ collectors system was first
proposed by Wilm (1943, in Kimmins, 1973) to reduce the number of collectors
on the plot. In this method, collectors are randomly relocated after each collection
interval and data are adjusted by regression on the incident precipitation over the
collection interval, so that the mean can be calculated for the entire period of study
with the whole set of data. The validity of this method relies on the strong cor-
relation between incident precipitation and throughfall volumes. Kimmins (1973)
tested the application of Wilm’s (1943) method to the study of chemical concentra-
tions and fluxes under the canopy, but the poorer correlations between throughfall
and incident precipitation obtained when chemical parameters were considered
rendered this method inapplicable under the conditions of the study. Derivatives of
372 A. THIMONIER
Figure 6. Number of throughfall collectors needed to estimate concentrations, volume and conduc-
tivity with a 95% confidence interval equal to 5% of the respective means in a 30–40-year-old Tsuga
heterophylla – Thuja plicata stand (after Kimmins, 1973).
Wilm’s (1943) method have been developed. In a two-year study, Attiwil (1966,
in Kimmins, 1973) used three collectors, one being fixed while the other two were
randomlyrelocatedevery second weekaftersamplecollection. Regressionanalyses
of the values obtained from the roving collectors against the values from the fixed
collector were used to estimate concentration values for each period. This method
assumes a stable relationship between values from the fixed collector and the ‘true’
mean. Kimmins (1973) found however that the ranking of the collectors based on
concentration or deposition values was very unstable from a collection interval to
another. He also tested the relationship between values from a variable number of
roving collectors (2 to 10) against values from one fixed collector. A large scat-
ter in the data compromised the validity of the regression (in terms of accuracy)
when few collectors or a short period of investigation restricted the numbers of
available samples. Lloyd and Marques (1988) showed that the error term due to
sampling a fraction of the area with n fixed gauges could be reduced by relocating
the collectors m times. Mathematically constructed curves relating errors in mean
throughfall amount estimates to the number of random arrangements for various
numbers of gauges gave theoretical values consistent with real data. The roving
method may be unsuitable when the objective is the study of short-term variation
of throughfall, but estimates at the plot-scale for a longer period are substantially
MEASUREMENT OF ATMOSPHERIC DEPOSITION UNDER FOREST CANOPIES 373
improved. In any case, relocation of the collectors reduces biases due to sampling
of a restricted fraction of the canopy (Neal et al., 1994).
Manualsformonitoring programmesgive a guideline numberof 4–10 collectors
per 0.1 ha as a sampling density that is commonly applied (The Working Group
for Environmental Monitoring, 1989;Environmental Data Centre, 1993). The ICP-
Forests manual (Programme Coordinating Centres, 1994) advocates a pre-study
of the variation within the plot to determine the required number specifically
for the studied site, using one chemical parameter. However, the number that is
necessaryvaries stronglyaccordingto the parameterbeingstudied.It also fluctuates
considerably with the sampling interval or the precipitation event for which it is
computed (Kimmins, 1973; Kostelnik et al., 1989; Puckett, 1991; Figure 6 and
Table II).
Spacing of the collectors. Czarnowski and Olszewski (1970) found that the
mean throughfall amount did not depend on the spacing of the gauges when these
were placed at regular intervals (1 m) along a 100 m transect in a old-growth oak
forest. Using 52 fixed throughfall gauges distributed over a 50 m
50 m area in a
maritime pine (Pinus pinaster Ait.) plantation, Loustau et al. (1992) detected no
spatialautocorrelationbetweenmeasurementsofthroughfall amounts. The random
distribution of drip zones in the canopy can induce large differences in throughfall
amount collected by two collectors only 1.5 m apart (Puckett, 1991). Brechtel
(1989) recommended that the distance between adjacent gauges should be two
thirds of the average spacing of the trees. When the number of collectors used is
limited, however, it may be preferable not to place the collectors too close to each
other, in order to limit the risk that the sampled canopy might change dramatically
due to changes affecting one single tree. In any case, the structure of the canopy
sampled by the collectors should be documented.
4.1.2. Siting on Plots Designed for Long-Term Ecosystem Research
In ecosystem studies or in long-term studies involving a number of plots, the whole
area of large plots (
1 ha) cannot be sampled. This is because disturbance to other
ecological measurements needs to be avoided, and because the large number of
collectors would be unmanageable. The location of the collectors must therefore
be restricted to a smaller area, even though extrapolation to the whole stand could
result in errors. In a homogeneous Pinus sylvestris plantation, such errors have
been found to be as high as 20% for water input (Cape, 1989).
The position of this sub-plot can be determined on the basis of the other eco-
logical measurements carried out on the site. A random component can also be
included in the selection, as well as subjective considerations (presence of a vis-
ible environmental gradient such as a slope). On the delimited subplot, random
or systematic siting of the collectors, or a combination of both, is recommended.
Systematic sampling is satisfactory as long as the studied stand does not display
any systematic pattern (such as plantation rows). Some examples of placement of
the collectors are given Figure 7. Stratification by canopy structure or tree size has
374 A. THIMONIER
Figure 7. Examples of systematic siting of the throughfall collectors in a plot (after Programme
Coordinating Centres, 1994 (a) and Environmental Data Centre, 1993 (b and c)).
also been suggested (e.g. Aussenac, 1968; Levett et al., 1985), but should not be
used at too fine a scale. Although systematic patterns of interception related to the
stand structure can be observed (Robson et al., 1994), fixed collectors can sample
highly variable throughfall amounts or chemistry from one precipitation period
to another, as determined by variations in wind speed and direction or rainfall
intensity (Kimmins, 1973; Weihe, 1985; Robson et al., 1994).
A subjective sampling design has been favoured in some studies where the
number of collectors that could be managed was low. Collectors were installed
under a tree or a group of trees typical of the stand (average age, diameter, height)
in such a way that the sampled area was representative of the respective gap and
canopy proportion (e.g. Atteia and Dambrine, 1993), or even took into account the
spatial gradient of concentrations along the crown projection (Ulrich and Lanier,
1993; Figure 1). Such a sampling design enables relatively easy maintenance,
and restricts trampling in the plot, an important point when the site is visited
on a frequent basis and monitored over the long-term. However, in view of the
substantial spatial and temporal variation of throughfall chemistry, this type of
design should not be applied when logistics enable a greater number of collectors.
4.2. S
TEMFLOW
4.2.1. Pre-Assessment of the Needs for Stemflow Measurement
Stemflow collection represents significant additional costs in the estimation of the
forest water flux. It is complicated by the large volumes involved, and sampling
devices are not always entirely satisfactory (due to the risk of leakage or blockage).
Stemflow gauges badly attached to the stem could also damage the tree. Because
of all these problems, the sampling effort may not be justified in stands where
stemflow makes only a minor contribution to the flux.
MEASUREMENT OF ATMOSPHERIC DEPOSITION UNDER FOREST CANOPIES 375
Table III
Some examples of throughfall and stemflow amounts as a percentage of incident rainfall
Stem Incident
density Sampled rainfall
Stand composition Age (yr) (stems/ha) trees (mm)
b
Throughfall Stemflow Reference
Fagus sylvatica L., Carpinus betulus L. 30 1300 14 724 76% 7% Aussenac (1968)
Fagus sylvatica L. 50 599 2 1528 66% 9% Ulrich et al. (1995)
Fagus sylvatica L. 90 374 2 943 79% 8% Ulrich et al. (1995)
Fagus sylvatica L. 80–100 576 2 2618 90% 27%
d
Ulrich et al. (1995)
Fagus sylvatica L. 100 240 2 1013 71% 11% Nihlg
˚
ard (1970)
Fagus orientalis Lipsky 46 – 5 1045 67% 16% Cepel (1967)
Fagus grandifolia Ehrh. [all ages] – 7 340 66% 10% Voigt (1960)
Quercus petraea (Mattus.) Liebl. 29 5000 6 1637 74% 10% Cape et al. (1991)
Quercus petraea (Mattus.) Liebl. 40–120 158 7 1717 88% 2% Carlisle et al. (1966, 1967)
Quercus petraea (Mattus.) Liebl. 120 182 2 1222
c
71% <l% Nizinski and Saugier (1988)
Quercus dschorochensis Koch 50 – 3 1020 69% 11% Cepel (1967)
Quercus prinus L. (main species) – –
a
1260 88% 5% Johnson et al. (1985)
Hardwood (main species: – – 16–25 1023 82% 3% Neary and Gizyn (1994)
Acer saccharum Marsh.)
Alnus glutinosa (L.) Gaertn. 29 2510 6 1637 74% 9% Cape et al. (1991)
Liriodendron tulipifera L. (main species) – –
a
1260 97% 3% Johnson et al. (1985)
Picea abies (L.) Karst. 29 3200 6 1637 71% 14% Cape et al. (1991)
Picea abies (L.) Karst. 30 2160 6 816 64% 2% Aussenac (1968)
Picea abies (L.) Karst. 55 880 2 1013 58% 3% Nihlg
˚
ard (1970)
376 A. THIMONIER
Table III
Continued
Stem Incident
density Sampled rainfall
Stand composition Age (yr) (stems/ha) trees (mm)
b
Throughfall Stemflow Reference
Picea sitchensis (Bong.) Carr. 14 3590 10 1639 43% 27% Ford and Deans (1978)
Picea sitchensis (Bong.) Carr. 24 3600 6 1005 67% 14% Cape et al. (1991)
Picea sitchensis (Bong.) Carr. 50 970 9 2130 69% 3% Johnson (1990)
Pinus sylvestris L. 26 2700 6 1005 76% 9% Cape et al. (1991)
Pinus sylvestris L. 28 1520 8 816 68% 2% Aussenac (1968)
Pinus sylvestris L. 29 2270 6 1637 59% 7% Cape et al. (1991)
Pinus syivestris L. 33 3900 6 918 55% 14% Cape et al. (1991)
Conifers (main species: Pinus strobus L.) – – 16–25 1046 73% 2% Neary and Gizyn (1994)
Pinus nigra var. pallasiana 48 – 3 1061 65% 4% Cepel (1967)
Pinus resinosa Ait. 35 1235 7 340 80% 1% Voigt (1960)
Abies grandis (D. Don) Lindl. 35 620 5 816 57% 1% Aussenac (1968)
Larix decidua Mill. 33 3900 6 918 77% 4% Cape et al. (1991)
Larix decidua Mill. 27 1600 6 1005 84% <1% Cape et al. (1991)
Tsuga canadensis (L.) Carr. – – 7 340 61% 6% Voigt (1960)
a
Sampling of all trees within 15 2 m-diameter plots.
b
Rainfall depth over the sampled period. Given is the annual average, unless indicated otherwise.
c
Over 21 months.
d
This high percentage for stemflow was ascribed to fog, which was collected by stemflow collectors but not by rain gauges.
MEASUREMENT OF ATMOSPHERIC DEPOSITION UNDER FOREST CANOPIES 377
Figure 8. Stemflow in forest stands of different tree species and ages: mean, monthly maximum and
minimum in percentage of incident precipitation (P = 775 mm) (after Brechtel, 1970, in Brechtel,
1989).
Figure 9. Stemflow as a percentage of precipitation height per storm for different tree genera (after
Kittredge, 1948, in Mayer, 1987).
The importance of stemflow can be inferred from the species composition
and the age of the stand. Stemflow amount is affected by bark smoothness, stem
diameter and branch angle. It is highest for large-crowned emergent trees with
smooth bark and upright branches (Parker, 1983). Stemflow volumes are especially
highinbeech(Fagussp.)forests(e.g.Cepel,1967;Aussenac,1968; Brechtel,1989;
Figures 8 and 9; Table III). As the stand grows older, the proportion of stemflow