Báo cáo khoa học: "Discourse Type Clustering using POS n-gram Profiles and High-Dimensional Embeddings" doc
Bạn đang xem bản rút gọn của tài liệu. Xem và tải ngay bản đầy đủ của tài liệu tại đây (1.77 MB, 9 trang )
Proceedings of the EACL 2012 Student Research Workshop, pages 55–63,
Avignon, France, 26 April 2012.
c
2012 Association for Computational Linguistics
Discourse Type Clustering using POS n-gram Profiles and
High-Dimensional Embeddings
Christelle Cocco
Department of Computer Science and Mathematical Methods
University of Lausanne
Switzerland
Abstract
To cluster textual sequence types (discourse
types/modes) in French texts, K-means
algorithm with high-dimensional embed-
dings and fuzzy clustering algorithm were
applied on clauses whose POS (part-of-
speech) n-gram profiles were previously ex-
tracted. Uni-, bi- and trigrams were used
on four 19
th
century French short stories by
Maupassant. For high-dimensional embed-
dings, power transformations on the chi-
squared distances between clauses were ex-
plored. Preliminary results show that high-
dimensional embeddings improve the qual-
ity of clustering, contrasting the use of bi-
and trigrams whose performance is disap-
pointing, possibly because of feature space
sparsity.
1 Introduction
The aim of this research is to cluster textual se-
quence types (named here discourse types)
1
, such
as narrative, descriptive, argumentative and so on
in French texts, and especially in short stories
which could contain all types.
For this purpose, texts were segmented into
clauses (section 2.1). To cluster the latter, n-gram
POS (part-of-speech) tag profiles were extracted
(section 2.3). POS-tags were chosen because of
their expected relation to discourse types.
Several authors have used POS-tags among
other features for various text classification tasks,
such as Biber (1988) for text type detection, Karl-
gren and Cutting (1994) and Malrieu and Rastier
1
Sequence type is an appropriate name, because it refers
to text passage type. However, it will be further mentioned
as discourse types, a frequent French term. In English, a
standard term is: discourse modes.
(2001) for genre classification, and Palmer et al.
(2007) for situation entity classification. The lat-
ter is an essential component of English discourse
modes (Smith, 2009). Moreover, previous work in
discourse type detection has shown a dependency
between POS-tags and these types (Cocco et al.,
2011).
In this paper, K-means algorithm with high-
dimensional embeddings and fuzzy clustering al-
gorithm were applied on uni-, bi- and trigram
POS-tag profiles (section 2.4) and results were
evaluated (section 2.5). Finally, results are given
in section 3.
2 Method
2.1 Expert assessment
The human expert, a graduate student in French
linguistics, annotated 19
th
century French short
stories by Maupassant, using XML tags. Each
text was first segmented into clauses, whose
length is typically shorter than sentences. Then,
texts were annotated retaining the following six
discourse types: narrative, argumentative, de-
scriptive, explicative, dialogal and injunctive.
2
They resulted from an adaptation of the work of
Adam (2008a; 2008b) in text and discourse analy-
sis, as well as Bronckart (1996) in psycholinguis-
tics, concerning textual sequence types. The for-
mer does not consider the injunctive type.
Let us briefly describe these types (Adam,
2008a; Adam, 2008b; Bronckart, 1996), together
with the criteria finally adopted by the human ex-
pert for this time-consuming task.
2
Regarding English, there are five discourse modes ac-
cording to Smith (2009): narrative, description, report, in-
formation and argument.
55
Narrative type corresponds to told narrative.
One of the principal linguistic markers of this
type is the presence of past historic tense. How-
ever, when referring to repeated actions, imperfect
tense is generally used. Argumentative type cor-
responds to texts whose aim is to convince some-
body of an argument. An important linguistic
marker of this type is the presence of argumen-
tative connectors such as mais “but”, cependant
“however”, pourtant “yet” and so on. Explica-
tive type aims to explain something unknown,
such as encyclopaedic knowledge, and answers
to the question “Why?”. A typical linguistic
marker of this type is the presence of phraseo-
logical phrases, such as (si) c’est parce que/c’est
pour que “(if) it is because/in order to”. De-
scriptive type represents textual parts where the
time of the story stops and where characteristic
properties of a subject, animated or not, are at-
tributed. Several linguistic markers are relevant
for this type: use of imperfect tense (except when
the narrative part is in present tense); a large num-
ber of adjectives; spatio-temporal organizers; and
stative verbs. Dialogal type is a verbal exchange.
However, in this project, direct speech is consid-
ered as dialogal too. Typical linguistic markers
of this type are quotes, strong punctuation and
change of spatio-temporal frame. Finally, injunc-
tive type is an incentive for action. This type has
linguistic markers such as use of imperative tense
and exclamation marks. In our corpus, this type is
always included in a dialogal segment.
Discourse types are generally nested inside
each other resulting in a hierarchical structure.
For instance, an injunctive sequence of one clause
length can be included in a dialogal sequence,
which can in turn be included in a longer nar-
rative sequence matching the entire text. In the
simplified treatment attempted here, the problem
is linearized: only the leaves of the hierarchical
structure will be considered.
2.2 Corpus
The corpus consists of four 19
th
century French
short stories by Maupassant: “L’Orient” , “Le
Voleur”, “Un Fou?” and “Un Fou”. Descriptive
statistics about these texts are given in table 1.
These values are based on unigram counts. For
bigram and trigram counts, clauses shorter than
two and three words respectively were removed.
For the first text, “L’Orient”, three clauses were
removed for trigrams; for “Le Voleur”, one clause
was removed for trigrams; and for “Un Fou?”,
thirteen clauses for trigrams. An extra step was
made for “Un Fou”, because of its very different
structure w.r.t. the three other texts. Indeed, the
majority of this text is written as a diary. Dates,
which could not be attributed to a discourse type,
were consequently removed, reducing the number
of clauses from 401 to 376 for unigrams. Then,
two clauses were removed for bigrams because
they were too short, and again ten for trigrams.
2.3 Preprocessing
Before applying clustering algorithms, annotated
texts were preprocessed to obtain a suitable
contingency table, and dissimilarities between
clauses were computed. Firstly, each text was
POS-tagged with TreeTagger (Schmid, 1994) ex-
cluding XML tags. Secondly, using the manual
clause segmentation made by the human expert,
distributions over POS-tag n-grams were obtained
for each clause, resulting in a contingency table.
Then, chi-squared distances between clauses
were computed. In order to accomplish this, co-
ordinates of the contingency table (with n
ik
de-
noting the number of objects common to clause
i and POS-tag n-gram k, n
i•
=
k
n
ik
and
n
•k
=
i
n
ik
) are transformed in this manner:
y
ik
=
e
ik
f
i
√
ρ
k
−
√
ρ
k
(1)
where e
ik
= n
ik
/n are the relative counts, f
i
=
e
i•
= n
i•
/n (row weights) and ρ
k
= e
•k
=
n
•
k/n (column weights) are the margin counts.
Finally, the squared Euclidean distances between
these new coordinates
D
ij
=
k
(y
ik
− y
jk
)
2
(2)
define the chi-squared distances.
2.4 Algorithms
Two algorithms were applied on these distances.
K-means with high-dimensional embedding
Firstly, the well-known K-means (see e.g. Man-
ning and Sch
¨
utze (1999)) was performed in a
weighted version (i.e. longer clauses are more im-
portant than shorter ones), by iterating the follow-
ing pair of equations:
z
g
i
=
1 if g = argmin
h
D
h
i
0 else.
(3)
56
Texts sent. clauses
tokens types % discourse types according to the expert
with punct. w/o punct. word tag arg descr dial expl inj nar
L’Orient 88 189 1’749 1’488 654 27 4.23 20.11 25.93 19.05 2.65 28.04
Le Voleur 102 208 1’918 1’582 667 29 4.81 12.02 13.94 4.81 2.88 61.54
Un Fou? 150 314 2’625 2’185 764 28 18.15 10.51 14.65 14.65 8.28 33.76
Un Fou 242 376 3’065 2’548 828 29 17.82 13.83 1.86 11.70 12.23 42.55
Table 1: Statistics of the annotated texts by Maupassant. For the text “Un Fou”, dates were initially removed from
the text. Number of sentences as considered by TreeTagger (Schmid, 1994). Number of clauses as segmented by
the human expert. Number of tokens including punctuation and compounds as tagged by TreeTagger. Number
of tokens without punctuation and numbers, considering compounds as separated tokens. Number of wordform
types. Number of POS-tag types. The last columns give the percentage of clauses for each discourse type (arg =
argumentative, descr = descriptive, dial = dialogal, expl = explicative, inj = injunctive, nar = narrative).
D
g
i
=
j
f
g
j
D
ij
− ∆
g
(4)
where z
g
i
is the membership of clause i in group
g and D
g
i
is the chi-squared distance between
the clause i and the group g as resulting from
the Huygens principle. In the equation 4, f
g
j
=
(f
i
z
ig
)/ρ
g
= p(i|g), D
ij
is the chi-squared dis-
tances between clauses given by the equation 2
and ∆
g
=1/2
jk
f
g
j
f
g
k
D
jk
is the inertia of
group g. In addition, ρ
g
=
i
f
i
z
ig
= p(g) is
the relative weight of group g.
At the outset, the membership matrix Z was
chosen randomly, and then the iterations were
computed until stabilisation of the matrix Z or a
number of maximum iterations N
max
.
Besides the K-means algorithm, Schoenberg
transformations ϕ(D) were also operated. They
transform the original squared Euclidean dis-
tances D into new squared Euclidean distances
ϕ(D) (Bavaud, 2011) and perform a high-
dimensional embedding of data, similar to those
used in Machine Learning. Among all Schoen-
berg transformations, the simple componentwise
power transformation was used, i.e.
ϕ(D
ij
) = (D
ij
)
q
(5)
where 0 <q≤ 1.
In a nutshell, the K-means algorithm was ap-
plied on the four texts, for uni-, bi- and trigrams
POS-tags, with q in equation 5 varying from 0.1
to 1 with steps of 0.05. Given that the aim was
to find the six groups annotated by the human ex-
pert, the K-means algorithm was computed with a
number of groups m =6. Moreover, N
max
= 400
and for each q, calculations were run 300 times,
and then the averages of the relevant quantities
(see section 2.5) were computed.
Fuzzy clustering
Secondly, the same algorithm which was used in
a previous work (Cocco et al., 2011) was applied
here, i.e. the fuzzy clustering algorithm.
In brief, it consists of iterating, as for the K-
means, the membership z
g
i
of clause i in group g
defined in the following way (Rose et al., 1990;
Bavaud, 2009):
z
g
i
=
ρ
g
exp(−βD
g
i
)
m
h=1
ρ
h
exp(−βD
h
i
)
(6)
until stabilisation of the membership matrix Z
(randomly chosen at the beginning as uniformly
distributed over the m groups) or after N
max
itera-
tions. D
g
i
is given by equation 4 and ρ
g
is the rela-
tive weight of group g. Moreover, it turns out con-
venient to set β := 1/(t
rel
×∆), the “inverse tem-
perature” parameter, where ∆ :=
1
2
ij
f
i
f
j
D
ij
is the inertia and t
rel
is the relative temperature
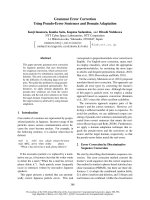
which must be fixed in advance.
The values of β controls for the bandwidth
of the clustering, i.e. the number of groups: the
higher β, the larger the final number of groups
M (see figure 9). As a matter of fact, depend-
ing of β values, group profiles are more or less
similar. Also, group whose profiles are simi-
lar enough are aggregated, reducing the num-
ber of groups from m (initial number of groups
chosen at the beginning) to M. This aggrega-
tion is made by adding memberships of clauses:
z
[g∪h]
i
= z
g
i
+ z
h
i
. Two groups are considered
similar enough if θ
gh
/
θ
gg
θ
hh
≥ 1 −10
−5
, with
θ
gh
=
n
i=1
f
i
z
g
i
z
h
i
which measures the overlap
between g and h (Bavaud, 2010). Finally, each
clause is attributed to the most probable group.
For the application in this project, fuzzy clus-
tering algorithm was computed on the four texts,
57
for uni- bi- and trigrams POS-tags. At the outset,
the initial number of groups m was equal to the
number of clauses for each text (see table 1 and
section 2.2), with a relative temperature t
rel
from
0.022 to 0.3 with steps of 0.001 (except for the
text “Un Fou” with t
rel min
=0.02, t
rel max
=0.3
and t
rel step
=0.01). Besides this, N
max
= 400
and for each t
rel
, algorithm was run 20 times, and
finally the averages of the relevant quantities (see
section 2.5) were computed.
2.5 Evaluation criteria
The clustering obtained by the two algorithms
(K-means with high-dimensional embedding and
fuzzy clustering) were compared to the classifi-
cation made by the human expert. As clustering
induces anonymous partitions, traditional indices
such as precision, recall and Cohen’s Kappa can-
not be computed.
Among the numerous similarity indices be-
tween partitions, we have examined the Jaccard
index (Denœud and Gu
´
enoche, 2006; Youness
and Saporta, 2004):
J =
r
r + u + v
(7)
whose values vary between 0 and 1, and the
corrected Rand index (Hubert and Arabie, 1985;
Denœud and Gu
´
enoche, 2006):
RC =
r −Exp(r)
Max(r) − Exp(r)
(8)
whose the maximal value is 1. When this index
equals 0, it means that similarities between par-
titions stem from chance. However, it can also
take negative values when number of similarities
is lower than the expectation (i.e. chance).
Both indices are based upon the contingency
table n
ij
, defined by the number of objects at-
tributed simultaneously to group i (w.r.t. the
first partition) and to group j (w.r.t. the sec-
ond partition). Moreover, in both indices, r =
1
2
ij
n
ij
(n
ij
− 1) is the number of pairs si-
multaneously joined together, u =
1
2
(
j
n
2
•j
−
ij
n
2
ij
) (respectively v =
1
2
(
i
n
2
i•
−
ij
n
2
ij
))
is the number of pairs joined (respectively sep-
arated) in the partition obtained with algorithm
and separated (respectively joined) in the par-
tition made by the human expert, Exp(r)=
1
2n(n−1)
i
n
i•
(n
i•
− 1)
j
n
•j
(n
•j
− 1) is the
expected number of pairs simultaneously joined
together by chance and Max(r)=
1
4
i
n
i•
(n
i•
−
1) +
j
n
•j
(n
•j
− 1).
3 Results
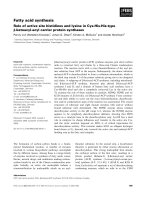
On the one hand, results obtained with the K-
means algorithm and power (q) transformations
for uni-, bi- and trigrams are presented in figures
1 to 8. On the other hand, results obtained with
fuzzy clustering for uni- bi- and trigrams are only
shown for the text “Le Voleur” in figures 9 to 13.
For the three other texts, results will be discussed
below.
0.2 0.4 0.6 0.8 1.0
0.00 0.01 0.02 0.03 0.04 0.05
Power (q)
Corrected Rand Index
Figure 1: “L’Orient” with K-means algorithm: cor-
rected rand index as a function of power (q) (◦ = uni-
grams, = bigrams and × = trigrams). The standard
deviation is approximatively constant across q ranging
from a minimum of 0.018 and a maximum of 0.024
(unigrams); 0.0099 and 0.015 (bigrams); 0.0077 and
0.013 (trigrams).
A first remark is that corrected Rand index and
Jaccard index behave differently in general. This
difference is a consequence of the fact that Jac-
card index does not take into account the number
of pairs simultaneously separated in the two par-
titions, a fact criticised by Milligan and Cooper
(1986).
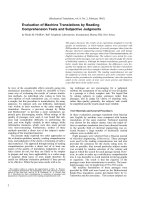
Regarding the texts “L’Orient”, “Le Voleur”
and “Un Fou?” with K-means algorithm and the
corrected Rand index (figures 1, 3 and 5), un-
igrams give the best results. Moreover, power
transformations (equation 5) tend to improve
them. For instance, for the text “L’Orient” (figure
1), the best result is RC =0.048 with q =0.55,
and for the text “Un Fou?” (figure 5), the best
58
0.2 0.4 0.6 0.8 1.0
0.11 0.12 0.13 0.14 0.15 0.16 0.17
Power (q)
Jaccard Index
Figure 2: “L’Orient” with K-means algorithm: Jaccard
index as a function of power (q) (◦ = unigrams, =
bigrams and × = trigrams).
0.2 0.4 0.6 0.8 1.0
-0.05 0.00 0.05 0.10 0.15
Power (q)
Corrected Rand Index
Figure 3: “Le Voleur” with K-means algorithm: cor-
rected rand index as a function of power (q) (◦ = uni-
grams, = bigrams and × = trigrams).
0.2 0.4 0.6 0.8 1.0
0.14 0.16 0.18 0.20 0.22
Power (q)
Jaccard Index
Figure 4: “Le Voleur” with K-means algorithm: Jac-
card index as a function of power (q) (◦ = unigrams,
= bigrams and × = trigrams).
0.2 0.4 0.6 0.8 1.0
-0.02 0.00 0.02 0.04 0.06 0.08
Power (q)
Corrected Rand Index
Figure 5: “Un Fou?” with K-means algorithm: cor-
rected rand index as a function of power (q) (◦ = uni-
grams, = bigrams and × = trigrams).
59
0.2 0.4 0.6 0.8 1.0
0.11 0.12 0.13 0.14 0.15 0.16 0.17
Power (q)
Jaccard Index
Figure 6: “Un Fou?” with K-means algorithm: Jaccard
index as a function of power (q) (◦ = unigrams, =
bigrams and × = trigrams).
0.2 0.4 0.6 0.8 1.0
0.00 0.01 0.02 0.03 0.04 0.05
Power (q)
Corrected Rand Index
Figure 7: “Un Fou” with K-means algorithm: cor-
rected rand index as a function of power (q) (◦ = uni-
grams, = bigrams and × = trigrams).
result is RC =0.072 with q =0.85.
Regarding the fuzzy clustering algorithm, fig-
ure 9 shows, for the text “Le Voleur”, the relation
between the relative temperature and the num-
ber of groups for uni- bi- and trigrams, i.e. num-
ber of groups decreases when relative tempera-
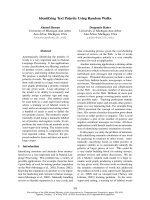
ture increases. Figure 10 (respectively figure 12)
presents the corrected Rand index (respectively
the Jaccard index) as a function of relative tem-
perature, while figure 11 (respectively figure 13)
shows, for each relative temperature, the average
number of groups on the x-axis and the average
0.2 0.4 0.6 0.8 1.0
0.12 0.14 0.16 0.18
Power (q)
Jaccard Index
Figure 8: “Un Fou” with K-means algorithm: Jaccard
index as a function of power (q) (◦ = unigrams, =
bigrams and × = trigrams).
0.05 0.10 0.15 0.20 0.25 0.30
0 20 40 60 80 100 120
Relative Temperature
Number of Groups
Unigrams
Bigrams
Trigrams
Figure 9: “Le Voleur” with fuzzy clustering algorithm:
average number of groups as a function of the relative
temperature. For unigrams, the thick line indicates the
average and the two thin lines represent the standard
deviation. The other curves depict the average of the
number of groups.
corrected Rand index (respectively Jaccard index)
on the y-axis, over 20 clusterings. There is a re-
markable peak for this text (RC =0.31 (respec-
tively J =0.48)), when t
rel
=0.145 (respectively
0.148), corresponding to M = 14.4 (respectively
13.4). The same phenomenon appears with the
text “Un Fou?”, when t
rel
=0.158 and M =7.8.
However, the peak for the Jaccard index is less
important and it is not the highest value. More-
60
0.05 0.10 0.15 0.20 0.25 0.30
0.00 0.05 0.10 0.15 0.20 0.25 0.30
Relative Temperature
Corrected Rand Index
Unigrams
Bigrams
Trigrams
Figure 10: “Le Voleur” with fuzzy clustering algo-
rithm: corrected Rand index as a function of relative
temperature.
0 20 40 60 80 100 120
0.00 0.05 0.10 0.15 0.20 0.25 0.30
Number of Groups
Corrected Rand Index
Unigrams
Bigrams
Trigrams
Figure 11: “Le Voleur” with fuzzy clustering algo-
rithm: corrected Rand index as a function of number
of groups.
over, for the latter text, there is a higher peak,
which occurs only with the corrected Rand index,
for t
rel
=0.126 and M = 24.5.
For the two other texts, there are some peaks,
but not as marked as in other texts. Besides,
for these two texts, corrected Rand index takes
negative values, especially for “Un Fou”. While
the reason for these different behaviours is not
known, it should be noted that the structure of
these texts is different from that of the two other
texts. Indeed, “Un Fou” is written as a diary and
uses mainly the present tense, also in narrative and
0.05 0.10 0.15 0.20 0.25 0.30
0.0 0.1 0.2 0.3 0.4 0.5
Relative Temperature
Jaccard Index
Unigrams
Bigrams
Trigrams
Figure 12: “Le Voleur” with fuzzy clustering algo-
rithm: Jacccard index as a function of relative tem-
perature.
0 20 40 60 80 100 120
0.0 0.1 0.2 0.3 0.4 0.5
Number of Groups
Corrected Rand Index
Unigrams
Bigrams
Trigrams
Figure 13: “Le Voleur” with fuzzy clustering algo-
rithm: Jaccard index as a function of number of
groups.
descriptive parts; “L’Orient” contains several long
monologues mainly using the present tense too.
On figure 12, it appears that Jaccard index is
constant when one group remains, and the same
phenomenon appears for all texts. Indeed, from
the distribution of table 2, one finds from equa-
tion 7: r = 8 939, u =0and v = 12 589, imply-
ing J =0.415.
Overall, it is clear that results differ depend-
ing on texts, no matter which algorithm or eval-
uation criterion is used. Furthermore, they are
always better for “Le Voleur” than for the three
61
arg descr dial expl inj nar
10 25 29 10 6 128
Table 2: Types distribution for the text “Le Voleur”.
other texts.
Finally, in most case, unigrams give better
results than bi- and tri-grams. The relatively
disappointing performance of bi- and trigrams
(w.r.t. unigrams) could be accounted for by the
sparsity of the feature space and the well-known
associated “curse of dimensionality”, in particular
in clustering (see e.g. Houle et al. (2010)). Results
are clearly different for “Un Fou”, and the reason
of this difference still needs to be investigated.
Certainly, as the sample is small and there is a
unique annotator, all these results must be consid-
ered with caution.
4 Conclusion and further development
A first conclusion is that the use of POS-tag n-
grams does not seem to improve the solution of
the problem exposed here. In contrast, high-
dimensional embedding seems to improve results.
Concerning evaluation criteria, results clearly
vary according to the selected index, which makes
it difficult to compare methods. Another point is
that even choosing only short stories of one au-
thor, text structures can be very different and cer-
tainly do not give the same results.
These results are interesting and in general bet-
ter than those found in a previous work (Cocco
et al., 2011), but this is still work in progress,
with much room for improvement. A next step
would be to combine fuzzy clustering with high-
dimensional embedding, which can both improve
results. Moreover, it could be interesting to add
typical linguistic markers, such as those men-
tioned in section 2.1, or stylistic features. It would
also be possible to use lemmas instead of or with
POS-tags, if more data could be added to the cor-
pus. Besides, Cordial Analyseur
3
could be used
instead of TreeTagger, because it provides more
fine-grained POS-tags. However, as for n-grams,
it could imply a sparsity of the feature space. An-
other idea would be to perform a supervised clas-
sification with cross-validation. In this case, it
3
/>Analyseur/Presentation_Cordial_
Analyseur.htm
would be interesting to investigate feature selec-
tion (see e.g. Yang and Pedersen (1997)). Also,
the hierarchical structure of texts (cf. section 2.1)
should be explored. Only the leaves were con-
sidered here, but in reality, one clause belongs to
several types depending on the hierarchical level
examined. Therefore, it could be relevant to con-
sider the dominant discourse type instead of the
leaf discourse type. Similarly, since in our cor-
pus, injunctive type is always included in dialo-
gal type, the former could be removed to obtain
a larger dialogal class. In addition, it would be
useful to find a better adapted measure of sim-
ilarity between partitions. Finally, an important
improvement would be to obtain more annotated
texts, which should improve results, and a second
human expert, which would permit us to assess
the difficulty of the task.
Acknowledgments
I would like to thank Franc¸ois Bavaud and Aris
Xanthos for helpful comments and useful discus-
sions; Guillaume Guex for his help with techni-
cal matters; and Rapha
¨
el Pittier for annotating the
gold standard.
References
Jean-Michel Adam. 2008a. La linguistique textuelle:
Introduction
`
a l’analyse textuelle des discours. Ar-
mand Colin, Paris, 2nd edition.
Jean-Michel Adam. 2008b. Les textes: types et proto-
types. Armand Colin, Paris, 2nd edition.
Franc¸ois Bavaud. 2009. Aggregation invariance in
general clustering approaches. Advances in Data
Analysis and Classification, 3(3):205–225.
Franc¸ois Bavaud. 2010. Euclidean distances, soft
and spectral clustering on weighted graphs. In
Jos
´
e Balc
´
azar, Francesco Bonchi, Aristides Gionis,
and Mich
`
ele Sebag, editors, Machine Learning and
Knowledge Discovery in Databases, volume 6321
of Lecture Notes in Computer Science, pages 103–
118. Springer, Berlin; Heidelberg.
Franc¸ois Bavaud. 2011. On the Schoenberg transfor-
mations in data analysis: Theory and illustrations.
Journal of Classification, 28(3):297–314.
Douglas Biber. 1988. Variation across Speech and
Writing. Cambridge University Press.
Jean-Paul Bronckart. 1996. Activit
´
e langagi
`
ere,
textes et discours: Pour un interactionisme socio-
discursif. Delachaux et Niestl
´
e, Lausanne; Paris.
Christelle Cocco, Rapha
¨
el Pittier, Franc¸ois Bavaud,
and Aris Xanthos. 2011. Segmentation and clus-
tering of textual sequences: a typological approach.
62
In Proceedings of the International Conference Re-
cent Advances in Natural Language Processing
2011, pages 427–433, Hissar, Bulgaria, September.
RANLP 2011 Organising Committee.
Guy de Maupassant. 1882. Le voleur. Gil Blas, June
21. />selva/maupassant/textes/voleur.
html. Thierry Selva. Accessed 2011, July 6.
Guy de Maupassant. 1883. L’orient. Le Gaulois,
September 13. />athena/selva/maupassant/textes/
orient.html. Thierry Selva. Accessed 2011,
March 5.
Guy de Maupassant. 1884. Un fou?. Le Figaro,
September 1. />athena/maupassant/maup_fou.html.
Thierry Selva. Accessed 2011, February 7.
Guy de Maupassant. 1885. Un fou. Le Gaulois,
September 2. />athena/selva/maupassant/textes/
unfou.html. Thierry Selva. Accessed 2011,
April 26.
Lucile Denœud and Alain Gu
´
enoche. 2006. Com-
parison of distance indices between partitions. In
Vladimir Batagelj, Hans-Hermann Bock, Anu
ˇ
ska
Ferligoj, and Ale
ˇ
s
ˇ
Ziberna, editors, Data Science
and Classification, Studies in Classification, Data
Analysis, and Knowledge Organization, pages 21–
28. Springer Berlin Heidelberg.
Michael Houle, Hans-Peter Kriegel, Peer Kr
¨
oger,
Erich Schubert, and Arthur Zimek. 2010.
Can shared-neighbor distances defeat the curse
of dimensionality? In Michael Gertz and
Bertram Lud
¨
ascher, editors, Scientific and Statisti-
cal Database Management, volume 6187 of Lec-
ture Notes in Computer Science, pages 482–500.
Springer, Berlin; Heidelberg.
Lawrence Hubert and Phipps Arabie. 1985. Compar-
ing partitions. Journal of Classification, 2(1):193–
218.
Jussi Karlgren and Douglass Cutting. 1994. Recog-
nizing text genres with simple metrics using dis-
criminant analysis. In Proceedings of the 15th con-
ference on Computational linguistics, volume 2 of
COLING ’94, pages 1071–1075, Stroudsburg, PA,
USA. Association for Computational Linguistics.
Denise Malrieu and Francois Rastier. 2001. Genres et
variations morphosyntaxiques. Traitement automa-
tique des langues, 42(2):547–577.
Christopher D. Manning and Hinrich Sch
¨
utze. 1999.
Foundations of Statistical Natural Language Pro-
cessing. The MIT Press, 1st edition, June.
Glenn W. Milligan and Martha C. Cooper. 1986. A
study of the comparability of external criteria for hi-
erarchical cluster analysis. Multivariate Behavioral
Research, 21(4):441–458.
Alexis Palmer, Elias Ponvert, Jason Baldridge, and
Carlota Smith. 2007. A sequencing model for sit-
uation entity classification. In Proceedings of the
45th Annual Meeting of the Association of Compu-
tational Linguistics, pages 896–903, Prague, Czech
Republic, June.
Kenneth Rose, Eitan Gurewitz, and Geoffrey C. Fox.
1990. Statistical mechanics and phase transitions
in clustering. Physical Review Letters, 65(8):945–
948.
Helmut Schmid. 1994. Probabilistic part-of-speech
tagging using decision trees. In Proceedings of the
International Conference on New Methods in Lan-
guage Processing, pages 44–49.
Carlota S. Smith. 2009. Modes of Discourse: The
Local Structure of Texts. Number 103 in Cambridge
studies in linguistics. Cambridge University Press,
Cambridge, UK, digitally printed version edition.
Yiming Yang and Jan O. Pedersen. 1997. A compara-
tive study on feature selection in text categorization.
In Proceedings of the 14th International Conference
on Machine Learning, pages 412–420.
Genane Youness and Gilbert Saporta. 2004. Une
M
´
ethodologie pour la Comparaison de Partitions.
Revue de Statistique Appliqu
´
ee, 52(1):97–120.
63