Báo cáo Y học: Thermodynamics and kinetics of the cleavage of DNA catalyzed by bleomycin A5 A microcalorimetric study pdf
Bạn đang xem bản rút gọn của tài liệu. Xem và tải ngay bản đầy đủ của tài liệu tại đây (393.33 KB, 9 trang )
Thermodynamics and kinetics of the cleavage of DNA catalyzed
by bleomycin A
5
A microcalorimetric study
Yi Liang
1
, Fen Du
1
, Bing-Rui Zhou
1
, Hui Zhou
1
, Guo-Lin Zou
1
, Cun-Xin Wang
2
and Song-Sheng Qu
2
1
College of Life Sciences and
2
College of Chemistry and Molecular Science, Wuhan University, China
Microcalorimetry and UV-vis spectroscopy were used to
conduct thermodynamic and kinetic investigations of the
scission of calf thymus DNA catalyzed by bleomycin A
5
(BLM-A
5
) in the presence of ferrous ion and oxygen. The
molar reaction enthalpy for the cleavage, the Michaelis–
Menten constant for calf thymus DNA and the turnover
number of BLM-A
5
were calculated by a novel thermoki-
netic method for an enzyme-catalyzed reaction to be
)577 ± 19 kJÆmol
)1
, 20.4 ± 3.8 l
M
and 2.28 ± 0.49 ·
10
)2
s
)1
, respectively, at 37.0 °C. This DNA cleavage was a
largely exothermic reaction. The catalytic efficiency of BLM-
A
5
is of the same order of magnitude as that of lysozyme but
several orders of magnitude lower than those of TaqI
restriction endonuclease, NaeI endonuclease and BamHI
endonuclease. By comparing the molar enthalpy change for
the cleavage of calf thymus DNA induced by BLM-A
5
with
those for the scission of calf thymus DNA mediated by
adriamycin and by (1,10-phenanthroline)-copper, it was
found that BLM-A
5
possessed the highest DNA cleavage
efficiency among these DNA-damaging agents. These results
suggest that BLM-A
5
is not as efficient as a DNA-cleaving
enzyme although the cleavage of DNA by BLM-A
5
follows
Michaelis–Menten kinetics. Binding of BLM-A
5
to calf
thymus DNA is driven by a favorable entropy increase with
a less favorable enthalpy decrease, in line with a partial
intercalation mode involved in BLM-catalyzed breakage of
DNA.
Keywords: bleomycin; DNA cleavage; kinetics; microcalor-
imetry; thermodynamics.
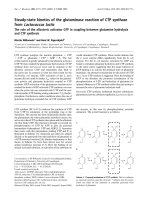
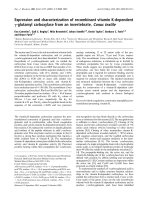
The bleomycins (BLMs, Fig. 1) are a family of naturally
occurring, structurally related, glycopeptide-derived antitu-
mor antibiotics discovered by Umezawa and coworkers
from cultures of Streptomyces verticillus in 1966 [1], which
have more than 200 members, such as A
2
,A
5
and B
2
[2].
BLMs consist of an unusual linear hexapeptide, a disac-
charide and a terminal amine (the R group in Fig. 1).
Mixtures of BLMs are presently used for the clinical
treatment of a variety of cancers, notably squamous cell
carcinomas, testicular tumors and nonHodgkin’s lym-
phoma [2]. The therapeutic effect of BLM is believed to
result from its ability to induce single- and double-strand
breakage of DNA molecules by oxidation of the deoxyri-
bose moiety in the presence of oxygen and a redox-active
metal ion, e.g. Fe and Co [2–6]. On the other hand, RNA is
also considered as a therapeutically relevant target for BLM
[7,8]. It has been found that BLM-induced autoxidation of
ferrous iron follows the Michaelis–Menten kinetics [9,10].
Although a significant number of experimental approaches
havebeenusedtoelucidatethemechanismofDNA
cleavage by BLM in the past two decades [2–6,11–20],
thermodynamic information for the scission, which is
necessary for a thorough understanding of the mechanism,
is eagerly awaited. The purpose of this investigation is to
provide detailed thermodynamic and kinetic data for BLM-
mediated DNA degradation to furnish insights into the
anticancer mechanism of BLM.
Microcalorimetry is an important tool for the study of
both thermodynamic and kinetic properties of biological
macromolecules by virtue of its general applicability, high
accuracy and precision [21–24]. Recently, this method has
yielded a large amount of data on the binding reactions of
DNA with DNA-targeting molecules, such as adriamycin
(ADM) [25], daunomycin [25,26], Hoechst 33258 [27],
ethidium bromide [28], 2,7-diazapyrene [29] and dodecyl
trimethylammonium bromide [30]. Only a limited number
of authors have, however, paid attention to the energetics of
drug-induced cleavage of DNA [31].
In a previous publication from this laboratory [31],
microcalorimetry and agarose gel electrophoresis were
applied to check the oxidative degradation of DNA induced
by (1,10-phenanthroline)-copper, a well-known DNA-dam-
aging agent [32]. In the present paper, microcalorimetry and
UV-vis spectroscopy were combined to study the scission of
calf thymus DNA by a mixture of bleomycin A
5
(BLM-A
5
),
ferrous iron and oxygen. A novel thermokinetic method for
an enzyme-catalyzed reaction was proposed and employed
to produce not only the thermodynamic constant (D
r
H
m
)
but also the kinetic properties (K
m
and k
2
) of the cleavage of
DNA catalyzed by BLM-A
5
with the result that BLM-A
5
is
not as efficient as a DNA-cleaving enzyme. In order to gain
insights into the nucleotide binding interactions of BLM, we
Correspondence to Y. Liang, College of Life Sciences,
Wuhan University, Wuhan, 430072, China.
Fax: + 86 27 8788 2661, Tel.: + 86 27 8721 4902,
E-mail:
Abbreviations: ADM, adriamycin; BLM, bleomycin; BLM-A
2
,
bleomycin A
2
; BLM-A
5
, bleomycin A
5
; BLM-B
2
, bleomycin B
2
;BR,
batch reactor; ME, 2-mercaptoethanol; OP, 1,10-phenanthroline;
Vc, vitamin C; UV-vis, ultraviolet and visible.
(Received 17 December 2001, revised 12 April 2002,
accepted 22 April 2002)
Eur. J. Biochem. 269, 2851–2859 (2002) Ó FEBS 2002 doi:10.1046/j.1432-1033.2002.02948.x
have elucidated the binding constant (K
B
) and the standard
thermodynamic parameters (D
b
H
0
m
,D
b
G
0
m
and D
b
S
0
m
)for
the binding of BLM-A
5
to calf thymus DNA using
microcalorimetry. The results help understand the binding
mode of BLM-A
5
to DNA.
MATERIALS AND METHODS
Materials
Calf thymus DNA (Sigma Chemical Co., MI, USA) was
purified by ethanol precipitation and centrifugal dialysis and
sheared by sonication at ice bath temperatures for 30 min.
The absorbances at 260 and 280 nm for purified DNA were
measured at room temperature. DNA concentrations were
determined spectroscopically at 260 nm using a molar
extinction coefficient of 13 200
M
)1
Æcm
)1
and expressed as
base pair concentrations throughout this paper. The con-
centration of BLM-A
5
(Hebei Pharmaceutical Factory,
Tianjin, China) was determined at 291 nm using a molar
extinction coefficient of 15 500
M
)1
Æcm
)1
and the concen-
tration of ADM (Haimen Pharmaceutical Factory,
Zhejiang, China) was determined at 480 nm using a molar
extinction coefficient of 11 500
M
)1
Æcm
)1
.FeCl
2
Æ4H
2
O
(analytical grade) was purchased from Merck’s reagent
Co., Germany. Other chemicals used were made in China
and of analytical grade. All reagent solutions were prepared
in 10 m
M
Tris/HCl buffer (pH ¼ 7.4). As the FeCl
2
solution is easily oxidized by oxygen, it was placed in a
brown bottle and then flushed with purified nitrogen for
10 min, sealed and stored in a refrigerator until use.
Moreover, it was freshly prepared on each occasion.
Isothermal microcalorimetry
The cleavage of calf thymus DNA by a mixture of BLM-A
5
,
ferrous ion and oxygen and the binding of BLM-A
5
to calf
thymus DNA, were studied in 10 m
M
Tris/HCl buffer at
pH 7.4 and 37.0 °C. The heat effects of the reactions
mentioned above were determined using a LKB-2107 batch
microcalorimeter (Stockholm, Sweden), which consists of a
microbatch reactor with a heat-conduction isothermal
calorimeter [31,33–35]. For the experiments on DNA
cleavage, compartment I of the reaction cell contained
2mL of a FeCl
2
solution and compartment II of the
reaction cell contained 4 mL of a DNA/BLM-O
2
mixture.
This multicomponent system was prepared by mixing DNA
and BLM-A
5
solutions and saturated with purified oxygen
before calorimetric experiments. To avoid the re-oxidation
of FeCl
2
solution on exposure to air, purified N
2
was passed
into one compartment of the cell while sample was added to
the other. As soon as samples were added, the source of N
2
was removed and the plug for the reaction cell was closed
tightly. The same procedure was used for adding samples to
the reference cell. To avoid the influence of the heat effects
of diluting and mixing, etc. on the results, the contents and
quantities in both cells were as close as possible except that
DNA was not added to the reference cell. For the
experiments on DNA binding, compartment I of the
reaction cell contained 2 mL of a DNA solution and
compartment II of the reaction cell contained 4 mL of a
BLM-A
5
solution. The heat released by dilution of DNA is
negligible.
UV-vis spectroscopy
UV and visible spectra were measured using a Shimadzu
UV-2401PC spectrophotometer. A reaction system contain-
ing 21.5 l
M
BLM-A
5
,20l
M
ferrous iron and 15.2 l
M
calf
thymus DNA was saturated with purified oxygen and
incubated in 50 m
M
Tris/HCl buffer at pH 7.4 and 20 °C
for 30 min and then scanned from 250 to 500 nm. Five
control systems were chosen to investigate the effect of
DNA cleavage by BLM-A
5
on the spectrum of BLM-A
5
.
The first one was 21.5 l
M
BLM-A
5
, the second was a
mixture containing 21.5 l
M
BLM-A
5
and 20.0 l
M
ferric
iron, and the third was a mixture containing 21.5 l
M
BLM-
A
5
and 20.0 l
M
ferrous iron saturated with purified
nitrogen. The fourth was a solution containing 21.5 l
M
BLM-A
5
,20l
M
ferric iron and 15.2 l
M
calf thymus DNA
and the fifth was 15.2 l
M
calf thymus DNA. These solutions
were also incubated in 50 m
M
Tris/HCl buffer at pH 7.4
and 20 °C for 30 min and then scanned from 250 to 500 nm.
RESULTS
Novel thermokinetic models for enzyme-catalyzed
reactions
For a simple single-substrate, single-intermediate, enzyme-
catalyzed reaction occurring in a batch reactor (BR) with
negligible mass-transfer limitations and without self-inacti-
vation of the enzyme, from the Michaelis–Menten kinetics,
it follows that
À
1
t
lnð1 À xÞ¼
k
2
½E
0
K
m
À
½S
0
K
m
x
t
ð1Þ
where t is the reaction time, x the fraction of substrate
converted into product at time t, which is nondimensional,
K
m
the Michaelis constant, [S]
0
and [E]
0
the initial concen-
trations of substrate and enzyme, respectively, and k
2
,also
known as the turnover number of the enzyme [36], the rate
constant of breakdown of the enzyme–substrate complex to
product.
Fig. 1. Structure of BLM-A
2
,A
5
and B
2
.
2852 Y. Liang et al. (Eur. J. Biochem. 269) Ó FEBS 2002
Under certain conditions, the rate of self-inactivation of
an enzyme may be sufficiently great that it must be taken
into account in the study of the kinetics of the reaction
undergoing catalysis [37]. The self-inactivation reactions are
sometimes, although not always, of first order kinetics. Even
when first order inactivation is taken into account, other
kinetics schemes, such as the second- or zero-order self-
inactivation, can be accounted for, according to Laidler &
Bunting [37]. In the present paper, attention will be confined
to first-order self-inactivation, but the methods are readily
extended to other cases.
For a single-substrate enzyme-catalyzed reaction occur-
ring in a BR with the first-order self-inactivation of the
enzyme, the general rate equation is
À
d½S
dt
¼
k
2
½E½S
K
m
þ½S
ð2Þ
where [S] and [E] are the concentration of substrate and the
total concentration of active enzyme at time t, respectively.
The decay law for the first-order self-inactivation is
½E¼½E
0
e
Àk
1
t
ð3Þ
where k
1
is the first-order rate constant for self-inactivation
of the enzyme.
Substituting Eqn (3) in Eqn (2) and performing the
integration between limits [S]
0
to [S] and 0 to t,weobtain
x À
K
m
½S
0
lnð1 À xÞ¼
k
2
½E
0
k
1
½S
0
ð1 À e
Àk
1
t
Þð4Þ
If the heat-transfer process in a BR obeys Tian’s equation
[21,33–35], the substrate conversion in a BR may be written
as
x ¼ðD þ kaÞ=kA ð5Þ
Here, D is the calorimetric height at time t (i.e. the
thermopile potential difference at times t and 0), a is
the area under the calorimetric curve and the time-axis over
the interval (t–0), A is the total area under the calorimetric
curve and k is the Newton cooling constant of the
calorimeter system which can be easily determined by
electric calibration [34].
According to the thermo-analytical analog curve method
[38], the calorimetric curve for a reaction occurring in a
conduction calorimeter can be approximately simulated by
the following relationship:
D ¼ ate
Àkbt
ð6Þ
At t ¼ t
m
,dD/dt ¼ 0andD ¼ D
m
, substituting in Eqn (3),
we get:
a ¼ eD
m
=t
m
ð7Þ
b ¼ 1=kt
m
ð8Þ
where a and b are the analog parameters related to the
thermokinetic system, D
m
and t
m
are the calorimetric curve
characteristic data representing the maximum calorimetric
height and time corresponding to D
m
, respectively. For a
fast reaction, the value of b turns out to be 1. For a slow
reaction, however, the value of b is 2/3 [38].
Combining Eqns (6), (7) and (8), we get
D ¼
t
t
m
D
m
e
1Àt=t
m
ð9Þ
k ¼ eD
m
=ðbAÞð10Þ
Substituting Eqn (10) in Eqn (5), we obtain
x ¼
a
A
þ
bD
eD
m
ð11Þ
When a single-substrate enzyme-catalyzed reaction is taking
place in a conduction calorimeter, the molar reaction
enthalpy is:
D
r
H
m
¼ Q
1;1
=ðV
T
Á½S
0
Þð12Þ
Here, Q
1,1
is the total heat effect of the reaction, which
can be calculated by the integration type of Tian’s
equation from the experimental calorimetric curves. V
T
is
the total volume of the reacting system, 6 mL in the present
case.
Eqns (1), (11) and (12) are called the analog calorimetric
curve model of a single-substrate enzyme-catalyzed reaction
without taking self-inactivation of the enzyme into account.
It is a novel application of the thermo-analytical analog
curve method and suitable to both fast and slow enzyme-
catalyzed reactions. A plot of –ln(1 ) x)/t against x/t
is linear with an axis intercept of k
2
[E]
0
/K
m
and a slope of
–[S]
0
/K
m
. The values of K
m
and k
2
can be calculated from
the slope and intercept, respectively, using the calorimetric
data from only a single experiment.
Eqns (4) and (11) are called the analog calorimetric curve
model of a single-substrate enzyme-catalyzed reaction with
the first-order self-inactivation of the enzyme. The values of
K
m
, k
2
and k
1
were obtained from the equations by
substituting in at least three sets of experimental data (x and
t) and using the
MATHSOFT MATHCAD
software (version
2001). The value of s, the lifetime of self-inactivation, was
calculated using the rate constant k
1
.
A thermodynamic model for the binding of small
molecules to DNA
Understanding the thermodynamics of the binding of
small molecules to DNA is of practical interest, because
many small molecules that bind to DNA are effective
pharmaceutical agents, especially in cancer chemotherapy
[25].
From these experiments, it is found that the interactions
of DNA with many small molecules, such as BLM and
ADM, are at rapid equilibrium:
DNA þ L Ð DNA Á L ð13Þ
where L is a small molecule that binds to DNA and DNAÆL
the complex between DNA and L. The intrinsic binding
constant, K
B
, is defined by the equation [24,28,29]:
K
B
¼
y
ð1 À yÞð½DNA
0
À ny½L
0
Þ
ð14Þ
Here, [DNA]
0
and [L]
0
are the initial concentrations of
DNA and L, respectively, n is the exclusion parameter
which presents the number of base pairs covered by each L.
Ó FEBS 2002 Thermokinetics of DNA cleavage catalyzed by BLM-A
5
(Eur. J. Biochem. 269) 2853
The degree of L binding to DNA, y, can be determined by
the formula:
y ¼ D
b
H
m;a
=D
b
H
0
m
ð15Þ
where D
b
H
0
m
is the standard binding enthalpy per mole of L
and D
b
H
m,a
is the apparent molar binding enthalpy which
can be calculated using the equation:
D
b
H
m;a
¼ Q
2;1
=ð½L
0
Á V
TÞ
ð16Þ
Here Q
2,1
is the total heat effect of L binding to DNA,
which can be calculated by the integration type of Tian’s
equation from the experimental calorimetric curves.
The molar ratio, r, of DNA to L is defined as
r ¼ n
DNA;0
=n
L;0
¼½DNA
0
=½L
0
ð17Þ
where n
DNA,0
and n
L,0
are the initial amounts of DNA and
L, respectively. Substituting Eqns (15) and (17) into
Eqn (14), we get
r ¼
½DNA
0
K
B
nD
b
H
m;a
ðD
b
H
0
m
À D
b
H
m;a
Þ
½DNA
0
K
B
ðD
b
H
0
m
Þ
2
Àð½DNA
0
K
B
þ 1ÞD
b
H
m;a
D
b
H
0
m
ð18Þ
This thermodynamic model was used to perform a
nonlinear least-squares analysis of the apparent molar
binding enthalpy, D
b
H
m,a
, as an explicit function of the
molar ratio r using the
MICROCAL ORIGIN
software
(ver. 6.0) and the values for three unknown binding
parameters, K
B
, D
b
H
0
m
and n, were thus obtained. The v
2
test was used to examine the appropriateness of the model
statistically.
The standard molar binding free energy (D
b
G
0
m
)andthe
standard molar binding entropy (D
b
S
0
m
) for the binding
reaction were calculated by the fundamental equations of
thermodynamics [28]:
D
b
G
0
m
¼ÀRT Á ln K
B
ð19Þ
D
b
S
0
m
¼ðD
b
H
0
m
À D
b
G
0
m
Þ=T ð20Þ
Thermodynamics and kinetics of the cleavage
of DNA catalyzed by BLM-A
5
From the spectroscopic results, the ratio of the absorbance
at 260 nm to that at 280 nm for purified DNA used in the
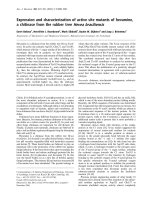
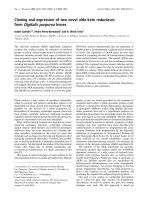
present study is about 2.07. As shown in Fig. 2, the
calorimetric curve for the cleavage of calf thymus DNA by a
mixture of BLM-A
5
,Fe
2+
and O
2
returned to the baseline
within 10 min, under the experimental conditions used. The
experimental calorimetric curve can be reasonably well
fitted by the simulated analog calorimetric curve between 75
and 210 s at 37.0 °C. The substrate conversion x at time t in
one experiment on the DNA cleavage by BLM-A
5
can be
calculated using Eqn (11) from the calorimetric data shown
in Fig. 2. A plot of –ln(1 ) x)/t against x/t in this range is
linear with the value of y-axis intercept being
1.323 · 10
)2
s
)1
, the value of slope being )0.7342 and the
linear correlation coefficient being )0.9967. Then, the values
of K
m
and k
2
can be calculated from the slope and intercept
to be 23.6 l
M
and 2.90 · 10
)2
s
)1
, respectively. After the
calorimetric experiment on DNA cleavage, the residual
solutions taken from both the reaction cell and the reference
one were brownish yellow.
Tables 1 and 2 summarize the molar reaction enthalpies
and the kinetic parameters for the cleavage of calf thymus
DNA by a mixture of BLM-A
5
,Fe
2+
and O
2
at different
DNA concentrations and at 37.0 °C obtained from the
analog calorimetric curve models of a single-substrate
enzyme-catalyzed reaction without taking self-inactivation
of BLM-A
5
into account and with the first-order self-
inactivation of BLM-A
5
. It should be pointed out that Fe
2+
is used in about 30-fold molar excess relative to BLM
despite the fact that only 2.28 turnovers (presumably
corresponding to DNA cleavage events) per 100 second
are observed (Table 1). From Fig. 2 and Table 1, it can also
be seen that this DNA cleavage was a largely exothermic
reaction and followed Michaelis–Menten kinetics. Thus, the
observed rate law for the cleavage of DNA catalyzed by
BLM-A
5
at excessive ferrous ion and oxygen concentrations
can be expressed as
t
0
¼
k
2
½BLM
0
½DNA
0
K
m
þ½DNA
0
ð21Þ
Here t
0
is the initial rate for the DNA cleavage by BLM-A
5
.
It should be pointed out that the fact that a reaction can be
simulated using the Michaelis–Menten theory kinetics does
not per se imply that a reaction is enzymatic.
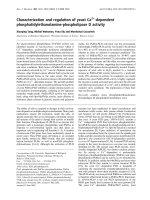
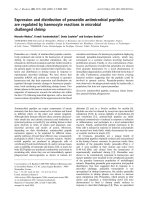
UV-vis spectra of BLM-A
5
Figure 3A compares the UV and visible spectrum from 250
to 500 nm of BLM-A
5
after the cleavage of calf thymus
DNA by a mixture of BLM-A
5
,Fe
2+
and O
2
with those of
the five control systems mentioned in the ÔMaterials and
methodsÕ and Fig. 3B shows those between 350 and
500 nm. It can be seen from Fig. 3A that the large
underlying peak at 291 nm for BLM, which has been
ascribed to the bithiazole p) p*andn ) p* transitions [19],
does not shift after this scission, provided that the absorb-
ance for calf thymus DNA has been subtracted from the
total absorbance for the reaction system after the cleavage.
Fig. 2. Experimental calorimetric curve (a) and the corresponding
simulated analog calorimetric curve (b) of the scission of calf thymus
DNA by a mixture of BLM-A
5
,Fe
2+
and O
2
at 37.0 °C. For curve b,
D ¼ 0.03653 te
1–t/150
and b ¼ 1. The initial concentrations of calf
thymus DNA, BLM-A
5
,Fe
2+
and O
2
are 17.3, 10.8, 340 and 650 l
M
,
respectively.
2854 Y. Liang et al. (Eur. J. Biochem. 269) Ó FEBS 2002
This result indicates that the absorbing group is unchanged
after this scission. The flat peak at 384 nm for curves a and c
in Fig. 3B may result from charge transfer transitions
between ferric iron and BLM-A
5
. The reason why we do not
observe the charge transfer band in curve e is unknown.
Thermodynamics of the binding of BLM-A
5
to DNA
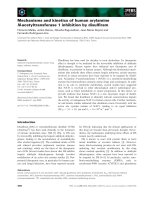
Figure 4 shows two of the calorimetric curves of BLM-A
5
binding to calf thymus DNA at different molar ratios of
DNA/BLM-A
5
. The experimental apparent molar enthalpy
changes for these reactions can be calculated using the
integration type of Tian’s equation and Eqn (16) from the
calorimetric curves. The thermodynamic data for the bind-
ing, in which the values of K
B
, D
b
H
0
m
and n are obtained by
fitting the apparent molar enthalpy changes to Eqn (18), are
summarized in Table 3. The v
2
value of Eqn (18) used to
perform a nonlinear least-squares analysis for the binding of
BLM-A
5
to DNA is 0.0268, indicating a good appropriate-
ness of the model proposed. The remaining standard
thermodynamic parameters for the binding, D
b
G
0
m
and
D
b
S
0
m
, are calculated by Eqns (19) and (20), respectively.
Thermodynamics of the binding of ADM
and (1,10-phenanthroline)-copper to DNA
To establish the action mode of BLM-A
5
to DNA, we
investigated the energetics for both the binding reactions of
ADM and (1,10-phenanthroline)-copper to calf thymus
DNA and found that their thermodynamic binding param-
eters were different from those of BLM-A
5
.ADMisan
intercalator, which inserts its aromatic ring between
adjacent base pairs of DNA [25,39] and (1,10-phenanthro-
Table 2. Comparison of the kinetic parameters for BLM-A
5
without
taking its self-inactivation into account and those for BLM-A
5
with first-
order self-inactivation. The kinetic data were obtained from the analog
calorimetric curve models of a single-substrate enzyme-catalyzed
reaction without taking self-inactivation of BLM-A
5
into account and
with the first-order self-inactivation of BLM-A
5
.
Inactivation type of BLM-A
5
K
m
(l
M
)
k
2
· 10
2
(s
)1
) s (s)
Non-self-inactivation 20.4 2.28
First-order self-inactivation 4.22 1.70 188
Table 1. Thermodynamic and kinetic data of the cleavage of calf thymus DNA by a mixture of BLM-A
5
,Fe
2+
and O
2
at 37.0 °C. The
thermodynamic and kinetic data were obtained from the analog calorimetric curve model of a single-substrate enzyme-catalyzed reaction without
taking self-inactivation of BLM-A
5
into account. The molar enthalpy change for the reaction of BLM-A
5
,Fe
2+
and O
2
has been determined by
microcalorimetry to be )34.4±3.2kJÆmol
)1
. Data are expressed as mean ± SD (n ¼ 8). Here, [BLM-A
5
]
0
¼ 10.8 l
M
and R is the correlation
coefficient of –ln(1 ) x)/t correlating with x/t.
No.
[DNA]
0
(l
M
)
[FeCl
2
]
0
(m
M
)
[O
2
]
0
(m
M
)
–Q
1,1
(mJ) R
b
–D
r
H
m
(kJÆmol
)1
)
K
m
(l
M
)
k
2
· 10
2
(s
)1
)
1 3.47 0.34 0.66 12.00 ) 0.9916 577 24.1 1.77
6.93 0.34 0.66 25.23 ) 0.9968 607 21.9 1.83
2 6.93 0.68 0.66 23.28 ) 0.9931 560 15.7 1.75
17.3 0.34 0.65 59.65 ) 0.9967 574 23.6 2.90
3 17.3 0.34 0.65 62.62 ) 0.9912 602 23.3 2.21
17.3 0.68 0.65 59.50 ) 0.9970 572 14.8 2.30
4 34.7 0.34 0.65 115.5 ) 0.9957 556 22.4 2.49
34.7 0.68 0.65 117.3 ) 0.9989 564
577 ± 19
17.0
20.4 ± 3.8
2.98
2.28 ± 0.49
Fig. 3. A comparison of the UV and visible spectrum of BLM-A
5
after
the cleavage of calf thymus DNA by a mixture of BLM-A
5
,Fe
2+
and O
2
with those of five control systems. (a) A reaction system containing
21.5 l
M
BLM-A
5
,20l
M
Fe
2+
and 15.2 l
M
calf thymus DNA sat-
urated with purified oxygen, after incubation in 50 m
M
Tris/HCl buffer
at pH 7.4 and 20 °C for 30 min. (b) 21.5 l
M
BLM-A
5
.(c)Asolution
containing 21.5 l
M
BLM-A
5
and 20 l
M
Fe
3+
. (d) A mixture con-
taining 21.5 l
M
BLM-A
5
and 20 l
M
Fe
2+
saturated with purified
nitrogen. (e) A mixture containing 21.5 l
M
BLM-A
5
,20l
M
Fe
3+
and
15.2 l
M
calf thymus DNA. (f ) 15.2 l
M
calf thymus DNA. (A) shows
the optical spectra between 250 and 550 nm and (B) displays those
between 350 and 500 nm.
Ó FEBS 2002 Thermokinetics of DNA cleavage catalyzed by BLM-A
5
(Eur. J. Biochem. 269) 2855
line)-copper binds to either the major or minor groove of the
double helix [32]. The thermodynamic data for these
binding reactions at 37.0 °C are listed in Table 3. The solid
lines in Fig. 5B,C are the predicted apparent molar enthalpy
changes for these binding reactions as calculated using
Eqn (18) and the parameters in Table 3 and in agreement
with the experimental data. The v
2
value of Eqn (18) used to
perform a nonlinear least-squares analysis for the binding of
ADM and (1,10-phenanthroline)-copper to DNA are 4.05
and 0.0139, respectively, indicating that the thermodynamic
model for the binding of small molecules to DNA proposed
in this paper, is reasonable.
DISCUSSION
DNA cleavage efficiency of BLM-A
5
In Table 4, we compared the molar enthalpy change for the
cleavage of calf thymus DNA induced by BLM-A
5
with
those for the scission of calf thymus DNA mediated by two
well-known DNA-damaging agents, ADM [39,40] and
(1,10-phenanthroline)-copper [31,32]. Scission of calf thy-
mus DNA induced by BLM in the presence of Fe
2+
and O
2
,
converted calf thymus DNA to free nucleic bases [2,5,13,14].
From electrophoresis experiments, it was found that nicking
of pBR-322 DNA by a mixture of ADM, Fe
3+
,VcandO
2
and by a mixture of (1,10-phenanthroline)-copper(II), ME
and O
2
converted pBR-322 DNA to small DNA fragments
[39] and linear DNA [31], respectively. As is seen in Table 4,
the higher the degree of DNA strand scission by drugs, the
larger the molar enthalpy change for the DNA cleavage.
Fig. 4. Calorimetric curves of BLM-A
5
binding to calf thymus DNA.
The initial concentration of calf thymus DNA is 139 l
M
and the initial
concentrations of BLM-A
5
are (a) 43.0 l
M
and (b) 86.0 l
M
,respect-
ively. The experimental temperature is 37.0 °C.
Table 3. Thermodynamic parameters for the binding reactions of three antitumor drugs, BLM-A
5
, ADM and (1,10-phenanthroline)-copper, to calf
thymus DNA at 37.0 °C. These binding reactions were carried out as described in the legend to Fig. 5. Thermodynamic parameters were determined
using the thermodynamic model for the binding of small molecules to DNA in the results section. Data are expressed as mean ± SD.
Drug
K
B
· 10
)4
(
M
)1
)
n
(base pairs/drug)
D
b
H
0
m
(kJÆmol
)1
)
D
b
G
0
m
(kJÆmol
)1
)
D
b
S
0
m
(JÆmol
)1
ÆK
)1
) Action mode
BLM-A
5
4.19 ± 0.94 5.31 ± 0.12 ) 10.2 ± 0.4 ) 27.4 ± 0.6 55.5 ± 3.2 Partial intercalation
ADM 10.9 ± 1.6 4.83 ± 0.92 ) 46.3 ± 0.9 ) 29.9 ± 0.4 ) 52.9 ± 4.2 Intercalation
(OP)
2
Cu
2+
21.6 ± 5.7 3.07 ± 0.10 16.3 ± 0.2 ) 31.7 ± 0.7 155 ± 3 Groove binding
Fig. 5. Apparent molar enthalpy changes for the binding reactions of (A)
BLM-A
5
(B) ADM and (C) (OP)
2
Cu
2+
, to calf thymus DNA at
37.0 °C. The initial concentrations of calf thymus DNA are 139 l
M
(A,C) and 136 l
M
(B). Empty circles, experimental data; solid lines,
curves predicted by Eqn (18) using the parameters in Table 3.
2856 Y. Liang et al. (Eur. J. Biochem. 269) Ó FEBS 2002
BLM-A
5
possessed the highest DNA cleavage efficiency
among these DNA-damaging agents.
BLM-A
5
is not as efficient as a DNA-cleaving enzyme
BLM has three functional domains (Fig. 1). The metal
binding domain is required for metal complexation, oxygen
binding and activation [6] and corresponds to the catalytic
site of DNA-cleaving enzymes, e.g. EcoRI endonuclease
[15]. The DNA binding domain, encompassing the bithiaz-
ole moiety, can be regarded as the substrate binding site [15].
The carbohydrate moiety is involved in cell permeability
and selective tumor recognition [6]. Although BLM is much
smaller than ÔrealÕ DNA-cleaving enzymes, it is comparable,
both in size and in domains, to the cleft of the active site of
such type of enzymes, e.g. EcoRI endonuclease [15].
Table 5 compares the kinetic parameters for BLM-A
5
with those for carbonic anhydrase [41], lysozyme [41], TaqI
restriction endonuclease [42], NaeI endonuclease [43],
BamHI endonuclease [11], blenoxane [11] and BLM-A
2
[12]. As shown in Table 5, the catalytic efficiency (repre-
sented by k
2
/K
m
)ofBLM-A
5
isofthesameorderof
magnitude as that of lysozyme but several orders of
magnitude lower than those of TaqI restriction endonuc-
lease, NaeI endonuclease and BamHI endonuclease. As can
also be seen from Table 5, the cleavage efficiencies (repre-
sented by k
2
; [11]) of BLM-A
5
and of some DNA-cleaving
enzymes, such as TaqI restriction endonuclease, NaeI
endonuclease and BamHI endonuclease, are of the same
order of magnitude but one order of magnitude higher than
those of blenoxane and BLM-A
2
. The catalytic efficiency is
a much better measure for the efficiency of an enzyme than
k
2
(in this case the cleavage efficiency). Therefore, BLM-A
5
is not as efficient as a DNA-cleaving enzyme although the
cleavage of DNA by BLM-A
5
follows Michaelis–Menten
kinetics. The cleavage of calf thymus DNA by a mixture of
ADM, Fe
3+
,VcandO
2
and by a mixture of (1,10-
phenanthroline)-copper(II), ME and O
2
do not, however,
follow the Michaelis–Menten kinetics (data not shown),
suggesting that ADM and (1,10-phenanthroline)-copper are
unlike DNA-cleaving enzymes.
Mode of binding BLM-A
5
to DNA
As shown in Table 3, the binding of ADM to calf thymus
DNA is driven entirely by a large favorable enthalpy
reduction but with an unfavorable entropy decrease. In
contrast, the binding of (1,10-phenanthroline)-copper to calf
thymus DNA shows just an opposite thermodynamics of
the reaction driven by a large favorable increase in entropy
with an unfavorable raise in enthalpy. Meanwhile, the
binding of BLM-A
5
to calf thymus DNA seems to be driven
by a favorable entropy change with a less favorable enthalpy
change. These results indicate that the thermodynamic
binding behavior of BLM-A
5
ranges between those of ADM
and (1,10-phenanthroline)-copper and are in line with a
partial intercalation mode involved in BLM-catalyzed
breakage of DNA [44,45]. The partial intercalation given
here is a threading intercalation mode [6,44,45] in which the
bithiazole moiety is partially intercalated between DNA
base pairs and the C-terminal substituent has been threaded
through the helix to the major groove. The partial interca-
lation of BLM induces the relaxation of supercoiled DNA
[4], resulting in a moderately favorable increase in entropy.
About the self-inactivation of activated BLM
Both Fe
2+
and O
2
serve as cofactors in DNA cleavage by
BLM [2–6]. When ferrous BLM is exposed to O
2
,atransient
complex of drug, iron and oxygen, which is kinetically
competent to initiate DNA degradation and commonly
termed activated BLM, is formed [2,4,5,13,14,16,18,46].
Table 4. Comparison of the molar enthalpy change for the cleavage of calf thymus DNA induced by BLM-A
5
and those for the scission of calf thymus
DNA mediated by two DNA-damaging agents, ADM and (1,10-phenanthroline)-copper. Data are expressed as mean ± SD (n ¼ 5–8).
Cleavage system D
r
H
m
(kJÆmol
)1
) Product Reference
BLM-A
5
-Fe
2+
-O
2
a
)577 ± 20 Free nucleic bases This work, [2,5,13,14]
ADM-Fe
3+
-Vc-O
2
b
)147.1 ± 6.1 Small DNA fragments This work, [39]
(OP)
2
Cu
2+
-ME-O
2
c
)35.1 ± 1.8 Linear DNA [31]
a
T ¼ 37.0 °C, pH ¼ 7.4.
b
T ¼ 25.0 °C, pH ¼ 7.4, [ADM]
0
¼ 5.75 l
M
, [FeCl
2
]
0
¼ 340 l
M
, [Vc]
0
¼ 650 l
M
and oxygen was in excess.
c
T ¼ 37.0 °C, pH ¼ 7.0.
Table 5. Comparison of the kinetic parameters for BLM-A
5
and those for carbonic anhydrase, lysozyme, TaqI restriction endonuclease, NaeI
endonuclease, BamHI endonuclease, blenoxane and BLM-A
2
. Here, NAG is N-acetylglucosamine.
Enzyme Substrate K
m
(
M
) k
2
(s
)1
) k
2
/K
m
(
M
)1
Æs
)1
) Reference
Carbonic anhydrase HCO
3
–
9.6 · 10
)3
4 · 10
5
4.2 · 10
7
[41]
Lysozyme (NAG)
2
1.75 · 10
)4
0.5 2.9 · 10
3
[41]
TaqI restriction
endonuclease
DNA 5.3 · 10
)8
2.2 · 10
)2
4.2 · 10
6
[42]
NaeI endonuclease DNA 1.0 · 10
)8
4.5 · 10
)2
4.5 · 10
6
[43]
BamHI endonuclease DNA 8.9 · 10
)9
7.0 · 10
)3
7.9 · 10
5
[11]
Blenoxane DNA 1 · 10
)3
[11]
BLM-A
2
DNA 2.39 · 10
)3
[12]
BLM-A
5
DNA 2.04 · 10
)5
2.28 · 10
)2
1.12 · 10
3
This work
Ó FEBS 2002 Thermokinetics of DNA cleavage catalyzed by BLM-A
5
(Eur. J. Biochem. 269) 2857
Nakamura & Peisach [47] have suggested that the
bithiazloe structure of BLM-A
2
isalteredwhenitis
inactivated. It has also been shown that activated BLM-A
2
undergoes self-inactivation to a very substantial extent
concomitant with its cleavage of DNA [5,46–49]. As some
of the molecules become inactivated and thus are no longer
capable of cleaving DNA, the measured kinetics of cleavage
will lead to underestimating of the cleaving potential of the
remaining molecules. The impact of self-inactivation of
activated BLM on the thermodynamics of DNA binding is
more complex. As the structural identities of the BLM
degradation products are unknown, it is unclear whether
those products bind to DNA themselves and with what
properties and they might affect BLM binding. Although it
is indicated in this paper that the chromophoric group of
BLM-A
5
is unchanged when it cleaves DNA, activated
BLM-A
5
could undergo the first-order self-inactivation to
some extent. As shown in Table 2, the lifetime of self-
inactivation of BLM-A
5
obtained from a model with the
first-order self-inactivation is close to that reported by
Burger and coworkers [46] and the summed v
2
of the fit
using this model is of the same order of magnitude as that of
the model without taking self-inactivation into account
(data not shown). A first-order self-inactivation could be
due to denaturation of the peptide part of the compound
leaving the bithiazloe unit intact but uncoupling the DNA
binding part of the metal complexation part (feasible at
37 °C). Moreover, in this paper, calf thymus DNA is
present when BLM-A
5
is mixed with Fe
2+
and O
2
but not
added after drug activation, and it is well known that DNA
does protect activated BLM against self-inactivation [5,46–
49]. Activated BLM-A
5
may lose its activity slower when
complexed with DNA.
In this paper, microcalorimetry and UV-vis spectroscopy
have been combined to study the scission of calf thymus
DNA catalyzed by BLM-A
5
. A novel thermokinetic
method for an enzyme-catalyzed reaction has been pro-
posed and employed to produce not only the thermody-
namic constant but also the kinetic properties of DNA
cleavage by BLM-A
5
with the result that BLM-A
5
is not as
efficient as a DNA-cleaving enzyme. The present thermo-
dynamic and kinetic findings have provided further insights
into the mechanism with which BLM functions as both a
DNA-damaging agent and an antitumor drug.
ACKNOWLEDGEMENTS
This work was supported by the 973 Project (G1999075608) from the
Chinese Minister of Science and Technology and the grant (39970164)
from the National Natural Science Foundation of China. We are also
grateful to Prof C. L. Tsou and Prof J. M. Zhou (Institute of
Biophysics, Academia Sinica, China) for their critical reading of the
manuscript and for their helpful suggestions.
REFERENCES
1. Umezawa, H., Maeda, K., Takeuchi, T. & Okami, Y. (1966) New
antibiotics, bleomycin A and B. J. Antibiot. A 19, 200–209.
2. Claussen, C.A. & Long, E.C. (1999) Nucleic acid recognition by
metal complexes of bleomycin. Chem. Rev. 99, 2797–2816.
3. Goodisman, J., Kirk, C. & Dabrowiak, J.C. (1997) Kinetic ana-
lysis of drug cleavage of closed-circular DNA. Biophys. Chem. 69,
249–268.
4. Stubbe, J. & Kozarich, J.W. (1987) Mechanism of bleomycin-
induced DNA degradation. Chem. Rev. 87, 1107–1136.
5. Burger, R.M. (1998) Cleavage of nucleic acids by bleomycin.
Chem. Rev. 98, 1153–1169.
6. Abraham, A.T., Zhou, X. & Hecht, S.M. (1999) DNA cleavage by
Fe (II) bleomycin conjugated to a solid support. J. Am. Chem. Soc.
121, 1982–1983.
7. Holmes, C.E., Carter, B.J. & Hecht, S.M. (1993) Characterization
of iron (II) bleomycin-mediated RNA strand scission. Biochem-
istry 32, 4293–4307.
8. Hecht, S.M. (1994) RNA degradation by bleomycin, a naturally
occurring bioconjugate. Bioconjugate Chem. 5, 513–526.
9. Caspary, W.J., Niziak, C., Lando, D.A., Friedman, R. & Bachur,
N.R. (1979) Bleomycin A
2
: a ferrous oxidase. Mol. Pharmacol. 16,
256–260.
10. Caspary, W.J., Lando, D.A. & Niziak, C. (1981) Intermediates in
the ferrous oxidase cycle of bleomycin. Biochemistry 20, 3868–
3875.
11. Biggins, J.B., Prudent, J.R., Marshall, D.J., Ruppen, M. &
Thorson, J.S. (2000) A continuous assay for DNA cleavage: the
application of Ôbreak lightsÕ to enediynes, iron-dependent agents,
and nucleases. Proc. Natl Acad. Sci. USA 97, 13537–13542.
12. Hashimoto, S., Wang, B. & Hecht, S.M. (2001) Kinetics of DNA
cleavage by Fe (II) bleomycins. J. Am. Chem. Soc. 123, 7437–7438.
13. Kozarich, J.W., Worth Jr, L., Frank, B.L., Christner, D.F.,
Vanderwall, D.E. & Stubbe, J. (1989) Sequence-specific isotope
effects on the cleavage of DNA by bleomycin. Science 245, 1396–
1399.
14. Natrajan, A., Hecht, S.M., van der Marel, G.A. & van Boom, J.H.
(1990) A study of O
2
- versus H
2
O
2
-supported activation of
Fe-bleomycin. J. Am. Chem. Soc. 112, 3997–4002.
15. Owa, T., Haupt, A., Otsuka, M., Kobayashi, S., Tomioka, N.,
Itai, A. & Ohno, M. (1992) Man-designed bleomycins: significance
of the binding sites as enzyme models and of the stereochemistry of
the linker moiety. Tetrahedron 48, 1193–1208.
16. Sam, J.W., Tang, X J. & Peisach, J. (1994) Electrospray mass
spectrometry of iron bleomycin: demonstration that activated
bleomycin is a ferric peroxide complex. J. Am. Chem. Soc. 116,
5250–5256.
17. Boger, D.L., Ramsey, T.M., Cai, H., Hoehn, S.T., Kozarich, J.W.
& Stubbe, J. (1998) Definition of the effect and role of the bleo-
mycin A
2
valerate substituents: preorganization of a rigid, com-
pact conformation implicated in sequence-selective DNA
cleavage. J. Am. Chem. Soc. 120, 9149–9158.
18. Veselov, A., Burger, R.M. & Scholes, C.P. (1998) Q-band electron
nuclear double resonance of ferric bleomycin and activated bleo-
mycin complexes with DNA: Fe(III) hyperfine interaction with
31
P
andDNA-inducedperturbationtobleomycinstructure.J. Am.
Chem. Soc. 120, 1030–1033.
19. Sam, J.W., Takahashi, S., Lippai, I., Peisach, J. & Rousseau, D.L.
(1998) Sequence-specific changes in the metal site of ferric bleo-
mycin induced by the binding of DNA. J. Biol. Chem. 273, 16090–
16097.
20. Aso, M., Kondo, M., Suemune, H. & Hecht, S.M. (1999)
Chemistry of the bleomycin-induced alkali-labile DNA lesion.
J. Am. Chem. Soc. 121, 9023–9033.
21. Wadso
¨
, I. (1997) Isothermal microcalorimetry near ambient
temperature: an overview and discussion. Thermochim. Acta 294,
1–11.
22. Doyle, M.L. (1997) Characterization of binding interactions by
isothermal titration calorimetry. Curr. Opin. Biotechnol. 8, 31–35.
23. Ladbury, J.E. & Chowdhry, B.Z. (1998) Biocalorimetry: Appli-
cations of Calorimetry in the Biological Sciences. John Wiley &
Sons, UK.
24. Breslauer, K.J., Freire, E. & Straume, M. (1992) Calorimetry: a
tool for DNA and ligand-DNA studies. Methods Enzymol. 211,
533–567.
2858 Y. Liang et al. (Eur. J. Biochem. 269) Ó FEBS 2002
25. Chaires, J.B. (1997) Energetics of drug–DNA interactions. Bio-
polymers 44, 201–215.
26. Roche, C.J., Thomson, J.A. & Crothers, D.M. (1994) Site
selectivity of daunomycin. Biochemistry 33, 926–935.
27. Haq, I., Ladbury, J.E., Chowdhry, B.Z., Jenkins, T.C. & Chaires,
J.B. (1997) Specific binding of Hoechst 33258 to the
d(CGCAAATTTGCG)
2
duplex: calorimetric and spectroscopic
studies. J. Mol. Biol. 271, 244–257.
28. Kagemoto, A., Yoshii, A., Kimura, S. & Baba, Y. (1994) Ther-
modynamics of interactions between ethidium bromide and
poly(A)-poly(U) mixtures in dilute and concentrated solutions.
J. Phys. Chem. 98, 5943–5952.
29. Becker, H C. & Norde
´
n, B. (1997) DNA binding properties of
2,7-diazapyrene and its N-methylated cations studied by linear
and circular dichroism spectroscopy and calorimetry. J. Am.
Chem. Soc. 120, 1030–1033.
30. Bathaie, S.Z., Moosavi-Movahedi, A.A. & Saboury, A.A. (1999)
Energetic and binding properties of DNA upon interaction with
dodecyl trimethylammonium bromide. Nucleic Acids Res. 27,
1001–1005.
31. Liang, Y., Qu, S.S., Wang, C.X., Liu, Y.W., Wang, Z.Y., Song,
Z.H., Zou, G.L. & Ou, R. (1998) Microcalorimetric studies on the
DNA scission by (1,10-phenanthroline) copper. Acta Chim. Sin.
56, 1145–1152.
32. Sigman, D.S., Mazamder, A. & Perrin, D.M. (1993) Chemical
nucleases. Chem. Rev. 93, 2295–2316.
33. Liang, Y., Wu, Y.X., Li, D.H., Wang, C.X., Liu, Y., Qu, S.S. &
Zou, G.L. (1997) Thermokinetic models of enzyme-catalyzed
reactions in batch and plug-flow reactors. Thermochim. Acta 307,
149–153.
34. Liang, Y., Wang, C.X., Qu, S.S., Wu, Y.X., Li, D.H. & Zou, G.L.
(1998) Thermokinetic method for faster enzyme-catalyzed reac-
tions. Thermochim. Acta 322, 1–7.
35. Liang,Y.,Li,J.,Chen,J.&Wang,C.C.(2001)Thermodynamics
of the folding of
D
-glyceraldehyde-3-phosphate dehydrogenase
assisted by protein disulfide isomerase studied by micro-
calorimetry. Eur. J. Biochem. 268, 4183–4189.
36. Fersht, A. (1999) Structure and Mechanism in Protein Science: a
Guide to Enzyme Catalysis and Protein Folding, pp. 108–111. W.H.
Freeman Co, New York.
37. Laidler, K.J. & Bunting, P.S. (1973) The Chemical Kinetics
of Enzyme Action. pp. 175–180, 413–429. Clarendon Press,
Oxford.
38. Zeng, X.C., Zhang, Y.Q., Meng, X.G. & Tian, A.M. (1997)
Thermo-kinetic research methods for simple order reactions:
analog curve and characteristic parameter methods. Thermochim.
Acta 293, 171–177.
39. Wang, H.F., Yang, P., Li, Q.S. & Wu, Q. (1997) Electrochemistry
characteristics of adriamycin-Fe (III) complex and its interaction
with DNA. Chem. J. Chinese University 18, 671–675.
40. Eliot, H., Gianni, L. & Myers, C. (1984) Oxidative destruction of
DNA by the adriamycin–iron complex. Biochemistry 23, 928–936.
41. Britt, B.M. (1997) For enzymes, bigger is better. Biophys. Chem.
69, 63–70.
42. Zebala, J.A., Choi, J. & Barany, F. (1992) Characterization of
steady state, single-turnover, and binding kinetics of the TaqI
restriction endonuclease. J. Biol. Chem. 267, 8097–8105.
43. Yang, C.C., Baxter, B.K. & Topal, M.D. (1994) DNA cleavage by
NaeI: protein purification, rate-limiting step, and accuracy. Bio-
chemistry 33, 14918–14925.
44. Wu, W., Vanderwall, D.E., Lui, S.M., Tang, X.J., Turner, C.J.,
Kozarich, J.W. & Stubbe, J. (1996) Studies of Cobleomycin A
2
green: its detailed structural characterization by NMR and mo-
lecular modeling and its sequence–specific interaction with DNA
oligonucleotides. J. Am. Chem. Soc. 118, 1268–1280.
45. Wu, W., Vanderwall, D.E., Turner, C.J., Kozarich, J.W. &
Stubbe, J. (1996) Solution structure of Cobleomycin A
2
green
complexed with d(CCAGGCCTGG). J. Am. Chem. Soc. 118,
1281–1294.
46. Burger, R.M., Peisach, J. & Horwitz, S.B. (1981) Activated
bleomycin: a transient complex of drug, iron, and oxygen that
degrades DNA. J. Biol. Chem. 256, 11636–11644.
47. Nakamura, M., Peisach, J. & Self-inactivation of Fe (II)-bleo-
mycin. (1988) J. Antibiot. 41, 638–647.
48. Burger, R.M., Peisach, J., Blumberg, W.E. & Horwitz, S.B. (1979)
Iron–bleomycin interactions with oxygen and oxygen analogues.
J. Biol. Chem. 254, 10906–10912.
49. Van Atta, R.B., Long, E.C. & Hecht, S.M. (1989) Electrochemical
activation of oxygenated Febleomycin. J. Am. Chem. Soc. 111,
2722–2724.
Ó FEBS 2002 Thermokinetics of DNA cleavage catalyzed by BLM-A
5
(Eur. J. Biochem. 269) 2859