A Comparative Analysis of Carbon Dioxide Emissions in Coated Paper Production Key Differences between China and the U.S. pot
Bạn đang xem bản rút gọn của tài liệu. Xem và tải ngay bản đầy đủ của tài liệu tại đây (1.65 MB, 53 trang )
Robert O. Vos
Josh Newell
Center for Sustainable Cities
University of Southern California
June 2009
A Comparative Analysis of Carbon Dioxide
Emissions in Coated Paper Production
Key Differences between China and the U.S.
ii
© 2009 by the Center for Sustainable Cities
University of Southern California
3620 S. Vermont Avenue
Los Angeles, CA 90089-0255
Acknowledgements
Numerous individuals assisted in the preparation of this report. Dr. Jingfen Sheng and others in the USC
Geographic Information Science (GIS) Research Laboratory provided technical assistance with the distance
calculations. Brian Stafford offered his expertise on the Chinese paper industry. Michael Jones at RISI assisted with
data clarification issues and Michael Todasco and Brian Kozlowski of NewPage Corporation provided us with a
comprehensive picture of NewPage’s fiber inputs and mill processes and useful comments and critique during the
research process. NewPage Corporation supports independent academic research on sustainability issues in the
global paper industry as a means to identify strategies and measures to further its sustainability efforts. NewPage
provided financial support for this study as a client of Clean Agency, a firm that provides sustainability consulting
and public relations support to companies striving toward a better way of doing business. The study also benefited
from non-blind peer review from specialists in the field. These reviewers included professors Mark Harmon of
Oregon State University and Mansour Rahimi of the University of Southern California, as well as consultants Jim
Ford of Climate for Ideas and Wallace Partners. The findings, views, and any errors contained in this study are the
sole responsibility of the authors.
Abstract
This technical report compares carbon dioxide emissions from the production of freesheet coated paper in the
Chinese paper industry with the same paper produced by NewPage Corporation, the largest North American
manufacturer of coated paper products. By analyzing the supply chains for the Chinese and NewPage
manufacturing facilities, the report highlights differences in the carbon burden based on two key components of
the lifecycle—carbon dioxide emissions from transportation and energy in pulp and paper production. The carbon
burden from these two components for coated freesheeet paper manufactured in China’s industry is significantly
higher than for NewPage’s coated freesheet paper. It should be noted that this study is a partial, comparative
lifecycle inventory of carbon dioxide emissions in coated freesheet paper. The study also reviews emerging science
on carbon pooling given varying forest types and harvesting practices, and offers the methodological building
blocks for how fiber acquisition might be modeled for the comparison. We find that the fiber acquisition
component has substantial implications for accounting for the carbon burden in both supply chains.
Preferred Citation: Robert O. Vos and Josh Newell. 2009. A Comparative Analysis of Carbon Dioxide Emissions in
Coated Paper Production: Key Differences between China and the U.S. Center for Sustainable Cities, University of
Southern California, Los Angeles, California.
i
Contents
Contents i
List of Figures iii
List of Tables iv
Executive Summary 5
1. Overview of the Coated Paper Industry in China and the U.S. 9
Fiber Supply Structure - China 11
Pulp import structure 13
Fiber Supply Structure - NewPage 16
2. Study Scope and System Boundary 17
Transportation 18
Pulp and paper production 18
Fiber acquisition 19
Other clarifications 19
3. Transportation 20
Method 20
Method to calculate distances 20
Method to estimate carbon dioxide emissions 21
Results 23
4. Pulp and Paper Production 24
Method 25
Model for the BHKP supply chain for China 25
Model for the BSKP supply chain for China 28
ii
Model for coated paper manufacturing in China 29
Model for the U.S. (NewPage) supply chain 30
Results for the Chinese Industry’s Supply Chain 31
Major sources of carbon dioxide emissions from BHKP production 31
Major sources of carbon dioxide emissions from BSKP production 31
Summing up: Carbon Dioxide Emissions in China’s Coated Paper Facilities 32
Results for the U.S. (NewPage) Supply Chain 33
Comparison 33
Future Research 33
5. Fiber Acquisition: Carbon Loss Due to Timber Harvest 34
Forest Type 34
Disturbance regimes and forest management 35
Methodologies 35
Annual increase in carbon stocks due to biomass growth 36
Annual carbon loss from drained organic soils (CO2) 37
Calculating carbon loss per finished metric ton 37
Scoping the parameters of the model 39
Conclusions and future research 40
6. Appendices 44
Useful Terms 44
Forest Classification and Assigned Values, by Country 47
7. Selected References 49
iii
List of Figures
Figure 0.1 Comparison of Carbon Dioxide Emissions for Coated Freesheet Paper Production 7
Figure 1.1 Major Coated Paper Manufacturers in China, 2007 9
Figure 1.2 Geographic Distribution of APP's Major Pulp and Paper Mills in Asia 10
Figure 1.3 Breakdown of China's Paper Supply Sources, 2005 11
Figure 1.4 Major Pulp Mills across the Globe, 2007 14
Figure 1.5 Chinese Imports of Bleached Hardwood Kraft Pulp, by Country, 2007 15
Figure 1.6 Chinese Imports of Bleached Softwood Kraft Pulp, by Country, 2007 16
Figure 4.1 Non-Integrated Pulp and Paper Production 24
Figure 4.2 Carbon Dioxide Emissions per metric ton of BHKP by Energy Type 31
Figure 4.3 Carbon Dioxide Emissions per Metric ton of BSKP by Energy Type 32
Figure 4.4 Carbon Dioxide Emissions from Embedded Energy for Coated Freesheet Paper Made in China 32
Figure 4.5 Carbon Dioxide Emissions from Embedded Energy for Coated Freesheet Paper made in the U.S.
(NewPage) 33
iv
List of Tables
Table 1.1 Major Fiber Sources for Coated Paper (all types) in China 12
Table 1.2 China’s Pulp Imports, 2002-2006 (kilotons per year) 13
Table 1.3 Brazil's Pulp and Paper Investment Program, 2002-2012 16
Table 2.1 Partial Lifecycle Delimitation 17
Table 3.1 Energy and Emission factors by Transport Mode 22
Table 4.1 Method I, Estimated Annual Carbon Loss due to Timber Harvest, Selected Countries 42
5
Executive Summary
This report provides a comparison of carbon dioxide emissions from the production of coated freesheet paper in
the Chinese paper industry with coated freesheet paper produced by United States (U.S.)-based NewPage
Corporation, the largest coated paper manufacturer in North America. The study tests the hypothesis that carbon
dioxide emissions inherent in the production of coated freesheet paper vary greatly depending on where and how
it is produced, where the raw materials used to make it are extracted and processed, and where it is sold. The
results of the study provide evidence that the distribution of production locations in each supply chain makes a
significant difference in the overall emissions of carbon dioxide (CO
2
).
The research presented in this report focuses on three aspects of spatial differences in the production of coated
paper that are hypothesized to be different between China and the U.S. These three are as follows: integrated vs.
non-integrated pulp and paper production; the fuel mix of direct and indirect energy used in pulp and paper
production; and long versus short transportation distances. The magnitude of differences between the supply
chains are estimated using models created for two stages in the lifecycle in each supply chain: transportation of
fiber and finished paper and energy used in pulp and paper production.
Carbon release from forestry due to fiber acquisition is a crucial emerging issue in calculating the carbon burden of
paper products. It is also likely that emissions of greenhouse gases (GHGs) from forestry vary by the geographical
distribution of the supply chain, depending upon forest types and harvest or plantation practices. The final section
of the report includes an extensive discussion of this issue in the context of these two supply chains.
The report is organized with opening sections giving an overview of the supply chains for China and NewPage and
delimitation of the study scope. Next are sections for each of the two emissions models: transportation and pulp
and paper production, followed by a section discussing carbon loss from forestry. Each of these sections are
summarized below.
1. Overview of the Chinese and U.S. Coated Paper Industries
China is now the second largest producer of paper, after the U.S., and coated paper is one of the fastest growing
segments of this sector. In China, Asia Pulp and Paper’s (APP) Gold East Paper mill is by far the largest producer.
APP produced about 15% of the total production of coated papers of all types in China in 2008. NewPage
Corporation is the largest manufacturer of coated paper (of all types) in North America with approximately 35% of
2008 North American production capacity, followed by Verso Paper (17%) and Sappi Corporation (14%). China is
the world’s largest importer of pulp. In 2007, China’s top six pulp providers were as follows: Canada (20% of the
total), Indonesia (18%), Brazil (14%), Russia (14%), the United States (11%), and Chile (10%). The wood supply
structure for NewPage’s facilities is primarily locally sourced. Most fiber is sourced by harvesting wood from
managed native forests within approximately a 100 mile radius of each facility, with approximately 10% of
NewPage’s total fiber requirements imported as pulp from Canada (based on 2007 data). The use of recycled fiber
in production of coated paper of all types is small in both the U.S. and Chinese supply chains. For example,
recycled fiber made up 3% of total fiber for NewPage in 2007. For the Chinese supply chain, the figure is 7%. For
coated freesheet paper, industry data for both supply chains revealed virtually no use of recycled fiber. Thus, the
study focuses on fiber inputs of wood and pulp.
6
2. Study Scope and System Boundary
This study is structured as a partial comparative lifecycle inventory of carbon dioxide emissions. It is not a full
“carbon footprint” of the coated freesheet product in either supply chain. There are numerous stages and
elements in the full lifecycle of coated freesheet paper that are not analyzed in this study (see Table 2.1). As noted
above, among the most prominent of these is carbon dioxide emissions associated with land use change, such as
timber harvest due to fiber acquisition. Additional basic scientific research is needed to make an accurate
comparison of these emissions across the two supply chains. There are also several other lifecycle stages and
elements that are excluded. Omission is due to data unavailability or suitability to the purpose of the study. For
several of these elements, it seems likely that the processes and carbon dioxide emissions differ little between the
two supply chains. Throughout the study, comparisons are drawn using the same data sources to characterize
energy use as well as emission factors for both supply chains. This ensures that the comparison is not rendered
inaccurately due to higher data resolution for one supply chain. Although, it is important to note the study does
not refer to the entire U.S. industry; rather it focuses solely on the carbon dioxide emissions associated with
NewPage’s production.
3. Transport
The research includes a study of CO
2
emissions from transportation in each supply chain. The study includes
transportation of pulp to paper mills, and of finished paper from paper mills to Los Angeles, CA, a major U.S. point
of purchase. Overall, there is more transport of materials in the Chinese supply chain, because pulp comes from all
over the world, and the Chinese paper mills are far from U.S. markets. For example, pulp travels on average over
5,000 miles to the mills in China compared to about 1,500 miles for the U.S. mills. The transportation study does
not include emissions from the transport of chemical and other non-fiber additives or wood fiber to the pulp mills.
Instead, it focuses on transport of two of the principal constituents in the supply chains: pulp and finished paper.
Both are areas where we expected significant differences between the two supply chains.
Findings
Emissions of carbon dioxide from transportation for the Chinese coated paper industry are about eight times
higher than for NewPage coated paper. Estimated carbon dioxide emissions from transportation for coated
freesheet paper delivered to the Port of Los Angeles totals 187 Kg of CO
2
per finished metric ton (FMT) for the
Chinese industry and 23 Kg of CO
2
per FMT for NewPage. It is important to note, however, that transportation
emissions are much smaller than emissions from pulp and paper production.
4. Pulp and Paper Production
Previous studies conclude that the major component of CO
2
emissions in the paper lifecycle is found in the
production/use of process steam (heat) and electricity in pulp and paper manufacturing (Gower, 2006; NCASI,
2005). This study compares the U.S. and Chinese supply chains with models of energy and fuel use based on
global industry data. Emission factors used to calculate carbon dioxide emissions from the burning of fossil fuels
across the global supply chain are analogous to those used in the IPCC’s 2006 methodology for national emissions
inventories.
7
Findings
The NewPage carbon footprint from embedded energy in manufacturing is about 42% lower than the footprint for
the Chinese manufacturing: 1,432 Kg of CO
2
per FMT for the U.S. (NewPage) vs. 2,478 Kg of CO
2
per FMT for China.
Results confirm the importance of the fuel mix in driving the carbon footprint for embedded energy in
manufacturing coated freesheet paper, as well as efficiency gains with higher levels of integrated pulp and paper
production in the U.S. China’s extended supply chain for coated paper manufacturing uses more energy overall,
and has much more coal fuel in its production. The U.S. (NewPage) supply chain uses less energy overall, and has
more biomass energy available for production. Cleaner fuels like natural gas displace the use of coal. When coal is
used, co-firing with biomass sources makes it much more efficient with respect to CO
2
emissions. Also, when
electricity is used from the grid, energy sources in the U.S. grid are less carbon intensive than for grid electricity in
China.
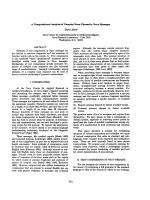
Figure 0.1 Comparison of Carbon Dioxide Emissions for Coated Freesheet Paper Production
5. Fiber Acquisition
Forests play an important role in stabilizing the global climate. Both the types of forests and forest management
practices vary substantially between the two supply chains. As forests are harvested and/or replanted, or
harvested and converted to other land uses, the potential exists for the net release of GHG’s into the atmosphere.
In this section of the study, we discuss the variables that would need to be accounted for to accurately model and
compare the carbon loss due to timber harvest for two supply chains. The carbon burden hinges on many factors,
including harvest practices, plantation management, and the types of forests that are impacted. This section also
provides the foundations for building a general methodology to account for these factors at the product level.
Two key issues highlighted are considerations regarding spatial and temporal scales that should be incorporated
into the model.
8
6. Conclusions and Future Research
This study reveals that not all papers are created equally. The geography of paper production matters a great deal
for the environment. The supply chains for China’s industry produce larger emissions of carbon dioxide, primarily
from fuel used to produce the pulp and the paper (see Figure 0.1). More research is needed to understand how
the geography of paper production and consumption affects the full “carbon footprint” and the overall
environmental burden (on a total lifecycle basis).
9
1. Overview of the Coated Paper Industry in China and the U.S.
Since 1990, China has accounted for more than 50% of the world’s overall growth in paper and paperboard (Barr
and Demawan, 2005). China is now the second largest producer of paper, after the U.S., and coated paper is one of
the fastest growing segments of this sector. Figure 1.1 shows the top Chinese coated paper manufacturers in terms
of metric tons produced.
Figure 1.1 Major Coated Paper Manufacturers in China, 2007
Sources: Map by Authors/Data from World Resources Institute, 2007; RISI, 2007: ESRI, 2007.
Note: Production figures are in metric tons. Frontier Forests refer to forests that are largely intact natural forests as defined by
the World Resources Institute.
10
In China, Asia Pulp and Paper’s (APP) Gold East Paper mill is by far the largest producer. APP has a capacity of
approximately 2.8 million metric tons of coated paper in 2007 or about 15% of the total production of coated
papers of all types in China (Resource Information Systems Incorporated (RISI), 2007). No other single producer
accounts for more than 10% of the total. Figure 2.2 is a map of the locations of APP’s most important facilities.
Figure 1.2 Geographic Distribution of APP's Major Pulp and Paper Mills in Asia
Sources: Map by Authors/Data from World Resources Institute, 2007; RISI, 2007: ESRI, 2007.
Note: Production figures are in metric tons.
To compare the Chinese and U.S. coated paper supply chains, this study focuses on production at NewPage
Corporation, the largest coated paper manufacturer in North America. NewPage has a total annual production
capacity of approximately 3.3 million short tons of coated paper, which represents approximately 35% of 2007
North American production capacity. Verso Paper represents about 17% of the total, followed by Sappi
Corporation at about 14% (Resource Information Systems Incorporated (RISI), 2007 and NewPage Internal
Numbers). For this study we focused on six facilities that made coated freesheet paper in 2007. These facilities
are generally located in the upper Midwest and Northeast in the vicinity of working forests. One note of caution:
11
this study should not be viewed as representative of the entire U.S. coated paper industry, because we focused on
one company, and further on only the facilities of that company that make coated freesheet paper. However,
NewPage is a large enough producer to make for meaningful analysis as compared to the industry in China.
Throughout this study, figures for coated paper manufacturing in China and the U.S. are drawn from an analysis of
industry software called Cornerstone produced by RISI (2007). In its flow sheets, Cornerstone tracks inputs to
production and outputs by facility, in a materials balance framework. Data were extracted from the flow sheets
for total output of coated papers of various types, and also for inputs to each type. Although Cornerstone does
not include a complete list of every paper producer, it is the most thorough data available for the industry on a
global scale. The data used in this study represent annual production for 2007.
Fiber Supply Structure - China
The rise of the Chinese paper sector has transformed an industry once consisting of numerous small-scale pulp
mills that were heavily reliant on non-wood fibers to one that now imports large quantities of pulp and wastepaper
to feed huge, modern mills (Vickers Securities, 2005). Slightly less than 50% of the fiber supply (pulp and
wastepaper) used by Chinese paper producers comes from imports (Figure 1.3), including 33% from waste (or
recovered) paper, 14% from wood pulp, and a small percentage from non-wood pulp.
Figure 1.3 Breakdown of China's Paper Supply Sources, 2005
Source: UN Comtrade
Domestically produced wood pulp currently provides about 8% of China’s paper supply source. China is the world’s
9th largest wood pulp producer, with about 70% of total production coming from large mills less than 10 years old
(Wood Resources International and Seneca Creek Associates, 2007). Information on domestic wood supplied to
Chinese pulp mills is difficult to obtain, but an estimated two-thirds is coming from domestic plantations. The rest
is uncertain. Suspiciously sourced wood fiber is likely to account for at least 10% according to Wood Resources
International. Imported chips represent at least 6% of the wood fiber consumed in the production of domestically
produced wood pulp, with the two largest suppliers being Australia and Vietnam.
China is the world’s largest importer of pulp. The Chinese government has taken steps to reduce this reliance by
subsidizing the development of fast-growing plantations. China has approximately 1.65 million hectares of
eucalyptus plantations, with many of them located in China’s southeastern provinces (American Forest & Paper
12
Association, 2004). The government has allocated an additional 5.8 million hectares for plantation development
over the next decade and provides an array of subsidies to this industry (Barr et al., 2005).
These efforts notwithstanding, analysts generally concur that the Chinese paper industry will remain heavily reliant
on imported pulp, woodchips, and recovered paper for at least the next decade (Barr et al., 2005).
1
Dennis Neilson,
director of New Zealand forestry consulting firm Dana, notes that the plantation program is far behind schedule
and that the growth rates for poplar trees have been so poor that the government is now discouraging planting of
that species altogether. Other challenges include a logging ban throughout most of China’s natural forests and the
emergence of low-cost pulp from regions like Brazil and Indonesia.
Coated paper manufacturing in China is particularly reliant on imported wood fiber because unlike other types of
paper manufacturing in China, it uses very little recycled paper or low quality (vegetable) fiber. Also, only one
facility in China (Jiangxi Chenming Paper Co.) uses any wood directly in its production process. The use of this
wood as a feedstock is very small relative to the use of pulp at this plant and all the others in China. There is also a
slight amount of straw being used in some of the production.
Of the total fiber supply for making coated paper in China, only 7% comes from wastepaper. Given that China
imports a large quantity of recycled paper, it is likely that a significant share of this fiber is also imported. Table 1.1
gives the breakdown for the major fiber sources for coated paper in China. There is essentially no recycled fiber
reported in the Cornerstone flow sheets for coated freesheet paper, the focus of this study. Overall, coated paper
manufacturing in China relies upon imported and, to a lesser extent, domestic production of pulp. The fiber used
for coated freesheet paper manufacturing is either BHKP or BSKP. Thus, analysis of the supply chain for China in
this study focuses on these two major constituents.
Table 1.1 Major Fiber Sources for Coated Paper (all types) in China
Major Fiber Sources
ADMT/
per day
% of Feedstock
Bleached Hardwood Kraft Pulp
4367
64%
Bleached Softwood Kraft Pulp
1496
22%
Bleached Chemical Thermo-Mechanical Pulp
2
481
7%
Sorted Office Papers
208
3%
Old Newspapers
281
4%
Total Fiber Sources
6833
100%
Source: Authors’ analysis of RISI, 2007.
1
UPM's 350,000 metric ton paper mill in Changhsu, China relies on imported pulp, now primarily from Uruguay and before from
Indonesia, Finland and Canada. The company pulled out of a joint venture to build a pulp mill and establish plantations in
Guangdong province in November 2004 (Barr et. al, 2005).
2
There are also about 7% of inputs to coated paper from bleached chemical thermo-mechanical pulp. This type of pulp is
reported only at the APP plant. More than 80% of this type of pulp is produced in Canada. However, because it is small part of
the major inputs, and because we had no specific data on the location of production, we excluded it from further analysis.
13
Pulp import structure
The analysis of the Chinese import structure focuses exclusively on BHKP and BSKP, by far the most important fiber
materials in coated paper. China is the world’s largest importer of pulp. Table 1.2 shows pulp imports, from 2002
to 2006, by type of pulp. Sulfate pulp, which totals about 80 percent of all imported pulp, includes BHKP and BSKP.
China’s top six pulp providers are as follows: Canada (20% of the total), Indonesia (18%), Brazil (14%), Russia (14%),
the United States (11%), and Chile (10%). Figure 1.4 shows the location of the world’s largest BHKP and BSKP pulp
mills.
Table 1.2 China’s Pulp Imports, 2002-2006 (kilotons per year)
Grade
2002
2003
2004
2005
2006
% +/- pa
% (2006)
Mechanical Pulp
146
89
76
60
71
-17%
0.9%
Dissolving Pulp
200
269
290
294
393
18%
4.9%
Sulfate Pulp
4,475
4,937
6,034
6,258
6,406
9%
80.4%
Sulfite Pulp
54
50
67
41
51
-1%
0.6%
Chemi-Mechanical Pulp
357
644
751
868
967
28%
12.1%
Recovered Material Pulp
32
45
102
72
77
24%
1.0%
Total
5,265
6,034
7,319
7,592
7,965
11%
100%
Source: World Trade Atlas, Global Trade Information Services (GTIS)
14
Figure 1.4 Major Pulp Mills across the Globe, 2007
Sources: Map by Authors/Data from World Resources Institute, 2007; RISI, 2007.
Bleached Hardwood Kraft Pulp (BHKP)
Driven by rapidly expanding production of books and magazines, advertising, and copy paper, China’s imports of
BHKP have grown enormously over the past decade (Barr et al., 2005). BHKP imports rose from 123,000 tons in
1995 to about 3.1 million metric tons in 2007. As shown in Figure 1.4, over 75% of China’s BHKP imports come
from three countries: Indonesia (35% of the total), Brazil (27%), and Chile (14%).
15
Figure 1.5 Chinese Imports of Bleached Hardwood Kraft Pulp, by Country, 2007
Source: World Trade Atlas, Global Trade Information Services (GTIS). HTIS Code: 470321.
Indonesia
A significant portion of China’s imports of BHKP from Indonesia are structured as integrated sales by affiliates of
the Asia Pulp & Paper (APP) and APRIL groups, each of which manages pulp mills in Indonesia and paper
production facilities in China (Pirard and Rokhim, 2006). In January 2007, BISNIS Indonesia reported that two
companies are planning to invest a total of US$3 billion in new pulp mills (Lang, 2007). Indonesian company PT
Garuda Kalimantan Lestari plans a 1.2 million ton capacity pulp mill and associated chemical plant in West
Kalimantan. PT Kaltim Prima Pulp & Paper plans a 1.2 million ton capacity pulp mill in East Kalimantan (Lang, 2007).
Brazil
Brazil is the world’s 7
th
largest pulp producer and the second largest pulp exporter. More than half of Brazilian
production is exported. Brazilian pulp exports are expected to reach 7.4 million metric tons by 2012 (Table 1.3).
Virtually all of the growth in pulp production in Brazil has been in bleached short-fiber (eucalyptus) pulp, which
makes up 80% of total pulp production. Brazil is now the world’s lowest cost producer of BHKP. Aracruz is the
world's largest producer of bleached eucalyptus pulp, producing about 27 per cent of the world's total. The
company produces a total of 3 million metric tons of pulp a year, and has an area of almost 280,000 hectares of
industrial tree plantations plus about 90,000 hectares grown under contract with farmers (Wood Resources
International and Seneca Creek Associates, 2007)
16
Table 1.3 Brazil's Pulp and Paper Investment Program, 2002-2012
2002
2012
% Increase
Area Planted (BRACELPA
Companies)
1.4 million ha
2.6 million ha
+86%
Pulp Production (million
Mt)
8.0 Mt
14.5 Mt
+81%
Paper Production
7.7 Mt
13.4 Mt
+74%
Pulp Exports
3.5 Mt
7.4 Mt
+111%
Paper Exports
1.4 Mt
2.0 Mt
+43%
Source: Brazilian Pulp and Paper Association
Bleached Softwood Kraft Pulp (BSKP)
China’s imports of BSKP grew from 429,000 metric tons in 1995 to about 3 million tons in 2007. To add flexibility
and strength to paper products, BSKP, due to its long fiber content, is commonly mixed with other types of pulp
(Barr and Demawan, 2005). In 2007, as shown in Figure 1.6, China obtained 71% of its BSKP imports from four
countries: Canada (28%); Chile (15%); Russia (14%); and the United States (14%).
Figure 1.6 Chinese Imports of Bleached Softwood Kraft Pulp, by Country, 2007
Source: World Trade Atlas, Global Trade Information Services (GTIS). HTIS Code: 470329.
Fiber Supply Structure - NewPage
The wood supply structure for NewPage’s facilities, by contrast, is primarily locally sourced. Most fiber is sourced
by harvesting wood from managed native forests within approximately a 100-mile radius of each facility. Detailed
records are maintained on the amount of wood harvested by state and county. As of May 2008, NewPage had
twelve paper mills. Six of these mills make coated freesheet paper and so were included in this study (Escanaba,
MI; Luke, MD; Rumford, ME; Wickliffe, KY; Kimberly, WI (closed September 2008); and Wisconsin Rapids, WI). Of
these six, two mills, Kimberly and Wisconsin Rapids, use imported pulp. At the Wisconsin Rapids mill, most pulp
comes from a facility in the area, and the remaining 7% is imported from Canada. For the Kimberly, Wisconsin mill,
42% comes from NewPage Wisconsin Rapids, 42% from Canada, 10% from other US suppliers and 6% is recycled
pulp. The mills use more BHKP than BSKP. Most BHKP is transferred between NewPage mills, and most BSKP is
17
imported from Canada. Imported pulp from Canada constitutes approximately 10% of the required fiber. Nearly all
of the NewPage’s coated freesheet mills are fully integrated for pulp and paper production, as described in the
following section.
2. Study Scope and System Boundary
This study does not provide a full carbon footprint for coated freesheet paper production, an effort that would be
highly complex and would require significantly more data collection and analysis than afforded for the comparative
purpose of this study. Table 2.1 summarizes the major stages and elements that are included or excluded for the
partial lifecycle inventory. As shown in the table, elements where emissions of carbon dioxide are assumed to be
roughly the same between the two supply chains are not analyzed. These elements could be the subject of further
study.
Table 2.1 Partial Lifecycle Delimitation
Lifecycle Stage/Element
Include
Rationale
Fiber Acquisition
Carbon loss from forestry
No
Inadequate scientific basis for comparison. See discussion in
Section 5.
Harvesting equipment emissions
No
Assume minimal difference in supply chains.
Use of recycled paper fiber
No
No recycled fiber in coated freesheet production reported in
the Cornerstone data for either supply chain.
Pulp and Paper Manufacturing
Fossil fuel use at pulp and paper mills
Yes
See Section 4.
Electrical energy use at pulp and
paper mills
Yes
See Section 4.
Biomass fuel emissions at pulp and
paper mills
No
Inadequate scientific basis for comparison. See discussion in
Section 5.
Mining & manufacturing of coated
paper additives
No
Assume minimal difference in supply chains.
Wastewater treatment
No
Data unavailable.
Calcium carbonate precipitation
No
Data unavailable.
Transportation
Wood from forest to pulp or
(integrated) paper mill
No
Assume minimal difference in supply chains.
Fiber from pulp mill to paper mill
Yes
See Section 3.
Finished paper to U.S. consumer
Yes
See Section 3.
Transport of coating additives
No
Assume minimal difference in supply chains.
End of Life/Disposal
Consumer paper disposal (landfill,
incineration, or recycling)
No
Not relevant for comparison of production in the two supply
chains.
18
This study focuses on areas of the supply chain believed to be significantly different between the two production
systems. For consumption in a single hypothetical U.S. location, the focus is on production emissions. As noted in
the previous section, the geographical characteristics of production of coated freesheet paper are very different in
these two supply chains. Given this variation, we hypothesize important differences in the transportation and
energy use in pulp and paper plants. It is appropriate to model these lifecycle elements to better understand the
magnitude of these differences.
Transportation
The scope of transportation emissions considered here includes the shipping of pulp to paper mills (in cases of
non-integrated production) and the shipping of finished product to the consumer market. For this study, the
consumer of coated paper is scoped at the level of the printer or merchant (i.e., not through to the individual
consumer’s mailbox or retail outlet). The study also does not include the transport of wood to the pulp mill (or the
integrated facilities), nor does it include transportation for any other materials used in coated paper
manufacturing. Results provide an indication of the relative magnitude of transportation emissions in driving
differences in emissions of carbon dioxide for coated freesheet paper made in China and the U.S. (NewPage).
Pulp and paper production
In terms of pulp and paper production, the analysis focuses on energy use at mills (both integrated and non-
integrated). In the case of non-integrated paper mills, the carbon dioxide emissions embedded in pulp coming
from upstream pulp mills is apportioned for the product total. The analysis includes estimates for emissions from
both fossil fuels and electrical energy from the grid. It is possible that in some mills the emissions of carbon
dioxide are reduced through absorption for production of precipitated calcium carbonate. Also, it is possible that
some mills use additional energy to operate wastewater treatment facilities. There is inadequate data to account
for this in both supply chains.
In both integrated and non-integrated production, wood scraps and residuals of pulping are an important fuel
source. At the present time the IPCC and national authorities consider such biomass fuel (i.e., “hog” or “black
liquor”) to be a renewable fuel. Thus, for the purposes of national inventories, carbon dioxide emissions from hog
and black liquor used in pulp and paper production are not included in total emission calculations. The emissions
are counted for purposes of crosschecking and to avoid double counting (IPCC, 2006). Under the United Nations
Framework Convention on Climate Change (UNFCC), the carbon dioxide from biomass in national inventories is
counted in surveys of forested land. Including combustion emissions in the national-level inventory would lead to
double counting.
The long-standing assumption for renewable fuels has been that carbon dioxide released from combustion of the
biomass is re-absorbed fast enough by agricultural or forested land managed to renew stocks of fuel so as to
balance the GHG warming potential inherent in the use of the fuel. With increased biofuel production, this
assumption is under increasing scrutiny. Recent studies show that if land is diverted from an existing use with high
carbon sequestration function to make way for biofuel crops, the result may be higher than expected net release
of carbon dioxide into the atmosphere (Searchinger et al., 2008).
The assumption of carbon neutrality for woody biomass and harvest from forested land is also currently under
scrutiny (Ford, 2009). For inventories at the product level, an appropriate emissions factor for biomass fuels must
be determined based upon the underlying changes to land use. In the context of evolving science, such emission
19
factors were not available to make a reliable comparison of the U.S. (NewPage) and Chinese supply chains. Thus,
the carbon dioxide emissions from biomass fuels were not included in this study.
Combustion of biomass fuels also emits small amounts of GHG’s other than CO
2
. As these gases do not fit the
same role in the global carbon cycle as carbon dioxide in biomass, they may warrant further scrutiny (Tarnawski,
2004). Nevertheless, on a carbon-equivalent basis, they are seen to be relatively insignificant compared to
emissions of CO
2
in the overall manufacturing process. Moreover, there is no reason to suspect that such
emissions would differ significantly between the U.S. and Chinese supply chains.
While non-fiber additives and make-up chemicals are sizeable components of the paper (about 1/3 by mass) and
these constituents may vary somewhat in terms of composition and environmental burdens in the supply chain,
they are excluded from the scope of this study. In general, these elements were not deemed to be significantly
different as the basic mining and chemical production processes for these additives appear to be relatively uniform
in the global economy. Also, some elements are excluded due to data unavailability. This element would be critical
for a full carbon footprint of coated freesheet paper, and could be the subject of further investigation for
comparative analysis.
Fiber acquisition
For the same reason, the partial inventory in this study does not include an estimate of carbon dioxide emissions
from fiber in the paper associated with land use changes due to forestry operations. Methods and protocols for
determining the emissions from this source are in flux at this time. Additional basic scientific research is needed.
It is important to note that the magnitude of these emissions may be highly significant relative to the magnitudes
of the two phases inventoried here. The implications of this for comparative analysis of carbon dioxide emissions
warrant the extended discussion that appears in Section 5 of this study.
Because RISI’s Cornerstone data reports no recycled fiber in either supply chain for coated freesheet production,
the use of recycled fiber is not part of the scope of this study. It should be noted that for other types of coated
paper, and especially uncoated paper of many grades, the use of recycled fiber would be very important to
account for in a geographical comparison of carbon dioxide emissions. The analysis would need to include the
energy used in sorting and transporting the recycled fiber to the mill. In general, recycled paper has a high level of
embedded energy that offsets both the need to harvest new fiber and the energy requirements to process at the
paper mill (Ford, 2009).
Other clarifications
Finally, GHGs other than carbon dioxide may play a role. For example, the full footprint of coated paper is certainly
impacted by methane or carbon dioxide released from disposal practices (i.e., landfilling, incineration or recycling).
Given variations in municipal solid waste disposal/recycling systems and distances between consumers and
recycling facilities, the end of life impacts may also vary substantially depending upon where the paper is
consumed. These emissions are beyond the scope of this study, which focuses on production up to the point of
consumption.
Although NewPage Corporation is the largest North American manufacturer of coated paper, it is also important to
note that this report does not refer to production of coated freesheet paper for the entire U.S. industry, but rather
solely the emissions in NewPage’s product. However, to ensure accurate comparisons, data are drawn from the
20
same industry sources for both supply chains. To characterize paper production volumes, as well as energy use in
pulp and paper production, the study uses facility data from the industry data source Cornerstone. For emission
factors, the study relies upon national averages for all the countries involved in both supply chains from the
International Energy Agency (IEA). The only exception to this rule is the characterization of pulp imports. For
China’s industry, we rely on global trade data combined with standard industry facility data to model the likely
origin of pulp around the world. For NewPage’s supply chain, pulp imports are much more limited, and we drew
on facility averages from standard industry data for specific facilities identified as providing pulp for NewPage.
3. Transportation
Emissions of carbon dioxide from transportation throughout a product’s lifecycle also depend on where the
product is produced, where the raw materials used to make it are extracted and processed, and where it is sold.
This section investigates the impact of the varying global distribution of the Chinese and U.S. (NewPage) coated
paper supply chains. In the case of fully integrated mills, the pulp and paper are produced at the same location,
thereby eliminating the need to transport pulp from distant locations. In the case of the Chinese coated paper
industry, in many instances, pulp is imported from around the world by container ship to the paper mill, and finally
back to the US consumer market.
Method
The large number of facilities dispersed around the globe complicates estimates of transportation emissions,
particularly for China’s industry. The specific elements of the methods used are detailed in two sections below.
The basic approach is to first estimate the distances that various quantities of pulp and finished paper travel. A
weighted average model is created using a Geographic Information System (GIS) to estimate the likely (total)
distance that pulp is traveling from mills to papermaking facilities. A similar weighted average approach is applied
to assess the distance that finished paper travels from papermaking facilities to the U.S. consumer. Distances are
further classified by likely mode of transportation (ship, rail, and truck). Emission factors are applied once the
mass, distance, and modes of pulp and paper moving in the supply chain have been estimated. All results are
expressed in metric ton of finished paper.
Method to calculate distances
Using weighted averages based upon inputs to production, the import structure, and known pulp production
around the world, we built a model to estimate what the journey looks like for a metric ton of coated paper made
in China. Generating this model has four basic steps:
1. Identify the fiber input sources of China’s major coated paper mills
Data compiled from Cornerstone provide information for the fiber inputs of each paper mill. As pulp from
domestic versus imported sources was not provided in these flow sheets, the model uses existing (aggregate)
data of domestic production versus imports of pulp for China. As with the forestry and energy emissions
models, figures were derived by mirroring the proportion of domestic to imported pulp for the paper industry
in China as a whole.
21
2. Determine the specific sources of imported and domestic pulp
To determine the country origin of the imported pulp, 2007 World Trade Atlas data for BSKP and BHKP was
used (see figures 1.5 and 1.6). The small residual in the “other category” was allocated equally to all the major
importers for each type of pulp. To determine the specific origin of the pulp in each country, relative
proportions were allocated to the major pulp mills in these countries, using data provided in Cornerstone.
More specifically, the model weights the pulp production within each country by pulp mill, and assumes that
the imported pulp is allocated in proportion to production for each mill. Using the same Cornerstone pulp mill
data, the process to determine the location of domestic Chinese pulp fraction was essentially the same.
3. Calculate the distance (by mode of transport, including ship, rail, and truck) from each pulp mill to each
Chinese coated paper mill
To estimate these distances, the exact longitude and latitude for the 116 pulp mills and the 11 Chinese paper
mills was identified using a batch Geocoder (www.batchgeocode.com). Then the distances from each of these
pulp mills to each of the paper mills were calculated, resulting in more than 1200 possible route variations.
Finally, the distance from each of the Chinese paper mills was calculated to a final consumer destination (i.e.,
printing/distribution center). These distances were calculated using a suite of tools, including Google Map and
a web tool (www.netpas.net) that allows the user to input origin and destination ports to calculate shipping
routes and distances. If a mill was located less than 250 miles from a marine port or final destination mill,
then truck was assumed to be the land transport mode of choice, if more than 250 miles, then rail was the
assumed mode. The consumer end point was calculated as arrival at the Port of Los Angeles. Los Angeles was
chosen as a representative destination for U.S. consumers. It is likely to be conservative with respect to the
difference in transportation emissions between the Chinese and U.S. (NewPage) industries. This is because
NewPage facilities are located primarily in the Midwest and East Coast, so Los Angeles is among the longest
distances that NewPage paper travels to reach a major U.S. consumer market.
4. Calculate the total average weighted distance for delivery in the U.S.
Average distances for delivery of coated freesheet paper from China in each of the consumer markets were
calculated by using a weighted average. Distances for BHKP and BSKP (already weighted by country and pulp
mill) were weighted by their use in each paper mill, and the distance from each paper mill to U.S. markets was
weighted by the total production of each paper mill as a share of overall production of coated freesheet
paper. We created an analogous (weighted) model for the NewPage supply chain for delivery from paper
mills to Los Angeles. In the few instances where pulp is used in the NewPage supply chain; we were able to
identify the specific pulp and paper mills involved, so we calculated distances from pulp mills to the paper
mills.
Method to estimate carbon dioxide emissions
It is perhaps obvious from the long distances that pulp and finished paper travel through the Chinese industry’s
supply chain, and on to the U.S. consumer market, that carbon emissions from transportation would be higher
relative to paper produced in the U.S. Also, previous studies, focusing on integrated production, have shown
transportation emissions to be small relative to other lifecycle phases (Gower, 2006). However, it is not clear how
significant the extended supply chain, drawing pulp from around the world, would be in increasing emissions for
22
Chinese coated paper, relative to the differences in carbon dioxide emissions identified below for the energy
consumed in pulp and paper production. The procedure required to calculate the magnitude of differences in
transportation emissions includes four basic sequential steps, detailed below:
1. Determine the total mass of pulp and finished paper, by distance and mode.
The distance calculations for each supply chain, as described above, were embedded in a model to
calculate the mass of pulp and finished paper moving by mile and mode. Again, this is modeled as a
weighted average for each mill in China based on known trade statistics and pulp and paper mill outputs.
The same procedure is employed using weighted averages from RISI flowsheets for the U.S. (NewPage)
supply chain. The only exception is that the small amount of pulp imported for the U.S. (NewPage) supply
chain is traced to specific pulp mills based on actual data. For each paper mill in both supply chains, the
model calculates the amount of the pulp or paper and the distance it is being moved to the Los Angeles
consumer market by shipping mode (truck, rail and ship).
2. Calculate energy by mode and fuel types.
Once the amount (mass) of material moving and distances are known, then the materials in the supply
chain are multiplied using factors developed by the Interface Corporation as part of the U.S.
Environmental Protection Agency’s SmartWay Transport program to obtain estimates of the energy
required.
3
These factors provide the average energy intensity for freight being moved by various modes.
The factors for tractor-trailer, rail, and ocean freighter (residual or bunker fuel) were selected to apply to
distances for each mode. Resulting calculations give an estimate of the energy in British Thermal Units
(BTU’s) used to move the material in the supply chain. For a summary of factors used for energy and
emissions see Table 2.1.
Table 3.1 Energy and Emission factors by Transport Mode
Transport
Mode
Energy
(BTU/ton mile)
Carbon Dioxide
(lbs/million BTU)
Ship
190
174
Truck
1,945
162
Rail
514
162
3. Apply emission factors for fuel types.
To move from energy consumed by each shipping mode to emissions estimates, the model used emission
factors that track the emission per unit of energy from the burning of various fuel types. These factors
track emissions from combustion of fuels in engines of vehicles and ships (i.e., the “pump to wheel” or
“pump to propeller” portion of the fuel cycle). The emission factors for carbon dioxide are taken from the
U.S. Energy Information Administration (EIA) at the Department of Energy (voluntary carbon reporting
program).
4
The factor for distillate fuel (No. 2 diesel fuel) was used for energy consumed by trucks and
3
see accessed on May 1, 2008
4
See www.eia.doe.gov/oiaf/1605/coefficients.html, accessed on May 1, 2008
23
trains and the factor for residual fuel (No.’s 5 and 6, or bunker fuel) was used for energy consumed by
ships. After summing estimated annual emissions for each supply chain, the emissions figure was divided
by the annual production total to give carbon dioxide per finished metric ton.
One important note about this method is that these estimates are not transparent with respect to differences in
transportation technologies (e.g., vehicles, fuel composition, etc.) between the U.S. and China or for that matter
any of the many nations producing pulp for the paper mills in China. Data were not available to track these factors
independently for truck and rail transport for China and the numerous countries serving its supply chain. Thus, the
technology levels in the energy and the emission factors are averages based on recent U.S. estimates. For all the
regions—U.S., China, and the major pulp producing countries—estimates are based upon the same emission
factors, derived from a mix of U.S. technologies. The main value of the analysis is that it tracks differences that
result from the combination of distance, mass and mode of transportation in each facility’s supply chain.
Some differences in efficiencies or emissions may exist, especially from truck or rail fleets across the countries in
the supply chain. However, it seems unlikely that these differences are large since regulatory controls for carbon
dioxide are only now emerging. As regulations are adopted, increased differences may be seen if fleet efficiencies
or fuel types vary significantly among the countries.
Results
The difference in distances traveled by pulp and paper in the supply chain for China’s industry, and for the U.S.
(NewPage) supply chain turned out to be striking. Pulp in the Chinese supply chain takes a long journey before it
reaches the papermaking plant in China. As an average for all facilities in China’s supply chain, BHKP travels about
118 miles by truck, 705 miles by rail, and 4,579 miles by ship from the pulp plant to the papermaking facility. After
production is finished, the paper travels around 7,000 miles to reach U.S. consumers in Los Angeles. For the U.S.
supply chain, only a small amount of pulp (BSKP) travels from Canada to reach mills in the upper Midwest. These
pulp mills are located about 1,500 miles from the paper mills. (The short distances that most fiber travels from
forest to the integrated mill and the distance from forest to pulp mill are not factored into the transportation
emissions in either supply chain.) As NewPage’s coated paper mills are located mostly in the upper Midwest and
to a lesser extent the Northeast, the weighted average distance for finished paper to Los Angeles (by rail) is 2,425
miles.
Carbon dioxide emissions from transportation of pulp and finished paper in the Chinese industry’s supply chain
are about 187 Kg for each finished metric ton. Due to the long distance to Los Angeles, much of these emissions
come from shipping finished paper to the U.S. Emissions from importing pulp from around the globe are
significant, but less than for transportation of the finished paper. These emissions are about eight times higher
than NewPage’s estimated carbon dioxide emissions of about 23 Kg for each finished metric ton. However,
relative to the estimate below for carbon dioxide emissions in pulp and paper production, transportation emissions
are a very small part of the carbon burden of coated freesheet paper. This is true even for the highly dispersed
supply chain feeding China’s industry. Thus, this finding is generally consistent with other studies of paper life
cycles.