Biodegradation and viability of chitosan-based microencapsulated fertilizers
Bạn đang xem bản rút gọn của tài liệu. Xem và tải ngay bản đầy đủ của tài liệu tại đây (3.79 MB, 9 trang )
Carbohydrate Polymers 257 (2021) 117635
Contents lists available at ScienceDirect
Carbohydrate Polymers
journal homepage: www.elsevier.com/locate/carbpol
Biodegradation and viability of chitosan-based
microencapsulated fertilizers
Luciana Moretti Angelo a, Debora Franỗa a, b, Roselena Faez a, b, *
a
b
Laboratory of Polymeric Materials and Biosorbents, Federal University of S˜
ao Carlos, UFSCar, 13600970, Araras, SP, Brazil
Graduate Program in Materials Science and Engineering, University of S˜
ao Paulo, USP- FZEA, 13635900, Pirassununga, SP, Brazil
A R T I C L E I N F O
A B S T R A C T
Keywords:
Bartha’s respirometric
Clay
KNO3
Sustainable agriculture
Enhanced efficiency fertilizers (EEF) are an important subject for sustainable materials. It is fundamental for the
released nutrient and biodegradation in the soil to have synergy to ensure material harmlessness. Chitosan,
montmorillonite, and KNO3 were considered to develop the EEF because of the high biodegradation potential of
the final product. We correlated the material biodegradability and release in water and soil to their formulation.
We assume the materials are biodegradable since the biodegradation efficiency achieved over 30 %. As the
nutrient diffusion and matrix degradation happen concomitantly, we also observed that the clay delays degra
dation and the KNO3 improved it. Likewise, the storage period can change the biodegradability properties once
the material started to degrade. Hereupon, the amount of nutrient delivered will match the amount consumed by
the plant, the matrix will degrade and no residue will be left in the soil.
1. Introduction
Currently, agriculture has the problem of excess fertilizers, pesti
cides, and growth regulators left in the soil. These agrochemicals are
used to enhance the plant development and, usually, placed in quantities
higher than necessary to compensate the losses through volatilization,
solubilization, or leaching into the soil (Chen et al., 2018; El Assimi
et al., 2020). Studies have been performed to improve fertilization ef
ficiency using chemical modification or physical coating to reduce
nutrient waste (Shaviv & Mikkelsen, 1993). Some requirements for the
ideal enhanced efficiency fertilizer (EEF) are the compatibility between
the nutrient release and the absorption by the culture, the biodegrad
ability of the coating material, and the cost-effectiveness of the product.
However, the EEFs are difficult to obtain due to the nutrient coating
process. The matrix composition and the need for chemical and physical
modification are important points to consider during the EEF develop
ment (Chen et al., 2018). Consequently, a bio-based and biodegradable
matrix for fertilizers is the interest of many research (Chen et al., 2018;
El Assimi et al., 2020; Lubkowski & Grzmil, 2007; Pandey, Kumar
Verma, & De, 2018). Chen et al. (2018) list chitosan, alginate, starch,
cellulose, lignin, agricultural residues, biochar, and polydopamine as
the most used materials for the fertilizer coating. Although they comply
with the prerequisites already mentioned, there are some disadvantages,
for example, chitosan, has the potential to be used as a fertilizer coating
matrix as it is cheap, biodegradable, and renewable (Chen et al., 2018;
Lubkowski & Grzmil, 2007; Pandey et al., 2018), besides having anti
microbial properties (Pandey et al., 2018). However, it has the disad
vantage of usually being soluble in acid, and for chitosan to be soluble in
water, it needs an expensive preparation, which would result in an
expensive fertilizer, and therefore, raising the chances of market refusal
(Chen et al., 2018). Chen et al. (2018) also concluded that the greatest
difficulty in preparing efficient fertilizers is to maintain the nutritional
supply in the phase of most need, which is the growth phase. The burst
effect occurs when most of the nutrient releases during the initial period
of the tests. To reduce the burst effect, some researchers had added
montmorillonite clay to chitosan materials, which promotes a slowdown
in the water diffusion (El Assimi et al., 2020) and can delay the nutrient
release (Franỗa, Medina, Messa, Souza, & Faez, 2018).
Given these considerations, our research group has been focusing on
the structure-properties understanding of matrices formulations to be
efficient in terms of nutrient release and biodegradability, based on
materials that meet the necessary prerequisites, such as potassium ni
trate fertilizer (KNO3) encapsulated with chitosan and montmorillonite
clay (Franỗa et al., 2018; Messa, Souza, & Faez, 2020; Santos, Bacalhau,
* Corresponidng author at: Laborat´
orio de Materiais Polim´ericos e Biossorventes, Departamento de Ciˆencias da Natureza, Matem´
atica e Educaỗ
ao, Universidade
Federal de S
ao Carlos, Rod. Anhanguera, km 174 - SP-330, P.O. BOX 153, 13600-970, Araras, S˜
ao Paulo, Brazil.
E-mail address: (R. Faez).
/>Received 5 September 2020; Received in revised form 1 December 2020; Accepted 9 January 2021
Available online 16 January 2021
0144-8617/© 2021 Elsevier Ltd. This article is made available under the Elsevier license ( />
L.M. Angelo et al.
Carbohydrate Polymers 257 (2021) 117635
Pereira, Souza, & Faez, 2015).
Chitosan (CS) is a bio-based polymer, abundant, and renewable on
earth, with high biocompatibility, biodegradation and easy to obtain
from the chitin deacetylation. Chitin is a polysaccharide present in the
exoskeletons of crustaceans, insects and fungal mycelia. The chitin
deacetylation process consists of removing the acetyl branch from the
compound, which results, predominantly, in 2-amino-2-deoxy-D-gluco
pyranose units. However, deacetylation is not complete, and it is
necessary to have a deacetylation percentage of 60 % or more to
ˆme, 2013). Clay is also a natural
consider it as chitosan (Croisier & J´ero
and abundant material on the earth. Montmorillonite clay is structured
by lamellae composed of silicate groups (Si-O) and aluminum (Al3+) that
can be replaced by magnesium (Mg2+). This provides the negative
character on the lamellae and the load is balanced by the presence of
cations, hydrated or not, in these interplanar spaces (Coelho, Santos, &
Santos, 2007). Thus, the cationic exchange between the lamellae,
without any structural modification, can help the retention of K+ and
slow the release of the ions, reducing the burst effect. Potassium nitrate
was used as a fertilizer because it is a source of nitrogen and potassium.
Nitrogen is a limiting factor for plant growth and important for the
absorption of other elements such as potassium. The nitrate form is
preferred because it is absorbed by most plant species, even though, it is
also the form most susceptible to leaching (Moreira & Siqueira, 2006;
Ueda, Konishi, & Yanagisawa, 2017). Potassium, one of the most
important macronutrients, is associated with the immune system and
avoids plant stress caused by adversities when there are adequate
quantities (Sustr, Soukup, & Tylova, 2019).
CS, MMt, and KNO3 have been considered to develop enhanced ef
ficiency fertilizers because it is possible to reach a high biodegradation
potential in the final product. Those are eco-friendly materials and
chitosan is a polysaccharide susceptible to physical and chemical
decomposition actions promoted by microorganisms. The higher
biodegradation of the chitosan is caused by the enzymatic activity,
which can be degraded into smaller, non-toxic oligosaccharides (Crois
ˆme, 2013). These properties are of interest, considering an EEF
ier & J´ero
coated with chitosan and MMt that will be biodegraded by the micro
organisms present in the soil when the nutrient release occurs. As a
result, these EEFs can avoid the overuse of nutrients and the residues of
the coating into the soil.
Franỗa et al. (2018) have processed the CS, MMt, and KNO3 together
using the spray-drying technique because of the advantages of obtaining
a material quickly, with great reproducibility and productivity. The
equipment parameters were essential to promote good reproducibility
and these were configured using the 3-fluid atomizer nozzle for the
formation of microcapsules, shell-core structures (Franỗa et al., 2018).
The formulations were evaluated for nutrient release in water and soil.
The CS has great water retention potential that allows the swelling of the
chitosan matrix and affects the nutrient release mechanism. Franỗa et al.
(2018) have concluded the release behavior is a swelling-controlled
transport, which means the CS microcapsule swells and then releases
the KNO3 from the core (Franỗa et al., 2018). They have also observed
that adding MMt clay in the formulation, delayed the nutrient release,
and decreased the swelling degree. However, as in many studies, they
did not evaluate the biodegradation of the material. To overcome this
lack of information in the literature, the present work seeks to quantify
the biodegradation and understand the chitosan biodegradation mech
anism in the presence of clay and KNO3.
The microbial activity provides carbon dioxide release due to aerobic
metabolism and substrate degradation. Other factors as temperature,
pH, oxygen concentration, luminosity, and humidity, also allow
biodegradation, by stimulating the development and growth of micro
organisms’ colonies (Moreira & Siqueira, 2006). Taking into account
these factors, it is possible to evaluate the polymer biodegradation
profile from the amount of carbon dioxide released in a closed and
controlled system. The biodegradation assessment was based on the
respirometry test standardized by the NBR14283 (Brazilian standard by
˜o Paulo State based on the
the Environmental Protection Agency of Sa
o Brasileira de Normas Tecnicas, ABNT, 1999;
ASTM D5988) (Associaỗa
"Standard Test Method for Determining Aerobic Biodegradation of
Plastic Materials in Soil,” 1989). Therefore, it was possible to quantify
the carbon dioxide produced through spontaneous chemical reactions
and evaluate the material biodegradability according to their formula
tion modifications and the influence of inorganic compounds on this
process. Another point to be considered in this work is the storage time
effect. Franỗa et al. (2018) also observed the color change and charac
teristic smell during the storage period, which could be attributed to the
degradation of these materials. Regarding this, the biodegradation
evaluation was also redone after 3 months with the stored material to
assess the feasibility of stocking it in powder form rather than the ma
terial just after being processed, and to verify the difference in the
biodegradation performance.
We hypothesize that the CS-based EEF is biodegradable and depen
dent on clay and, encapsulated nutrients. Also, we argue that the EEF
provides the nutrients needed for plants as it is degraded.
2. Experimental
2.1. Materials
Chitosan powder (C6H11O4)n (Polymar S/A, 85 % deacetylation
degree and average molar mass 1.8.105 g mol− 1(Santos et al., 2015)),
Glacial acetic acid 99 % (Synth− Brazil), Fertilizer based on potassium
nitrate (Saltpetre Krista K (KNO3) Yara Brazil Fertilizantes S.A., Brazil),
Sodium montmorillonite clay (Brasgel Aỗo A granted by Bentonit
Union, CTC 85 mmol/100 g clay). All reagents were used with any prior
purification.
2.2. Preparation and characterization of the EEF
The materials for biodegradation analysis were processed according
to Franỗa et al. (2018) in the Spray Dryer using the 3-fluid atomizer
nozzle, in order to have microcapsules (a core-shell structure). The core
is based on CS, MMt and KNO3 (CSMMtKNO3) and the shell CS-based
(CS). Briefly, shell solutions were based on 2 g of CS dissolved into
100 ml of acetic acid 2 % (v/v). The core of CS/KNO3 was prepared with
40 g of KNO3 added to a solution of 1 wt.% of CS. For CSMMtKNO3,
montmorillonite clay was previously soaked with some drops of water
and KNO3 (1:3 MMt:KNO3 mass ratio), ground and mixed in a mortar for
10 min and then dried at 80 ◦ C for 2 h. Next, the MMt:KNO3 was added
to chitosan solution and stirred for 5 min under Turrax homogenizer at
10,000 rpm. The Spray Dryer parameters were 3-fluid nozzle, Ø =2.80
mm (extern Ø =2.0 mm/intern Ø =0.7 mm), inlet temperature at 180
◦
C, aspirator 100 %, airflow around 670 Lh− 1, outer flow at 10 mL.
min− 1 (30 %) and inner flow at 1 ml.min− 1 (5 rpm). The final percentage
of each component is expressed in Table 1.
The materials were characterized by Fourier transform infrared
spectroscopy (FTIR) in the Tensor II model - Bruker equipment, with the
OPUS software (v. 7.5), with the analysis range between 550–4000 cm− 1
and 32 scans. The diffractometry X-ray analysis (DRX) was performed in
the Rigaku Miniflex 600 model equipment, in the operating condition of
40 kV and 15 mA, and with the analysis range of 2◦ to 90◦ 2θ.
2.3. Biodegradation analysis by the respirometric method
The biodegradation analysis was based on the NBR 14283 standard,
a Brazilian normative standardized by the Environmental Protection
˜o Paulo State (Associaỗ
Agency of Sa
ao Brasileira de Normas Tecnicas,
ABNT, 1999), which determines biodegradation by the respirometry
method using Bartha’s respirometer. This technique measures the mass
of carbon dioxide (CO2) produced during the degradation of organic
materials. In this closed system, the microorganisms of the soil will
absorb the carbon from the polymeric material and release carbon
2
L.M. Angelo et al.
Carbohydrate Polymers 257 (2021) 117635
Table 1
EEF materials formulations and the amount of material for biodegradation analysis.
Materials
CS (%)
Clay (%)
KNO3 content (%)
Amount of CS for biodegradation (g)*
CS
100
–
–
0.20
CSMMt
86.3
13.7
–
0.23
CSKNO3
50
–
50
0.40
CSMMtKNO3
50
12.5
37.5
0.40
Illustration
(initial solution concentration)
*
Those quantities are different because 0.2 g of polymer was considered in each formulation in order to have the same amount of polymeric material to be degraded
during the test.
dioxide through respiration. In this study, the source of carbon is the
chitosan-based material.
The soil used in the tests was the red latosol from UFSCar- Araras
(latitude 22◦ 18′ S, longitude 47◦ 23′ W). According to ABNT-NBR 14283,
the field capacity should be between 50–70 % and it was established at
60 % by previous works in the group, so 17.2 mL of water is needed for
every 50 g of red latosol. The materials were mixed with the soil and the
control test was the soil without any materials. The newly processed and
3-months stored (3-MS) material were evaluated to compare the storage
effect on material degradation. The amount of 0.2 g, referred to as the
CS, used in the test was based on previous analyzes (Franỗa et al., 2018)
which determined the percentage of the components on the developed
materials, Table 1. The system was oxygenated with an air pump and
sealed with an ascarite filter and stoppers to avoid gas exchange be
tween the system and the external environment. The carbon dioxide
produced by microbial activity will react with the 10 ml of KOH (0.2 M)
placed in the attached flask, according to the chemical reaction (Eq. 2).
CO2 + KOH → K2CO3 + H2O
profile of the materials in the soil. The evaluation was performed in
three replicates.
The biodegradation efficiency was calculated considering the
amounts of carbon produced from CO2 released during the test, and the
amount of carbon (from polymer) added to the soil. First, we have
theoretically calculated the carbon amount in the 0.2 g of polymer,
considering the 85 % deacetylated CS. Eq. (5) was used to determine the
values of carbon produced where Cb is the carbon mass produced by the
material biodegradation, mg CO2 soil residue is the sum of the mass of CO2
produced, mg CO2 soil control is the sum of the mass of CO2 produced in
the control test, and 12/44 is the conversion factor from mg CO2 to mg
Carbon.
Cb = (mg CO2
KOH + HCl → H2O + KCl
(4)
soil control).
12/44
EB (%) = Cb / Cl.100 (6)
(5)
(6)
where EB is the biodegradation efficiency, Cb is the mass of Carbon
produced by the material biodegradation, and Cl is the mass of the
theoretical carbon amount in the material applied to the soil at the
beginning of the test.
Daily CO2 values obtained from the biodegradation activity were
analyzed with a one-way ANOVA (analysis of variance). Tukey test was
used to qualify the differences. The difference in the average CO2
emitted daily by the different materials was analyzed and statistically
significant differences were accepted when p < 0.05.
The solution on the attached flask was periodically removed and
titrate to quantify the amount of CO2 produced. The reaction inside the
closed system is spontaneous: the production of carbon dioxide by mi
croorganisms and the reaction between CO2 and KOH. To perform the
titrations, barium chloride was added to the potassium carbonate/water
solution to precipitate barium carbonate. Therefore, the KOH that
remained unreacted, was neutralized, by titration, with 0.1 M HCl so
lution (Eq. 3 and 4).
(3)
- mg CO2
After, we determined the biodegradation efficiency according to
ABNT standard (1999), Eq. (6).
(2)
K2CO3 + BaCl2 → BaCO3 + 2 KCl
soil residue
2.4. Nutrient release profile in water and soil
Alongside the biodegradation behavior evaluation, it is important to
correlate it with the nutrient release (from material to the environment)
to understand how it will behave in the soil and guarantee the
With the titrated HCl values, the amount of carbon dioxide released
was determined. These data were used to determine the biodegradation
3
L.M. Angelo et al.
Carbohydrate Polymers 257 (2021) 117635
harmlessness of the material. During our previous work, the release
behavior was evaluated in water and soil (Franỗa et al., 2018). However,
it lacks a correlation between both the nutrient release profiles and their
biodegradability (shown in the present study). Briefly, 0.2 g of micro
capsules were added to 50 mL of water. The potassium (K+) content
released through time was measured by flame photometry. The solvent
was changed in every measurement, three repetitions and the accumu
lative concentrations were taken to plot the potassium releasing curve.
In the soil medium, 4 g of material was placed into a 10 cm deep hole at
the center of a container with 10 Kg of soil Psamment (sandy Entisol),
classified accordingly (Soil Survey Staff, 1999). Three TDR probes were
placed at 5 cm spacing and named central and lateral (left and right
probes). The containers were soaked with 2.5 L of distilled water, to
reach the soil field capacity. The measurements of electrical conduc
tivity and moisture were performed daily by the TDR1000 Reflectometer
(Campbell Scientific) and PCTDR software. The correlation along with
the nutrient release behaviors and its biodegradability were done by
interpreting data from the respective tests and it is shown and discussed
in this paper.
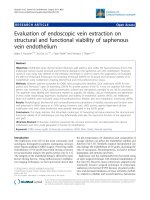
non-modified montmorillonite so it is more difficult for the polymer to
enter the interlamellar space, Fig. 5 (Bari, Chatterjee, & Mishra, 2016; El
Assimi et al., 2020; Rimdusit, Jingjid, Damrongsakkul, Tiptipakorn, &
Takeichi, 2008). Furthermore, MMt particles also restricted the
segmental motion at the interface and decreased the access of micro
organisms to attack the polymer.
Fig. 1.B shows the daily CO2 emission. The first 25 days of the test
demonstrated the peaks of high and low CO2 released which are not
concomitant with each other, as observed after this period. The
CSMMtKNO3 and CSKNO3 displayed a similar cumulative CO2 release
profile (Fig. 1.A). However, CSMMtKNO3 showed the daily CO2 release
curve higher than the CSKNO3 on the first 7 days and, lower on the
following days. This was attributed to the nutrient diffusion through the
polymeric matrix, as the nutrient is released from the microcapsule. The
water molecules and microorganisms have more sites to interact with
the polymeric matrix. At the same time, the microorganisms have their
growth favored by nitrogen (released from the material to the medium).
Meanwhile, the clay acts to delay the degradation as it increases the
crystallinity of the material, reducing the swelling degree of the polymer
and, consequently, reducing the access of water and/or microorganisms
to the hydrocarbon chain to degrade it.
Another point to consider is the higher CO2 production at the
beginning of the test, which could be related to inactive microorganisms
left in the material, and when placed in a favorable environment to
development they reactivate metabolically. Consequently, the control
test is important to state that the difference in CO2 release is related to
the material biodegradation and to consider the interferences of the
natural abiotic and biotic mechanisms on the neat soil. Gonỗalves and
cols. (2002) also considered the control sample on CO2 emission after
the soil re-moistening. They conclude that the inactive microorganisms
restart their metabolic activities and the multiplication of the microbiota
(Gonỗalves, Monteiro, Guerra, & De-Polli, 2002). Also, abiotic activities
related to the neutralization of the pH of the medium can occur,
resulting in the production of CO2. Even with such considerations about
the soil, the CO2 production curves are directly related to the biodeg
radation mechanism, and they can also be associated with microbial
cycles.
The interaction among the components of the microparticles in
terferes with the biodegradation process. Therefore, structure and
morphological (FTIR, XDR, and MEV) analysis were realized and dis
cussed later in the text.
Furthermore, a degradation progression during storage under un
controlled conditions takes place, mainly for microparticles matrix of
chitosan processed with clay. Fig. 2 shows the daily CO2 emission for the
3-months stored (3MS) materials compared to the non-stored. The CO2
release profile of chitosan was similar for both the CS and CS3MS, but
3. Results and discussion
3.1. Biodegradation and CO2 analysis
The CS, CSMMt, CSKNO3 and, CSMMtKNO3 materials, newly pro
cessed and the 3-months stored, were evaluated according to their
biodegradability. Fig. 1 shows the biodegradation profile for 60 days
according to the CO2 emission from the newly processed materials.
Based on the cumulative curve, we observe a similar production of
carbon dioxide up to the 15th day, but at the end of the test, the CS keeps
the highest CO2 release rate, which means higher biodegradability, and
CSMMt the lowest rate, Fig. 1.A. Xu, Yong, Lim, and Obbard (2005)
verified that chitosan enhanced the biodegradability of polycyclic aro
matic hydrocarbons according to their studies of hydrocarbon biodeg
radation in contaminated sediments (Xu et al., 2005). The
biodegradation of the microcapsules can be related to the swelling deư
gree. Franỗa et al. (2018) tested that spray-dried chitosan swells up to
1172 % before solubilizing. They have also verified that for the CSKNO3
the swelling degree decreases to 534 % and for the CSMMtKNO3, it is
under 488 %. As the swelling degree was reduced, its biodegradability
was affected, as it was confirmed here. On the other hand, the clay can
decrease the biodegradation due to the unavailability of the microor
ganism growth in the clay particles reducing its functionality (Perotti,
Kijchavengkul, Auras, & Constantino, 2017). Even though some litera
ture confirmed the presence of clay facilitated the growth of the
microorganism due to the increase of d-spacing, we applied the
Fig. 1. Biodegradation profile of the CS, CSMMt, CSKNO3 and CSMMtKNO3 of (A) cumulative CO2 release and (B) daily CO2 release measurements.
4
Carbohydrate Polymers 257 (2021) 117635
L.M. Angelo et al.
Fig. 2. Biodegradability profile of materials newly processed and stored for 3 months, by daily measurements of CO2 release. (A) CS; (B) CSKNO3; (C) CSMMt and
(D) CSMMtKNO3.
the values for the CSMMt3MS, CSKNO33MS, and CSMMtKNO33MS were
higher than the CSMMt, CSKNO3, CSMMtKNO3, correspondently. This
comparison was done by the accumulated final mass and by the
biodegradation efficiency values (Table 2). Considering the accumula
tive values of CO2 emission of 241.1 and 255.1 mg for the CS and the
CS3MS, respectively, they presented no significant difference in
biodegradation profile after storage time (± 0.87). However, the CO2
emission increased from 144.4–208.4 mg for the CSMMt3MS; the
greatest difference in biodegradation efficiency among the tested ma
terials, from 28.25 % for the CSMMt to 43.28 % for the CSMMt3M
(variation of 15.04). The CO2 emitted increased from 195.2–269.0 mg
for the CKNO33MS, as the biodegradation efficiency increased from
44.92 % to 59.39 %. And finally, the CO2 emission of the CSMMtKNO3 is
altered from 190.0–248.3 mg for the CSMMtKNO33MS and the
biodegradation efficiency increased from 43.22%–53.57%. Since the
polymer was already in the process of degradation, more
microorganisms were developed during the test due to the greater vol
ume of organic matter available. The daily CO2 emission showed the first
measurement was similar for all the formulations, but from the second
one, it increased for the CSKNO33MS and CSMMtKNO33MS, maintain
ing higher levels of CO2 throughout the test period, which are indicators
of the fertilizer effect on degradation during storage. Meanwhile, the
CSMMt matrix showed lower amplitude for biodegradation peaks
compared to the KNO3-based microcapsules and the CS remained with
the same profile in both evaluations.
These findings are corroborated by the analysis of variance
(ANOVA), including F-test and P-values, and Tukey test (Fig. 3). ANOVA
and Tukey test results have shown that there are significant differences
for all materials compared to the control sample, except for the CSMMt
that showed the lower biodegradability. Also, the CSMMt-3MS showed a
biodegradation behavior lower than the other storage materials, even
though they are not significantly different.
Besides the fertilizer effect, other aspects should be considered, i.e.,
the possibility that the degradation started during the microencapsula
tion process, due to the high temperature (180 ◦ C) and pressure which
the material was submitted during the spray drying process. Also, the
acetic acid presence can induce the amorphous domains in the CS after
the material has been dried (Wang et al., 2005). Here, the leftover acetic
acid from the spray-drying process contributed to accelerating CS
degradation.
The higher efficiency values for the stored materials corroborated the
degradation process during storage under uncontrolled conditions and
were attributed to the greater susceptibility of matrix degradation by the
Table 2
Biodegradation efficiency in percentage for newly processed and 3-months after
storage samples.
Sample
Biodegradation
efficiency (%)
Sample
Biodegradation
efficiency (%)
CS
CSKNO3
CSMMt
CSMMTKNO3
59.88
44.92
28.25
43.22
CS-3MS
CSKNO3-3MS
CSMMt-3MS
CSMMTKNO33MS
59.01
59.39
43.29
53.57
± 1,22
± 5,29
± 0,97
± 13,44
± 7,17
± 0,09
± 2,77
± 4,81
5
L.M. Angelo et al.
Carbohydrate Polymers 257 (2021) 117635
and the nutrient was completely released. Regarding the nutrient release
in water (Fig. 4. C–D), the KNO3 released reached a plateau after two
hours, indicating the nutrient was released. Hence, we suggest the
relationship of water-soil, which means a one-hour release in the water
is equal to 20 days in soil.
Therefore, we can state a relationship comparing the release profile
in water and soil and the biodegradation curves (Fig. 4). For example,
we observed 40 % of nutrients released in water in the first measurement
for the CSKNO3 (Fig. 4.C) and low mobility of the ions in the soil (Fig. 4.
A). However, the CSMMtKNO3 shows the same nutrient release profile in
water as the CSKNO3 (Fig. 4.D) but differs in nutrients soil release
(Fig. 4.B) and biodegradation profile (Fig. 4.F). In soil, the ionic mobility
was low and suggests a faster nutrient release. This can be justified by
the presence of clay already in the soil, which can exchange cations with
the nutrients from the fertilizer and also with the water ions from irri
gation, trapping those ions and giving lower conductivity signals on the
TDR probe measurements. The biodegradation of the CSMMtKNO3 dis
played an accentuated peak at the second measurement, while the
CSKNO3 sample showed the first peak accentuated. The biodegradation
test describes the biotic activity by quantifying the CO2 emission as the
microorganisms degrade the material. The first peaks of biodegradation
were a result of the high biotic activity consuming the nutrient released
and the polymeric matrix, after 25 days it is only due to matrix degraư
dation. Franỗa et al. (2018) have shown the nutrient release mechanism
was swelling controlled for chitosan-based fertilizer, depending on the
humidity to swell the matrix and then release the nutrient to the envi
ronment. The matrix swelling mechanism also had an important effect
on the degradation as it aids the polymer chain relaxation allowing the
microorganisms access to the matrix sides and degrades it.
Fig. 3. The ANOVA and Tukey Test for a significant difference in the level of
biodegradability.
microorganisms compared to the non-stored material. The stored ma
terials started to degrade during the storage period, which can affect its
ability to retain and release the nutrient in a programmable way. In such
a way, the microorganisms were able to consume the fertilizer matrix
more quickly, which caused an increase in the amount of fungi, which
were visualized with the naked eye and confirmed with the analysis
described here. According to the NBR 14,283 standard, the material
should be considered biodegradable when the biodegradation efficiency
is over 30 %. In this sense, all materials, except the CSMMt, are
considered biodegradable materials (Table 2).
3.3. Structural and morphological analysis of materials
Fig. 5 shows the SEM images of the CS, CSKNO3, and CSMMtKNO3;
the FTIR spectra and XRD diffractograms for all net components and
microcapsules. The morphology of the CS, CSKNO3 and CSMMtKNO3 are
spherical and smooth, suggesting that the material has been encapsu
lated, as it was expected for spray-dried materials. The FTIR spectrum of
CS displayed the following bands at 3415 cm− 1, attributed to the O–H
– O due to the
bond, at 1637 cm− 1, the characteristic vibration of C–
acetyl groups on the polymer chain, at 1559 cm− 1 due to the secondary
amine, and the CH3 molecular bonds vibrate at 1381 cm− 1. The MMt and
KNO3 spectra showed the characteristic bands of O-Si-O vibrate at 472
cm-1 and of N–O bond at 1389 cm− 1. The CSKNO3 maintained the most
bands of CS, but it was overlapped at 1389 cm− 1 due to the N–O bond
from the KNO3. For the CSMMt, the band attributed to the silicate
remained stronger than others. For the CSMMtKNO3, the spectral
characteristics vibration of N–O and silicates were observed but new
bands were not displayed, suggesting the lack of chemical interactions.
The XRD curves show the CS peaks at 2θ = 15◦ and 22◦ due to the
crystalline structures (020) and (110). The XRD peak at 2θ = 6◦ for the
MMt is referring to the basal interlayer spacing (001). For the KNO3, the
characteristic crystalline peaks appear at 2θ = 23 and 28 (Franỗa et al.,
2018; Santos et al., 2015). The CS characteristic peaks were observed in
all microcapsules. However, after adding the KNO3, the peak around 2θ
= 22◦ narrowed, though the others remained the same. Also, for the
CSMMtKNO3 we observed a peak displacement at 2θ = 6.0◦ to 7.24◦ due
to the increase in the lamellar distance, evidencing the ion exchange
between the cations K+, from the potassium nitrate, and Na+, from the
interlamellar space of montmorillonite clay. The new peaks at 2θ = 30◦
and 41◦ , attributed to the NaNO3, corroborate this statement (Franỗa
et al., 2018). By comparing the XRD pattern of the CS and CSMMt, we
observed amorphous characteristics of the CS corroborating the higher
CO2 emission during the biodegradation test. Amorphous materials are
easier for microorganisms to access and degrade than crystalline ones.
Thus, we can assume that the MMt plays a role in delaying the biode
gradability and keep the nutrient longer within its interlayers.
3.2. Correlation between the nutrient release behavior and the
biodegradability profile
As previously stated, the correlation along the nutrient release pro
files in water and soil added to the biodegradation behavior is important
to predict how harmless those materials will be to the environment. To
better understand how we have correlated these three different tests,
follow a brief explanation of measurements of electrical conductivity
and moisture by TDR probes.
Time Domain Reflectometry (TDR) determines the dielectric con
stant by measuring the propagation time of electromagnetic waves, sent
from a pulse generator of a cable tester immersed in a medium (in our
case, the soil). Electromagnetic waves propagate through a coaxial cable
to a TDR probe, which is usually a rod, made of stainless steel or brass.
Part of an incident electromagnetic wave is reflected at the beginning of
the probe because of the impedance difference between the cable and
the probe. The remainder of the wave propagates through the probe
until it reaches the end of the probe, where the wave is reflected. The
round-trip time (t) of the wave, from the beginning to the end of the
probe can be measured by a sampling oscilloscope on the cable tester.
Placing probes in the container where the material was being tested
allows us to measure the ion mobility as the nutrient is released.
The ionic mobility of the nutrient was calculated according to the
difference in conductivity values between the central and lateral probes
(λ). We assume that the higher conductivity value in the central probe is
related to a higher ionic concentration (nutrient) due to their concen
tration near the central probe.
On the other hand, similar conductivity values of probes indicate
higher ion mobility, i.e., the nutrient deposited near the central probe
was dislocated to the extremities so the readings of the probes were
identical. After 40 days, the conductivity difference between the central
and lateral probes was constant for all materials as it reached the plateau
(Fig. 4. A–B). The ionic mobility was similar for all probes measurements
6
L.M. Angelo et al.
Carbohydrate Polymers 257 (2021) 117635
Fig. 4. Correlation along with the nutrient release in (A-B) soil, in (C-D) water, and (E-F) the biodegradation behavior for the (left) CSKNO3 and (right) CSMMtKNO3.
4. Conclusion
Therefore, the composition of the material can be designed to focus on
how much longer the nutrient should be delivered and when the
biodegradation should start.
The chitosan-based microencapsulated fertilizer materials have great
potential for the improved efficiency of fertilizers as it has biodegrad
able properties discussed in this paper, low-cost coating and an efficient
nutritional release capacity. However, there are many factors affecting
material degradation and they need to be considered: (i) different
formulation has different biodegradation behavior. The inorganic
components MMt reduced the biodegradability of the polymeric matrix
as it increased the crystallinity of the material, but, the nutrient KNO3
facilitated biodegradation; (ii) nutrient diffusion and matrix degrada
tion happen concomitant, so the matrix swelling mechanism is impor
tant; (iii) the storage period should be considered since the material
started to degrade, affecting its release and biodegradability properties.
Credit author statement
Luciana Moretti Angelo: Methodology, Data curation, Investigation,
Writing - original draft.
D´ebora Franỗa: Methodology, Data curation, Formal analysis,
Investigation, Writing - original draft, Writing - review & editing.
Roselena Faez: Conceptualization, Funding acquisition, Project
administration, Resources, Supervision, Writing - review & editing.
7
L.M. Angelo et al.
Carbohydrate Polymers 257 (2021) 117635
Fig. 5. SEM images of (A) CS, (B) CSKNO3, and (C) CSMMtKNO3; (D) DRX; (E.1) FTIR and (E.2) Enlarged FTIR graphs for all components and materials.
Declaration of Competing Interest
equipment from the Soil Physics Laboratory. Also, we kindly thank the
members of the research group Lab-MPB and Prof. Dr. Adriana Campos
for the suggestions to improve the methodology used and the discussion
of the results. R.F is a CNPq researcher.
The authors declare that they have no conflicts of interest.
Acknowledgments
References
The authors are grateful to CAPES andFAPESP-Brazil [grant num
ber2017/24595-4 and2019/02535-5] for financial support, Bentonit
˜o for supplying the clay and Laboratory of Structural Character
Unia
ization (LCE/DEMa/UFSCar) for microscopy analyses. Thank you to
Prof. Dr. Claudinei Fonseca dos Souza for ceding the space and
Associaỗ
ao Brasileira de Normas Tecnicas, ABNT. (1999). NBR 14283: Resớduos em solo
Determinaỗ
ao da biodegradaỗ
ao pelo metodo respirometrico (pp. 18).
Bari, S. S., Chatterjee, A., & Mishra, S. (2016). Biodegradable polymer nanocomposites:
An overview. Polymer Reviews, 56(2), 287–328. />15583724.2015.1118123
8
L.M. Angelo et al.
Carbohydrate Polymers 257 (2021) 117635
mechanical properties and biodegradability in simulated compost soil. Journal of the
Brazilian Chemical Society, 28(4), 649–658. />Rimdusit, S., Jingjid, S., Damrongsakkul, S., Tiptipakorn, S., & Takeichi, T. (2008).
Biodegradability and property characterizations of Methyl Cellulose: Effect of
nanocompositing and chemical crosslinking. Carbohydrate Polymers, 72(3), 444–455.
/>Santos, B. R. dos, Bacalhau, F. B., Pereira, T. dos S., Souza, C. F., & Faez, R. (2015).
Chitosan-montmorillonite microspheres: A sustainable fertilizer delivery system.
Carbohydrate Polymers, 127, 340–346. />carbpol.2015.03.064
Shaviv, A., & Mikkelsen, R. L. (1993). Controlled-release fertilizers to increase efficiency
of nutrient use and minimize environmental degradation - A review. Fertilizer
Research, 35(1–2), 1–12. />Soil Survey Staff. (1999). Soil taxonomy. A basic system of soil classification for making and
interpreting soil surveys (pp. 1–886). USDA.
Standard Test Method for Determining Aerobic Biodegradation of Plastic Materials in
Soil. (1989). ASTM international. />Sustr, M., Soukup, A., & Tylova, E. (2019). Potassium in root growth and development.
Plants, 8(10), 435. />Ueda, Y., Konishi, M., & Yanagisawa, S. (2017). Molecular basis of the nitrogen response
in plants. Soil Science and Plant Nutrition, 63(4), 329–341. />00380768.2017.1360128
Wang, S. F., Shen, L., Tong, Y. J., Chen, L., Phang, I. Y., Lim, P. Q., et al. (2005).
Biopolymer chitosan/montmorillonite nanocomposites: Preparation and
characterization. Polymer Degradation and Stability, 90(1), 123–131. />10.1016/j.polymdegradstab.2005.03.001
Xu, R., Yong, L. C., Lim, Y. G., & Obbard, J. P. (2005). Use of slow-release fertilizer and
biopolymers for stimulating hydrocarbon biodegradation in oil-contaminated beach
sediments. Marine Pollution Bulletin, 51(8–12), 1101–1110. />j.marpolbul.2005.02.037
Chen, J., Lü, S., Zhang, Z., Zhao, X., Li, X., Ning, P., et al. (2018). Environmentally
friendly fertilizers: A review of materials used and their effects on the environment.
The Science of the Total Environment, 613–614, 829–839. />scitotenv.2017.09.186
Coelho, A. C. V., Santos, P.de S., & Santos, H.de S. (2007). Argilas especiais: Argilas
quimicamente modificadas - uma revis˜
ao. Química Nova, 30(5), 1282–1294. https://
doi.org/10.1590/S0100-40422007000500042
Croisier, F., & J´erˆ
ome, C. (2013). Chitosan-based biomaterials for tissue engineering.
European Polymer Journal. />El Assimi, T., Lakbita, O., El Meziane, A., Khouloud, M., Dahchour, A., Beniazza, R., et al.
(2020). Sustainable coating material based on chitosan-clay composite and paraffin
wax for slow-release DAP fertilizer. International Journal of Biological Macromolecules,
161, 492–502. />ˆ F., Messa, L. L., Souza, C. F., & Faez, R. (2018). Chitosan sprayFranỗa, D., Medina, A.
dried microcapsule and microsphere as fertilizer host for swellable controlled
release materials. Carbohydrate Polymers, 196, 4755. />CARBPOL.2018.05.014
Gonỗalves, A. S., Monteiro, M. T., Guerra, J. G. M., & De-Polli, H. (2002). Biomassa
microbiana em amostras de solos secadas ao ar e reumedecidas. Pesquisa
Agropecu´
aria Brasileira, 37(5), 651–658. />Lubkowski, K., & Grzmil, B. (2007). Controlled release fertilizers. Polish Journal of
Chemical Technology. />Messa, L. L., Souza, C. F., & Faez, R. (2020). Spray-dried potassium nitrate-containing
chitosan/montmorillonite microparticles as potential enhanced efficiency fertilizer.
Polymer Testing, 81(October 2019), Article 106196. />polymertesting.2019.106196
Moreira, F. M. S., & Siqueira, J. O. (2006). Microbiologia e Bioquímica do Solo. Editora
UFLA.
Pandey, P., Kumar Verma, M., & De, N. (2018). Chitosan in agricultural Context-A
review. Bulletin of Environment, Pharmacology and Life Sciences.
Perotti, G. F., Kijchavengkul, T., Auras, R. A., & Constantino, V. R. L. (2017).
Nanocomposites based on cassava starch and chitosan-modified clay: Physico
9