Colloidal features of softwood galactoglucomannans-rich extract
Bạn đang xem bản rút gọn của tài liệu. Xem và tải ngay bản đầy đủ của tài liệu tại đây (5.15 MB, 10 trang )
Carbohydrate Polymers 241 (2020) 116368
Contents lists available at ScienceDirect
Carbohydrate Polymers
journal homepage: www.elsevier.com/locate/carbpol
Colloidal features of softwood galactoglucomannans-rich extract
a,
b
a,1
Mamata Bhattarai *, Irina Sulaeva , Leena Pitkänen
Antje Potthastb, Kirsi S. Mikkonena,d
c
a
, Inkeri Kontro , Maija Tenkanen ,
T
a
Department of Food and Nutrition,University of Helsinki, P.O. Box 66, Helsinki 00014, Finland
Department of Chemistry, University of Natural Resources and Life Sciences, Konrad-Lorenz-Straße. 24, 3430 Tulln, Austria
Department of Physics, University of Helsinki, University of Helsinki, P.O. Box 64, Helsinki 00014, Finland
d
Helsinki Institute of Sustainability Science,University of Helsinki, P.O. Box 65, Finland
b
c
ARTICLE INFO
ABSTRACT
Keywords:
asymmetrical flow field-flow fractionation
wood hemicelluloses
galactoglucomannans
particles
aggregates
Development of a sustainable bioeconomy requires valorization of renewable resources, such as wood hemicelluloses. The intra- and inter-molecular association of hemicelluloses within themselves or with other wood
components can result in complex macromolecular features. These features exhibit functionality as hydrocolloids, however macromolecular characterization of these heterogeneous materials are challenging using
conventional techniques such as size-exclusion chromatography. We studied galactoglucomannans (GGM) -rich
softwood extracts at two grades of purity—as crude extract and after ethanol-precipitation. Asymmetrical flow
field-flow fractionation (AF4) was optimized and utilized to fractionate size classes in GGM extracts, and subsequent characterization was performed with light scattering and microscopy techniques. Both GGM extracts
contained polysaccharides of around 10,000 g/mol molar mass, and colloidal assemblies and/or particles in submicron size range. The optimized AF4 method facilitates the characterization of complex biomass-derived carbohydrates without pre-fractionation, and provides valuable understanding of their unique macromolecular
features for their future application in food, pharmaceuticals, and cosmetics.
1. Introduction
Polysaccharides from plants (such as starch from grains), animals
(such as chitin from shellfish), and microbes (such as xanthan gum from
Xanthomonas campestris) are industrially important carbohydrate polymers. They are commonly isolated and converted for use as emulsifiers,
texture enhancers, film forming agents, and delivery vehicles in the
areas of food, cosmetics, pharmaceuticals, and coatings, and in other
technical applications (Dickinson, 2017).
The transition from an oil-based economy to a bioeconomy increases demand of renewable and technologically superior polysaccharides for use in functional materials (Employment, 2017). Significant value lies in the valorization of hemicelluloses from
lignocellulosic biomass. The predominant hemicelluloses in common
softwood species, Norway spruce (Picea abies), are galactoglucomannans (GGM). GGM are composed of partially acetylated β (1→4)linked Manp and Glcp units, substituted by α (1→6)-linked Galp
(Sjöström, 1993). GGM were first recovered in both laboratory and
semi-pilot scale studies from the process water of thermo-mechanical
pulping (TMP) processes (Willför, Rehn, Sundberg, Sundberg, &
Holmbom, 2003; Xu, Willfor, Sundberg, Pettersson, & Holmbom, 2007).
⁎
1
They can also be extracted from wood chips or saw dust prior to pulping
using pressurized hot water extraction (Kilpeläinen et al., 2014;
Schoultz, 2015), microwave heat (Söderqvist Lindblad, Ranucci, &
Albertsson, 2001), steam explosion (Chadni, Grimi, Bals, Ziegler-Devin,
& Brosse, 2019; Chadni, Grimi, Ziegler-Devin, Brosse, & Bals, 2019;
Jedvert, Saltberg, Lindström, & Theliander, 2012), and high voltage
electrical discharge (Chadni, Grimi, Bals et al., 2019; Chadni, Grimi,
Ziegler-Devin et al., 2019). In the past decade, GGM research has
shifted from characterizing their role in pulping and paper making to
the development of high-value added materials for techno-functional
applications. They have been studied as film-forming agents (Lindblad,
Dahlman, Sjöberg, & Albertsson, 2009; Mikkonen, Heikkilä, Willför, &
Tenkanen, 2012), hydrogels (Al-Rudainy, Galbe, Arcos Hernandez,
Jannasch, & Wallberg, 2019; Söderqvist Lindblad et al., 2001), aerogels
(Alakalhunmaa et al., 2016) and recently as very promising hydrocolloid with multifunctional emulsification and stabilization abilities
for food and alkyd paint emulsions (Bhattarai et al., 2019; Lehtonen
et al., 2016, 2018; Mikkonen et al., 2019; Mikkonen, Merger et al.,
2016; Mikkonen, Xu, Berton-Carabin, & Schroën, 2016; Valoppi et al.,
2019).
Hemicelluloses are present in the secondary cell walls of wood,
Corresponding author.
Present address: Department of Bioproducts and Biosystems, Aalto University, Finland.
/>Received 29 January 2020; Received in revised form 17 April 2020; Accepted 23 April 2020
Available online 27 April 2020
0144-8617/ © 2020 The Author(s). Published by Elsevier Ltd. This is an open access article under the CC BY license
( />
Carbohydrate Polymers 241 (2020) 116368
M. Bhattarai, et al.
embedded together with cellulose and lignin. Thus, lignin-derived
compounds are commonly co-extracted with hemicelluloses. In a previous study, lignin residues were responsible for the formation of wood
xylan aggregates (Westbye, Köhnke, Glasser, & Gatenholm, 2007). In
Pressurized hot water extracted GGM (PHWE GGM) co-eluted lignin
were assumed to form GGM-lignin particles (Valoppi et al., 2019). In
PHWE GGM, formation of GGM aggregates was also hypothesized to be
induced by lignin residues (Bhattarai et al., 2020). In dispersed systems,
these colloidal features may induce Pickering-type stabilization
(Bhattarai et al., 2019; Mikkonen, Merger et al., 2016; Valoppi et al.,
2019) analogous to stabilization mechanism by starch granules, chitin,
and cellulose nanocrystals (Dickinson, 2017). In polysaccharides, colloidal features in the form of macromolecular or supramolecular aggregates and particles are a result of partial solubility or insolubility,
which is a complex thermodynamic balance between the inherent
properties of polysaccharide and dissolution medium (Guo, Hu, Wang,
& Ai, 2017). Even minor amounts of co-components, like protein or
phenolic compounds, can greatly affect the solubility of polysaccharide
extracts (Ebringerová, Hromádková, & Heinze, 2005). This consequently affects their techno-functional properties, e.g., emulsifying,
stabilizing, and film-forming capacity (Harding, 2005), augmenting the
importance of their characterization.
To apply complex lignocellulose extracts in materials, their macromolecular and colloidal properties, such as molar mass and conformation in aqueous state must be known; however, their characterization is
very challenging due to limitations in existing techniques. The overall
solubility of hemicellulose-rich extracts can be altered by the presence
of bound or free form lignin. Lignin forms colloidal particles due to poor
solubility in aqueous solvents. Characterization of these colloidal features adds to the existing challenges in polysaccharide characterization,
which include molar mass dispersity and high branching degree (Zielke,
Fuentes, Piculell, & Nilsson, 2018). Conventionally employed size-exclusion chromatography (SEC) requires mandatory sample pre-filtration, resulting in loss of high molar-mass colloidal fraction. Even after
sample filtration, there is a risk of colloidal structures block the costly
SEC columns (Podzimek, 2011; Zielke et al., 2018). With SEC, there is
also a high possibility of structure deformation due to shear degradation (Podzimek, 2011). Asymmetrical flow field-flow fractionation
technique (AF4) largely overcomes these problems. In AF4, the absence
of a stationary phase allows for the injection of non-filtered samples
without the risk of channel blockage. This result in a comprehensive
analysis of samples with high size dispersity such as crude polysaccharide extracts, without the discrimination of the large molar mass
fractions and aggregates. AF4 is highly suited for understanding the
complex macromolecular features of polysaccharides when coupled to
detectors, such as multi-angle light scattering (MALS), dynamic light
scattering, and refractive index (RI) (Pitkänen, Tenkanen, &
Tuomainen, 2011; Runyon, Ulmius, & Nilsson, 2014; Zielke et al.,
2018).
We hypothesize that GGM-rich extracts in aqueous solution contain
a mixture of individual polysaccharide molecules with an average
molar mass around 10,000 g/mol as reported by previous studies
(Bhattarai et al., 2019; Mikkonen, Merger et al., 2016; Valoppi et al.,
2019) and entities of higher structural order, e.g., aggregates and/or
particles. Consequently, size dispersity due to differences in conformation is hypothesized. In our previous studies, we have estimated
the particle size of GGM extracts using offline dynamic light scattering
method (Bhattarai et al., 2020; Valoppi et al., 2019). However, this
method has poor separation resolution and does not distinguish conformational features. The aim of the present work was to address two
challenges of current biorefineries. First, to facilitate the characterization of crude polysaccharide extracts using AF4, and second, to provide
comprehensive details of the macromolecular features of GGM extracts
and thus facilitate their application as novel biomass-based materials.
We aimed to optimize the method and fractionate multiple size classes
present in PHWE GGM extracts using AF4 and characterize their molar
mass and conformational properties using a combination of techniques:
MALS, small-angle X-ray scattering (SAXS) and cryo-transmission
electron microscopy (Cryo-TEM). To our understanding, this is the first
study that has characterized crude GGM extract using AF4.
2. Materials and methods
2.1. Sample preparation
GGM were extracted from spruce sawdust using the PHWE process
in a pilot-scale flow-through extraction system (Kilpeläinen et al.,
2014). Briefly, the spruce sawdust was extracted at 170 °C for 70 min at
a flow rate of 20 mL/min using tap water. The crude extract was either
spray-dried to obtain sGGM or ethanol precipitation was performed as
described in our previous study (Bhattarai et al., 2019) to obtain eGGM.
Spray drying was performed using a Buchi Mini Spray Dryer B-290
(Buchi, Switzerland) at an inlet temperature of 170 °C and an outlet
temperature of 65 °C with dry air at a flow rate of 667 L/h. sGGM and
eGGM were obtained in powder form and stored at RT protected from
light.
Both GGM extracts had heterogeneous monosaccharide composition: 55–60% mannose, 14–15% glucose, 10–14% xylose, 7–10% galactose, around 3% galacturonic acid, 2.5–3.5% methyl-glucuronic
acid, and less than 1% arabinose and rhamnose (Bhattarai et al., 2019;
Mikkonen et al., 2019; Valoppi et al., 2019). All percentages were based
on dry GGM extract. sGGM and eGGM had about 73 wt% (Valoppi
et al., 2019) and 86 wt% (Bhattarai et al., 2019) total carbohydrate
content, respectively, which was calculated by summing up the
monosaccharides and correcting for the condensation reaction with
correction factors 0.88, 0.9 and 0.91 for pentoses, hexoses and uronic
acids, respectively. The monosaccharide analysis was performed by
acid methanolysis followed by gas chromatography (Sundberg,
Sundberg, Lillandt, & Holmhom, 1996). The phenolic content of sGGM
was 40–50 (Mikkonen et al., 2019; Valoppi et al., 2019) and that of
eGGM was 16 (Valoppi et al., 2019) Gallic acid equivalent/g of dry
GGM. The amount of extractives in sGGM and eGGM were 5.1 and
0.4 mg/g, respectively (Mikkonen et al., 2019). A detailed chemical
characterization of the phenolic compounds and extractives has been
performed in our recent study (Mikkonen et al., 2019).
Aqueous solutions of GGM extracts were prepared at concentrations
of 5 and 10 mg/mL in 25 mM sodium citrate buffer at pH 4.5 by dissolving overnight with mild shaking. Sodium azide was added at
250 ppm to prevent microbial spoilage.
Reagents used were citric acid monohydrate, sodium hydroxide, and
sodium azide, all from Merck (Darmstadt, Germany). Deionized water
or HPLC-grade water from Merck (Darmstadt, Germany) was used for
sample preparation. HPLC-grade water was used to prepare AF4 eluent.
2.2. Instrumental setup for AF4
The AF4 setup used the Dionex DG-1210 online degasser, an Agilent
Technologies 1260 Infinity Pump, an Agilent Technologies G1367C
autosampler, and an Eclipse AF4 separation system (Wyatt
Technologies, Santa Barbara, USA). Separation of GGM occurred in a
275 mm long separation channel with a 350 μm or 490 μm spacer. The
separation system was coupled sequentially to a UV detector (Azura
UVD 2.1S, KNAUER GmbH, Germany) set at 280 nm; a Wyatt DAWN
HELEOS II MALS detector equipped with a 658 nm laser and band-pass
filters installed on each second of 18 detectors; and a Wyatt TReX refractive index (dRI) detector. Band-pass filters are necessary when
fluorescence-emitting compounds are present in the sample, such as
lignin or lignin-derived phenolic residues in our case. All detectors were
set at 25 °C, whereas the separation channel was at RT (22–23 °C). The
MALS data was evaluated by Astra 6.1 (Wyatt Technology). The obtained MALS data was fitted to the Zimm and Berry formalism, fit order
1 for the molar mass and radius of gyration (Rg) analysis of different
2
Carbohydrate Polymers 241 (2020) 116368
M. Bhattarai, et al.
fractions in the GGM extract. The data from the first two and last two
angles in the detector were not used due to noisy signals. When calculating molar mass, the values were compared with and without using
detectors with band-pass filters. The input of the absorption and
fluorescence effects induced by certain contaminants (e.g. lignin or
lignin-derived phenolic residues) in the MALS-derived molar mass data
was controlled and corrected by a forward monitor done similarly by
Zinovyev et al., 2018. Exponential fit with fit order up to 6 was used to
obtain the fitted molar mass data. A higher fit order was necessary
given the high size dispersity of the GGM-extracts.
The same buffer used during sample preparation, 25 mM sodium
citrate buffer at pH 4.5, was used as the eluent for AF4. The membrane
used in AF4 was regenerated cellulose Ultracel with molecular weight
cut off at 3 kDa from Merck KGaA (Darmstadt, Germany), which was
obtained as square sheets (20 × 20 cm) and manually cut through the
diagonal to fit inside the channel.
sample injection was kept constant for 1 min but sample injection and
sample focus time was varied with a 5–10 min of total sample focusing
time. The outflow/detector flow rate was kept constant at 1 mL/min.
2.5. Small angle X-ray scattering (SAXS)
SAXS measurements were performed on 1% w/w sGGM and eGGM
solutions after mixing overnight in the same buffer as mentioned previously. In addition, to understand the structural features of GGM extracts subjected to various conditions; the solutions were heat treated to
70 °C and measured after cooling to RT. To understand the effect of
mechanical shearing, both solutions were treated with high-shear mechanical mixing at 11,000 rpm for 5 min using Ultraturrax (T-18 basic,
IKA, Staufen, Germany) followed by three passes in a microfluidizer
(Microfluidizer 110Y, Microfluidics, Westwood, MA, USA) at 800 bar.
The shear-treated samples were shipped to the synchrotron facility
where they were stored at RT. The sGGM solution was also measured
after filtration using a 0.45 μm filter.
The SAXS experiments were conducted with at Diamond Light
Source Synchrotron (Didcot, Oxfordshire, UK) with the standard solution SAXS set-up of beamLine B21 (bioSAXS robot) set to 20 ℃. The
distance between sample and detector (Pilatus 2 M, Dectris, BadenDaettwil, Switzerland) was 4.014 m and the photon wavelength
4 sin
= 0.100 nm. The scattering vector q is defined as q =
, where is
half of the scattering angle, and relates to distances in real space by
2
d = q . The obtained q-range was 0.032 to 3.8 nm-1 and the sample
volume was 35 μl. Measurement times were 1 second per data frame,
and 28 frames per sample. The calibration, normalization of data to an
absolute scale, spherical averaging, merging and correction for background (buffer) scattering were done by in-house software and ScÅtter
program version 3.1. The data were inspected for radiation damage
before merging. For shear-treated samples, merging and correction for
buffer scattering was done using MATLAB (MathWorks Inc, Natick,
Massachusetts, U.S.A.).
2.3. Determination of dn/dc
The refractive index increment (dn/dc) of the samples was determined in batch mode using a dRI detector. Concentration series at
0.4, 0.6, 0.8, 1 and 1.2% w/v of sGGM and eGGM were prepared and
measurements were taken in triplicate. The obtained dn/dc values;
0.145 ± 0.001 and 0.148 ± 0.001 for sGGM and eGGM, respectively
were used for MALS data processing.
2.4. AF4 conditions during method optimization
The separation of macromolecules during AF4 occurs on a thin
channel, which contains porous ultrafiltration membrane. The channel
consists of an impermeable upper plate and a permeable lower plate,
separated by a spacer, which controls channel thickness. Sample analysis is performed in three steps: sample injection, sample relaxation/
focusing and elution. During the injection and focusing steps, the
sample is injected to accumulate very close to the membrane surface via
a perpendicular flow. During the elution step, the sample analytes elute
along the channel with a transverse channel flow in an increasing order
of their diffusion coefficients (i.e., hydrodynamic sizes). The separation
of analytes is obtained by applying a crossflow (Vc), which is perpendicular to the channel flow. Vc in a gradient (linear or exponential
decay), a constant flow or a combination of thereof facilitate the separation in AF4(Podzimek, 2011).
In present study, sample injection flow and injection volume were
0.2 mL/min and 100μl, respectively. The total focusing time included
time for preparation of sample injection, sample injection, and sample
focus. The channel thickness, sample injection and sample focus time
during focusing step, Vc and flow gradients were optimized to achieve
an efficient separation of GGM extracts (Table 1). Preparation for
2.6. Cryo-transmission electron microscopy
Cryo-transmission electron microscopy (Cryo-TEM) was performed
on a 1% sGGM solution, prepared in the same way as described earlier.
The solution was frozen after 1 hour of resting at 22 °C. The vitrified
samples were prepared from 3 μl aliquots with a Leica EMGP vitrification device on freshly glow-discharged Quantifoil R1.2/1.3 grids. The
samples were observed in a FEI Talos Arctica microscope operated at
200 kV. The images were recorded at a nominal magnification of
22,000x and 8500x with a FEI Falcon 3 camera operated in a linear
mode.
Table 1
Summary of membrane, spacer thickness (μm) and total focusing time (min) studied during optimization of AF4 of GGM extracts. Total focusing time included time
for preparation for sample injection, sample injection and sample focus, in series. The crossflow rate (Vc) in mL/min during the elution steps (I-IV) and duration (min)
of each step is presented. Note: Step II operates under linear gradient of Vc.
Sample
Spacer
thickness
Total focusing time
Step I
Vc (Duration)
Step II
Vc (Duration)
Step III
Vc (Duration)
Step IV
Vc (Duration)
sGGM
350
5 (1’+2’+2’)
sGGM
490
2–0.1
(15)
3–0.1
(15)
0.1–0.1
(5)
0.1–0.1
(10)
0–0
(10)
0–0
(20)
eGGM
490
5 (1’+2’+2’)
6 (1’+2’+3’)
7 (1’+2’+4’)
9 (1’+3’+5’)
10 (1’+4’+5’)
10 (1’+4’+5’)
2–2
(10)
3–3
(2)
n/a
(n/a)
3–0
(15)
0–0
(20)
n/a
(n/a)
n/a – Not applicable
Note: (1’+2’+2’) means 1 min of preparation for sample injection, 2 min of sample injection and 2 min of sample focus, for example.
3
Carbohydrate Polymers 241 (2020) 116368
M. Bhattarai, et al.
3. Results and discussion
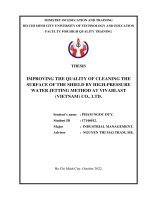
fractions represented by three peaks in the dRI detector (Fig. 1). Each
fraction was associated with signals from UV and the MALS detector
with varying intensities (a comparable figure is shown in Fig 3A). With
the 350 μm spacer, the molar mass of the small-sized fraction,i.e. the
first peak in the fractogram was in the range of tens of 104 g/mol, in
contrast in the order of 10,000 g/mol that was previously obtained from
SEC (Valoppi et al., 2019). Using the 490 μm spacer, the molar mass of
the smallest-sized fraction was reduced to the order of 104 g/mol and a
distinct separation of the first and second fraction was observed. For
these experiments with 490 μm spacer, Vc was increased to 3 mL/min
from 2 mL/min. The latter was used with 350 μm spacer. During preoptimization trials in 490 μm spacer, using Vc 2 mL/min and using the
same method applied with 350 μm spacer, small-sized fraction was well
separated, however, the separation of second and the third fraction
separation was poor, and very large-sized analytes eluted only after the
experimental run ended (data not shown). Separation resolution increases with increasing Vc and channel thickness. Hence, to maximize
the separation power of these complex analytes, Vc 3 mL/min was used
in subsequent measurement with 490 μm spacer.
We speculated steric-hyperlayer elution and/ co-elution of largeand small-sized particleswith the 350 μm spacer because the obtained
molar mass of the first fraction seemed to originate from large-sized
analytes in sGGM. In AF4, the normal mode of elution refers to the
elution of analytes in an increasing order of their hydrodynamic radius.
However, when analytes’ size exceeds a certain diameter due to predominant hydrodynamic lift forces on large-sized analytes, the normal
mode of elution is reversed, referred to as a steric-hyperlayer mode of
elution (Podzimek, 2011). Co-elution refers to the elution of mixtures of
small- and large-sized analytes and has been previously observed in
highly-branched amylopectin with Mw > 107 g/mol (Perez-Rea, Zielke,
& Nilsson, 2017) and a mixture of polymers with a broad molar mass
distribution (Zielke et al., 2018). In disperse samples, the steric-hyperlayer mode can co-exist together with normal mode separation, and
increase the dispersity of separated fractions (Podzimek, 2011). Coelution, which is commonly observed in the steric transition region, was
largely reduced in our study with increased channel thickness by using
490 μm spacer.
The effect of spacer thickness was also observed in eGGM, which
3.1. Method optimization in AF4
For the AF4 setup, we first tested the effect of channel thickness on
the separation resolution. To further improve the data quality, sample
focus duration was optimized. From our preliminary trials, these were
the relevant key parameters. Using the optimized conditions, the molar
mass, Rg and conformational properties for each separated fraction of
GGM extracts were determined using MALS and dRI detectors.
The optimal fractionation of highly disperse GGM extracts required
pre-optimization of crossflow rate, which are not presented in detail in
this study.During AF4-MALS analyses forward monitor in LS detectors
helped to correct for light absorbance arising from the presence of
phenolic residues and/lignin that were heavily concentrated in some
fractions of the GGM extracts. Band-pass filters in the MALS detectors
were used to crosscheck for the overestimation of molar mass arising
from fluorescence effects.
3.1.1. Effect of channel thickness
In AF4, a spacer determines the channel thickness, which affects the
separation power. The spacer thickness can range from 50 to 500 μm;
however, only a few dimensions are available commercially (e.g. Wyatt
Technology Corporation provides only 250, 350 and 490 μm spacers). A
thickness of 350 μm is most commonly used (Podzimek, 2011). Increased channel thickness has been reported to improve the separation
of samples with a broad size distribution (Kim, Yang, & Moon, 2018).
During preliminary trials, we observed a high size dispersity in both
GGM extracts, especially in sGGM. Highly disperse nature of the extracts indicated that they most likely contained colloidal structures in
addition to the dissolved polysaccharide chains. A broad distribution of
molar mass due to the presence of oligosaccharides, polysaccharides
and non-polysaccharide materials are a characteristic feature of crude
polysaccharide extracts. To understand if increased channel thickness
has an effect on the separation resolution of highly heterogeneous
samples like GGM extracts, we tested a 490 μm spacer inside the
channel in addition to more commonly used 350 μm spacer.
For sGGM, using either the 350 and 490 μm spacer resulted in three
Fig. 1. (A, C) Normalized dRI signal intensity versus retention time of 1% sGGM separated with a 350 and 490 μm spacer presented together with the applied
crossflow rate (Vc) during separation. (B, D) Corresponding molar mass obtained from the three peaks (P1, P2 and P3) obtained in panels A and C. Zimm formalism
was used for P1 and Berry model was used for P2 and P3. Panels A and C and panels B and D share the same x-axis.
4
Carbohydrate Polymers 241 (2020) 116368
M. Bhattarai, et al.
consisted mainly of two fractions (see Fig. 3B). With the 350 μm spacer,
separation of two fractions was achieved (data not shown); however,
the molar mass of the first fraction could not be calculated precisely due
to noisy light scattering (LS) signals (data not shown). With the 490 μm
spacer, the LS data noises of the first fraction were reduced substantially due to better separation of different size classes (presented
further). Hence, the 490 μm spacer was used in subsequent measurements of both sGGM and eGGM.
lower cut-off membrane than currently used 3 kDa and a different
membrane material for e.g. polyethersulfone are worth investigating.
Additionally, the recovery calculation will also be affected from the dn/
dc value, if different size-fractions have heterogeneity in chemical
composition.
3.1.3. Challenges in AF4 characterization of crude extracts of
polysaccharides
AF4 is the most instrumentally developed field-flow fractionation
method to characterize a wide range of natural and synthetic polymers,
colloidal particles, and various biological and environmental samples
(Podzimek, 2011). It is possibly the most suitable method for the
characterization of complex mixtures of samples with a broad size
distribution and ultra-high molar mass polymers and particles
(Podzimek, 2011). In our context, AF4 coupled with UV, MALS and dRI
detectors gave comprehensive information of both GGM extracts on the
presence of multiple-sized fractions, their molar mass, conformational
properties, and fraction composition (UV-absorbing compounds), which
was impossible to obtain with conventional SEC. Hence, this method
can be successfully employed for the characterization of crude polymer
extracts. In order to facilitate the use of AF4 to fractionate highly disperse samples, like GGM extracts, we would like to highlight some issues that we encountered during method optimization.
3.1.2. Effectof increased focus time
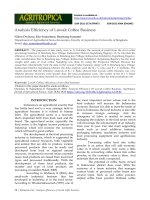
The molar mass of the first fraction of sGGM obtained with the
490 μm spacer was close to 104 g/mol. However, there were some
noises in the signals and co-elution affected during the flow transition
when Vc changed from a linear gradient to a steady Vc of 0.1 mL/min
(between 20–30 min in Fig. 1). This was assumed to originate from the
insufficient sample focusing in the thicker channel; thus, to further
improve the elution, the effect of sample focusing duration was studied
(Fig. 2). The focus time was increased from 5 min in a series by increasing the sample injection and focus duration (see Table 1).
With longer sample focusing, the noise in the LS signal reduced
significantly (see the inset of Fig. 2A). Additionally, LS signal noises in
the void region were also reduced. The molar mass of the small-sized
fraction with 10 min total focusing step was now in the same range as in
the previous study (Valoppi et al., 2019). Detailed characterization of
each fraction is discussed in the Section 3.2.1. In eGGM, with increased
focus time, reduction in LS signal noises in the void region was observed (data not shown). Sample focus time is directly proportional to
the square of channel thickness and inversely proportional to the diffusion coefficient of analyte. This means in thicker channels large
particles need a longer focus time compared to the small particles
(Podzimek, 2011).
An efficient fractionation of GGM extracts was achieved using the
490 μm spacer, with channel thickness and focus time playing significant role. However, this came with a loss in sample recovery. The
total mass recovery with 490 μm spacer thickness and 3 mL/min
crossflow rate was approximately 45–50 % (sGGM) and 43 % (eGGM)
and versus 60 % (sGGM) and 68 % (eGGM) with 350 μm spacer and
2 mL/min crossflow rate. However, with the current setup, an efficient
separation of distinctly different sized analytes was observed, which
was the focus of this current study. To improve recovery, using even
1) The fractionation of highly disperse samples with a very broad size
distribution is often challenging in a single run, which is otherwise a
favorable approach. For efficient fractionation, pre-trials using a
combination of linear/exponential gradients and a steady crossflow
need to be performed.
2) In samples with a broad molar mass distribution, a high sample
injection load is required to characterize the small-sized fractions;
however, injection of a higher load may lead to problems of channel
overloading and sample aggregation, which needs to be considered.
3) For any given channel thickness, the separation resolution increases
with increasing Vc and channel flow rate. However, a high Vc prolongs the experimental run time and increases channel pressure
resulting in leakage problems particularly in thin channels. Thicker
channels offer several advantages for characterizing crude polymer
extracts. Shear rates are low, which is particularly advantageous for
studying loose polysaccharides aggregates. Analytes are diluted,
Fig. 2. (A) Absolute LS signal (V) intensity of 1% sGGM separated on a 490 μm spacer focused for different times. The inset in panel A shows the magnified LS signals
in the corresponding retention time. In the legend, 1’+2’+2’ indicate 1 min of preparation for sample injection, 2 min of sample injection and 2 min of sample focus,
for example. (B) Corresponding molar mass of the three peaks (P1, P2 and P3) from different sample focus times. Zimm model was used for P1 and Berry model was
used for P2 and P3.
5
Carbohydrate Polymers 241 (2020) 116368
M. Bhattarai, et al.
Table 2
Weight-average molar mass (Mw), number-average molar mass (Mn) in g/mol, polydispersity index (PDI), z-average radius of gyration (Rg) in nm of different
fractions of 0.5 and 1% sGGM and eGGM. The molar mass was calculated by integrating the eluted peaks in Fig. 3A and B. Fit order and R2 to obtain molar mass (Mw
and Mn) and Rg presented for each fraction.
Sample
1st fraction
(Fit order, R2)
Mw
0.5 % sGGM
1 % sGGM
0.5 % eGGM
1 % eGGM
2nd fraction
(Fit order, R2)
Mn
4
2.1 × 10
Exp 3, 0.64
1.3 × 10⁴
Exp 3, 0.86
1.0 × 10⁴
Exp 1, 0.94
1.0 × 10⁴
Exp 1, 0.82
PDI
4
1.5 × 10
1.44
1.1 × 10⁴
1.27
8.9 × 10³
1.15
3
8.8 × 10
1.16
Mw
3rd fraction
(Fit order, R2)
Mn
6
8.0 × 10
Exp 4, 0.99
1.1 × 10⁷
Exp 6, 0.99
2.5 × 10⁶
Exp 2, 0.97
9.4 × 10⁷
Exp 6, 0.98
PDI
Rg
6
2.1
nd
5.7 × 10⁶
2.0
5.2 × 10⁴
48.27
15.7
Exp 2, 0.94
n/a
786.89
n/a
3.8 × 10
1.2 × 10
5
Mw
Mn
10
8.7 × 10
(n/a)
9.8 × 10¹⁰
(n/a)
n/a
n/a
n/a
PDI
Rg
3.6 × 10
242.5
1.3 × 10⁹
75.8
494.6
(n/a)
440.8
(n/a)
8
n/a = Not applicable. nd = not determined due to noisy signal
Note: Rg of 1st fraction could not be determined. The 3rd fraction and a part of 2nd fraction of sGGM most likely originate from particles and/ aggregates, hence the
molar mass values presented do not represent individual polysaccharide molecules.
preventing the risk of aggregation, when a higher sample volume is
required during injection as mentioned before. In addition, the
possibility of sample-membrane interaction is lower in thick channels, which would have a positive effect in recovery (Wahlund,
2013). The steric inversion diameter can be increased with increased channel thickness. The increase in steric inversion diameter
reduces the co-elution and steric-elution phenomenon in size disperse samples such as crude polysaccharide extracts.
The dRI, UV and LS detectors coupled to AF4 provided information
on the amount, presence of UV-absorbing compounds, and the size/
molar mass of each separated fraction, respectively (Fig. 3A and B). In
both GGM extracts, a UV signal at varying intensities was associated
with each peak/size-class. In sGGM, the ratio of dRI, UV and LS peak
areas between the first, second and the third fraction was 9.7:1.7:1
(dRI), 1:2.7:2.4 (UV) and 0.03:2.8:97.2 (LS), respectively. The distribution of UV-absorbing compounds between the three fractions in
sGGM was interesting. The second and third fraction contained a high
amount of UV-absorbing compounds, but the first fraction had only a
low amount. In eGGM, the ratio of RI, UV and LS peak areas between
the first and the second fraction was 6.5:1 (dRI), 1:1.1 (UV), and 1:99
(LS), respectively. This indicates that equal amounts of UV-absorbing
compounds were present in both size-classes, despite low molar mass
polysaccharides were being the most abundant. Co-extracted ligninderived phenolic residues and extractives are most likely the source of
these UV signals (Mikkonen et al., 2019) and the high UV signal intensity in sGGM compared to eGGM in Fig. 3 was also in agreement
with the total phenolic content result. Our recent study showed that
these phenolic residues could be in polymerized form as lignin
(Lahtinen et al., 2019; Valoppi et al., 2019).
From the molar mass analysis, it was concluded that in addition to
low-molar mass polysaccharides (likely individually dissolved molecules), both GGM extracts contained fractions of a higher structural
order, especially in sGGM. The molar mass of the second most abundant
fraction of sGGM, which was in the range of 107 g/mol, has been previously reported in pure polysaccharide such as dextrans (Maina et al.,
2014) and aggregates from beta-glucan (Zielke, 2017). However, in
contrast with pure polysaccharides GGM-rich wood extracts contain
other components, e.g., lignin, which could give rise to colloidal particles and thus complicate direct comparisons. The extremely high
molar mass of the third fraction, which was the least abundant of the
three fractions, suggested the presence of particles, instead of dissolved
polysaccharides. In such cases, molar mass becomes an irrelevant
parameter. The fraction in eGGM with the obtained molar mass in the
range of 106-107 g/mol can be assigned to previously observed aggregates of eGGM (Bhattarai et al., 2020). Kishani, Vilaplana, Xu, Xu,
and Wågberg (2018) have also reported that GGM obtained from TMP
process formed aggregates in solution. To understand the conformational properties of the second and third fraction of sGGM, we studied
these fractions separately as discussed in the next section.
3.2. Macromolecular properties of GGM extracts
3.2.1. Molar mass analysis
Both types of GGM extracts were previously characterized as lowmolar mass polysaccharides with molar mass around 8,000 in DMSO
and 12,000 g/mol in aqueous solvent— both analyzed by SEC.
According to our visual observations of the opaque sGGM solution and
translucent eGGM solution, and our recent study on the aggregation
behavior of eGGM (Bhattarai et al., 2020) it was hypothesized that
larger structures existed in the GGM solutions. Hence, advanced fractionation method such as AF4 was required to understand the complete
and complex macromolecular profile of GGM extracts. The optimized
AF4 method in previous section was used to fractionate and characterize the macromolecular features of sGGM and eGGM, which are
discussed here.
The dRI, UV and LS signal peaks indicated that sGGM was more
disperse with three distinct fractions compared totwo fractions in
eGGM—each represented by a peak (Fig. 3A and B).
In both types of GGM extracts, the most abundant fraction had
molar mass between 1-1.3 × 10⁴ g/mol (Fig. 3C and D; Table 2), similar to those reported in previous studies. The Rg of this fraction could
not be calculated precisely as low-molar mass analytes do not show
angular dependency of scattered light (Podzimek, 2011). This fraction
did not show significant concentration dependency, suggesting that
they were not aggregated polysaccharides. The slightly higher molar
mass obtained in 0.5% sGGM was most likely due to low LS signals
because of low concentration. The second fraction in both types of GGM
extracts had a molar mass in the range of 106–107 g/mol. Mild concentration dependency was observed between 0.5% and 1% eGGM at
the higher retention time, suggesting that the latter part could be a
result of concentration.The third fraction in sGGM (not present in
eGGM) was in the range of 1010g/mol at both concentrations.
6
Carbohydrate Polymers 241 (2020) 116368
M. Bhattarai, et al.
Fig. 3. dRI (RIU), UV (V) and LS (V) signals in absolute units versus retention time of 1% (A) sGGM and (B) eGGM dissolved overnight in 25 mM sodium citrate buffer
at pH 4.5. The inset in panel B shows the magnified LS signal of 1% eGGM for the corresponding retention time. Normalized dRI signal intensity versus retention time
of 0.5 and 1% (C) sGGM and (D) eGGM with fitted molar mass (g/mol) for each eluted peak. Zimm model was used for P1 and Berry model was used for P2 and P3
(when applicable). Spacer- 490 μm, total focusing time- 10 min. In panels C and D, each chromatogram was normalized against its highest magnitude. The right and
left axes of panel C and D share the same axis.
3.2.2. Conformational properties
To understand the conformational properties of the second and
third fraction of sGGM, Rg was plotted as a function of molar mass
(Fig. 4). The results were complemented with SAXS and Cryo-TEM. The
second fraction of eGGM had much lower intensity of LS signal compared to sGGM; hence, such plot was not obtained.
The Rg of the second sGGM fraction was < 50 nm, and the major
part of this fraction was estimated to have Rg < 10 nm. This indicates
the presence of compact structures, considering the molar mass of this
fraction was in the range of 107 g/mol. The conformation plot of this
fraction where Rg was > 10 nm gave a slope of 0.77, which is a typical
feature of random coils. From the third sGGM fraction, a slope of 0.27
was obtained, which is close to what is known for spheres (0.33)
(Podzimek, 2011).
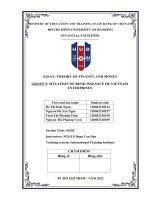
Cryo-TEM was performed as a visualization tool at high-resolution
in sub-micron range (Fig. 5) to confirm the conformational information
obtained from AF4-MALS. The sGGM solution under the TEM showed
two different features: a network of loose aggregates, where denseobjects appeared to be embedded, forming a core-shell-like network
(Fig.5A and B) and noticeable sub-micron sized spherical particles
(Fig. 5C and D). Similar structure was observed previously in eGGM
(Bhattarai et al., 2020).
SAXS was performed on both sGGM and eGGM solutions (Fig. 6) to
obtain any further structural information to validate the conformational
information obtained from AF4-MALS (Fig. 4) and Cryo-TEM (Fig. 5). In
sGGM solution a characteristics feature in the region of q 0.1 nm-1
corresponding to real space distance ∼ 60 nm was observed (shoulder
in Fig. 6A), which indicated structural features in the respective length
7
Carbohydrate Polymers 241 (2020) 116368
M. Bhattarai, et al.
Fig. 4. Log-log plot of radius of gyration (Rg) versus molar mass of the (A) 2nd and (B) 3rd fraction of 1% sGGM. Refer to Fig. 3 A and C for the peaks. The slopes
obtained from the shaded area are labeled in the figure.
Fig. 5. (A, B, C, D) Cryo-TEM images of the 1% sGGM dissolved in 25 mM sodium citrate buffer overnight at pH 4.5.Note: the light-colored round circles in the images
originate from the sample holder. Image B was processed for better contrast to visualize the aggregates. In image C, only the dark particle with a scale bar beneath is
from the sample.
8
Carbohydrate Polymers 241 (2020) 116368
M. Bhattarai, et al.
Fig. 6. SAXS intensity plotted as a function of scattering vector of 1% (A) sGGM
solution without any treatment (sGGM),
homogenized (sGGM-treated), heated to
70 °C (sGGM-heated) and filtered through
0.45 μm (sGGM-filtered) (B) eGGM solution without shear treatment (eGGM),
shear-treated (eGGM-treated), and heated
to 70 °C (eGGM-heated).
scale. The shoulder was persistent after the high-intensity mechanical
shearing of the sGGM solution and even after filtration of the solution
through a 0.45 μm filter. Heat treatment reduced this shoulder to some
extent. Thus, we expect that the shoulder represents sGGM aggregates
or particles or their combination, corresponding with the second fraction obtained from AF4 and possibly observed under TEM (Fig. 5A and
B). This fraction may be partially broken or dissolved during treatment
such as high-intensity shearing, and re-assembled when resting. Conversely, such features were not pronounced in eGGM. The normalized
scattering intensity of sGGM solution was significantly higher at high qrange (Fig. 6), indicating more scattering structures in the corresponding length-scale.
The present results indicated that besides low-molar mass polysaccharide fraction, sGGM consisted of compact structures in different
size-scales. The core-shell-like features observed in sGGM under TEM is
analogous to hybrid micro-gels (Karg & Hellweg, 2009). Our recent
study employed a batch centrifugation approach to fractionate different
size-classes in sGGM. The size characteristics of the third fraction from
the present study matched with those of the pellet obtained previously
after centrifugation, which was identified as primarily composed of
lignin (Valoppi et al., 2019) with a molar mass around 3000 g/mol in
DMSO. This explains the particle-like conformation of the third fraction, as lignin has poor solubility in aqueous solvents. The observed
particle morphology in Fig. 5C and D differed from pure lignin nanoparticles, as the latter have defined edges (Bai et al., 2019; Lievonen
et al., 2016). The pellet also consisted of about 25% of the total polysaccharides of sGGM (Valoppi et al., 2019); hence, we suggest that the
outer shell of the present particles observed under TEM could be
composed of GGM polysaccharides, and the inner core from lignin, due
to the differences in the hydrophilicity of polysaccharides and lignins.
Analogous to hybrid micro-gel structures, lignin could crosslink with
polysaccharides and form such a core-shell like structure. This could
also support the presence of lignin carbohydrate complexes, which has
been recently identified in sGGM (Lahtinen et al., 2019).
We have previously observed that the lignin-rich fraction with
particle size between 20–600 nm (peak maxima at 120 nm) could
contribute to the emulsion stabilization capacity of sGGM (Valoppi
et al., 2019). From the present study, it can be concluded that the
second and third fractions that were presumed to be effective in
emulsions, were indeed colloidal particles. This type of emulsion stabilization is referred to as Pickering-type emulsion stabilization
(Pickering, 1907). Use of Pickering emulsions stabilized by insoluble
biopolymers such as cellulose, lignin, starch, and chitin, for food,
pharmaceuticals and other technical applications have gained popularity in the last decade (Bai et al., 2019; Dickinson, 2017). The loose
network-like structure observed under TEM indicates that not all of the
observed particles existed as individually, but rather embedded in an
aggregated network of GGM.
Both types of GGM extracts showed interesting conformational
properties. The presence of colloidal entities like aggregates and particles may exhibit functionality as particle fillers, creating stable dispersed multiphasic systems. Our results lead to important new research
questions, such as the effect of pH, ionic strength, and organic solvents
on the macromolecular and conformational properties of GGM extracts.
4. Conclusion
Recovery and valorization of hemicelluloses for future applications
requires knowledge of their solution properties in aqueous state, which
mandates their efficient fractionation and characterization. The present
study optimized the AF4 method for the separation of different sizeclasses and the subsequent characterization of GGM-rich wood extracts
obtained from an aqueous based extraction method—PHWE.
Both types of GGM-rich extracts (sGGM and eGGM) were primarily
heterogeneous mixtures of polysaccharide–particle or polysaccharide–aggregate systems together with individually dissolved
polysaccharides. The crude sGGM extract consisted of a low-molar mass
polysaccharide fraction and compact polysaccharide–lignin nanoparticles in the nano- and sub-micron scale. These colloidal particles
were absent in the ethanol-precipitated GGM—very likely due to removal of major portion of phenolics compounds; however, colloidal
assemblies existed. For the first time, the present study provided a
comprehensive overview of the complex macromolecular features of
GGM-rich extracts and a comparison between the colloidal properties of
GGM with two different grades of purity. The optimized AF4 method in
the present study will facilitate the characterization of highly disperse
crude polysaccharide extracts without pre-fractionation, which is often
challenging. Comprehensive characterization of carbohydrate extracts
facilitates their application as novel biomass-based materials, especially
as multi-mechanistic stabilizers obtained from soluble and less soluble
molecules. The obtained results will also facilitate biorefineries to
conduct need-based carbohydrate extraction.
Funding Sources
The doctoral programme of Food Chain and Health at the University
of Helsinki and EU-COST Action FP1306 are acknowledged for funding
MB and her scientific visit to the University of Natural Resources and
Life Sciences, Austria, respectively. Väisälä Fund is acknowledged for
funding the travel Inkeri Kontro to Diamond Light Source Synchrotron
in UK.
CRediT authorship contribution statement
Mamata
Bhattarai:
Conceptualization,
Methodology,
Investigation, Formal analysis, Visualization, Writing - original draft.
9
Carbohydrate Polymers 241 (2020) 116368
M. Bhattarai, et al.
Irina Sulaeva: Methodology, Formal analysis, Validation, Writing review & editing. Leena Pitkänen: Conceptualization, Formal analysis,
Validation, Writing - review & editing. Inkeri Kontro: Investigation,
Formal analysis, Writing - review & editing. Maija Tenkanen:
Conceptualization, Methodology, Writing - review & editing. Antje
Potthast: Methodology, Supervision, Writing - review & editing. Kirsi
S. Mikkonen: Conceptualization, Supervision, Writing - review &
editing.
Kim, Y. B., Yang, J. S., & Moon, M. H. (2018). Investigation of steric transition with field
programming in frit inlet asymmetrical flow field-flow fractionation. Journal of
Chromatography A, 1576, 131–136.
Lahtinen, M. H., Valoppi, F., Juntti, V., Heikkinen, S., Kilpeläinen, P. O., & Maina, N. H.
(2019). Lignin-Rich PHWE Hemicellulose Extracts Responsible for Extended
Emulsion Stabilization. Frontiers in Chemistry, 7, 871.
Lehtonen, M., Merinen, M., Kilpeläinen, P. O., Xu, C., Willför, S., & Mikkonen, K. S.
(2018). Phenolic residues in spruce galactoglucomannans improve stabilization of
oil-in-water emulsions. Journal of Colloid and Interface Science, 512, 536–547.
Lehtonen, M., Teräslahti, S., Xu, C., Yadav, M. P., Lampi, A.-M., & Mikkonen, K. S. (2016).
Spruce galactoglucomannans inhibit lipid oxidation in rapeseed oil-in-water emulsions. Food Hydrocolloids, 58, 255–266.
Lievonen, M., Valle-Delgado, J. J., Mattinen, M.-L., Hult, E.-L., Lintinen, K., Kostiainen,
M. A., ... Österberg, M. (2016). A simple process for lignin nanoparticle preparation.
Green Chemistry, 18(5), 1416–1422.
Lindblad, M. S., Dahlman, O., Sjöberg, J., & Albertsson, A.-C. (2009). Modified galactoglucomannans from forestry waste-water for films and hydrogels. Polysaccharide
Materials: Performance by Design. ACS Publications.
Maina, N. H., Pitkänen, L., Heikkinen, S., Tuomainen, P., Virkki, L., & Tenkanen, M.
(2014). Challenges in analysis of high-molar mass dextrans: Comparison of HPSEC,
AsFlFFF and DOSY NMR spectroscopy. Carbohydrate Polymers, 99, 199–207.
Mikkonen, K. S., Heikkilä, M. I., Willför, S. M., & Tenkanen, M. (2012). Films from
glyoxal-crosslinked spruce galactoglucomannans plasticized with sorbitol.
International Journal of Polymer Science, 2012, 8.
Mikkonen, K., S, Kirjoranta, S., Xu, C., Hemming, J., Pranovich, A., Bhattarai, M., &
Willför, S. (2019). Environmentally-compatible alkyd paints stabilized by wood
hemicelluloses. Industrial Crops and Products, 133, 212–220.
Mikkonen, K. S., Merger, D., Kilpeläinen, P., Murtomäki, L., Schmidt, U. S., & Wilhelm, M.
(2016). Determination of physical emulsion stabilization mechanisms of wood
hemicelluloses via rheological and interfacial characterization. Soft Matter, 12(42),
8690–8700.
Mikkonen, K. S., Xu, C., Berton-Carabin, C., & Schroën, K. (2016). Spruce galactoglucomannans in rapeseed oil-in-water emulsions: Efficient stabilization performance and
structural partitioning. Food Hydrocolloids, 52, 615–624.
Perez-Rea, D., Zielke, C., & Nilsson, L. (2017). Co-elution effects can influence molar mass
determination of large macromolecules with asymmetric flow field-flow fractionation
coupled to multiangle light scattering. Journal of Chromatography A, 1506, 138–141.
Pickering, S. U. (1907). CXCVI.—Emulsions. Journal of the Chemical Society.
Transactions, 91(0), 2001–2021.
Pitkänen, L., Tenkanen, M., & Tuomainen, P. (2011). Behavior of polysaccharide assemblies in field-flow fractionation and size-exclusion chromatography. Analytical
and Bioanalytical Chemistry, 399(4), 1467–1472.
Podzimek, S. (2011). Asymmetric Flow Field Flow Fractionation. Light Scattering, Size
Exclusion Chromatography and Asymmetric Flow Field Flow Fractionation259–305.
Runyon, J. R., Ulmius, M., & Nilsson, L. (2014). A perspective on the characterization of
colloids and macromolecules using asymmetrical flow field-flow fractionation.
Colloids and Surfaces A: Physicochemical and Engineering Aspects, 442, 25–33.
Schoultz, S. V. (2015). Method for extracting biomass. In U. S. P. a. T. Office (Ed.), Google
Patents. US: CH-Bioforce Oy.
Sjöström, E. (1993). Wood chemistry: fundamentals and applications. Gulf professional
publishing.
Söderqvist Lindblad, M., Ranucci, E., & Albertsson, A. C. (2001). Biodegradable polymers
from renewable sources. New hemicellulose‐based hydrogels. Macromolecular Rapid
Communications, 22(12), 962–967.
Sundberg, A., Sundberg, K., Lillandt, C., & Holmhom, B. (1996). Determination of
hemicelluloses and pectins in wood and pulp fibres by acid methanolysis and gas
chromatography. Nordic Pulp & Paper Research Journal, 11(4), 216.
Valoppi, F., Lahtinen, M., Bhattarai, M., Kirjoranta, S. J., Juntti, V. K., Peltonen, L., &
Mikkonen, K. S. (2019). Centrifugal fractionation of softwood extracts improves
biorefinery workflow and yields functional emulsifiers. Green Chemistry, 21,
4691–4705.
Wahlund, K.-G. (2013). Flow field-flow fractionation: Critical overview. Journal of
Chromatography A, 1287, 97–112.
Westbye, P., Köhnke, T., Glasser, W., & Gatenholm, P. (2007). The influence of lignin on
the self-assembly behavior of xylan rich fractions from birch (Betula pendula).
Cellulose, 14, 603–613.
Willför, S., Rehn, P., Sundberg, A., Sundberg, K., & Holmbom, B. (2003). Recovery of
water-soluble acetylgalactoglucomannans from mechanical pulp of spruce. Tappi
Journal, 2(11), 27–32.
Xu, C., Willfor, S., Sundberg, K., Pettersson, C., & Holmbom, B. (2007). Physico-chemical
characterization of spruce galactoglucomannan solutions: stability, surface activity
and rheology. Cellulose Chemistry Technology, 41(1), 51.
Zielke, C. (2017). On the Aggregation of Cereal β-Glucan and its Association with other
Biomolecules: A Study using Asymmetric Flow Field-Flow Fractionation (AF4), Vol. Doctor
of Philosophy, Lund: Lund University195 Department of Food Technology.
Zielke, C., Fuentes, C., Piculell, L., & Nilsson, L. (2018). Co-elution phenomena in polymer
mixtures studied by asymmetric flow field-flow fractionation. Journal of
Chromatography A, 1532, 251–256.
G. Zinovyev , I. Sulaeva , S. Podzimek , D. Rössner , I. Kilpeläinen , I. Sumerskii , A.
Potthast , Getting Closer to Absolute Molar Masses of Technical Lignins.2018 11 (18),
3259-3268.
Declaration of Competing Interest
There are no conflicts of interest to declare.
Acknowledgement
We thank Dr. Petri Kilpeläinen at the Natural Resource Institute
Finland for providing GGM extracts. Dr. Stefan Böhmdorfer and Dr.
Ivan Sumersky at the University of Natural Resources and Life Sciences,
Austria, are acknowledged for technical assistance during AF4 measurements. Benita Löflund, and Pasi Laurinmäki, University of Helsinki,
are acknowledged for technical assistance in performing Cryo-TEM
imaging, which was carried out with the support of Biocenter Finland
and the Instruct-FI CryoEM core facility, University of Helsinki. Dr.
Fabio Valoppi is acknowledged for assistance during sample preparation for synchrotron experiments at Diamond Light Source Synchrotron
Facility. Julia Varis is acknowledged for her help to draw the graphical
abstract.
References
Al-Rudainy, B., Galbe, M., Arcos Hernandez, M., Jannasch, P., & Wallberg, O. J. P. (2019).
Impact of lignin content on the properties of hemicellulose hydrogels. Polymers,
11(1), 35.
Alakalhunmaa, S., Parikka, K., Penttilä, P. A., Cuberes, M. T., Willför, S., Salmén, L., ...
Mikkonen, K. S. (2016). Softwood-based sponge gels. Cellulose, 23(5), 3221–3238.
Bai, L., Greca, L. G., Xiang, W., Lehtonen, J., Huan, S., Nugroho, R. W. N., & Rojas, O. J.
(2019). Adsorption and Assembly of Cellulosic and Lignin Colloids at Oil/Water
Interfaces. Langmuir, 35(3), 571–588.
Bhattarai, M., Pitkanen, L., Kitunen, V., Korpinen, R., Ilvesniemi, H., Kilpelainen, P. O., &
Mikkonen, K. S. (2019). Functionality of spruce galactoglucomannans in oil-in-water
emulsions. Food Hydrocolloids, 86, 154–161.
Bhattarai, M., Valoppi, F., Hirvonen, S. P., Hietala, S., Kilpelainen, P. O., Aseyev, V., ...
Mikkonen, K. S. (2020). Time-dependent self-association of spruce galactoglucomannans depends on pH and mechanical shearing. Food Hydrocolloids, 102, 105607.
Chadni, M., Grimi, N., Bals, O., Ziegler-Devin, I., & Brosse, N. (2019). Steam explosion
process for the selective extraction of hemicelluloses polymers from spruce sawdust.
Industrial Crops and Products, 141, 111757.
Chadni, M., Grimi, N., Ziegler-Devin, I., Brosse, N., & Bals, O. (2019). High voltage
electric discharges treatment for high molecular weight hemicelluloses extraction
from spruce. Carbohydrate Polymers, 222, 115019.
Dickinson, E. (2017). Biopolymer-based particles as stabilizing agents for emulsions and
foams. Food Hydrocolloids, 68, 219–231.
Ebringerová, A., Hromádková, Z., & Heinze, T. (2005). Hemicellulose. In T. Heinze (Ed.).
Polysaccharides I: Advances in Polymer Science (pp. 1–67). Berlin: Springer.
Employment, M.o. E. A.a. (2017). Wood based Bioeconomy Solving Global challanges.
Accessed 14th August.2017 www.bioeconomy.fi/publication-wood-basedbioeconomy-solving-global-challenges/.
Guo, M. Q., Hu, X., Wang, C., & Ai, L. (2017). Polysaccharides: Structure and Solubility.
Solubility of Polysaccharides. London, United Kingdom: IntechOpen Limited.
Harding, S. E. (2005). Analysis of Polysaccharides by Ultracentrifugation. Size,
Conformationand Interactions in Solution. In T. Heinze (Ed.). Polysaccharides I:
Structure, Characterization and Use (pp. 211–254). Berlin, Heidelberg: Springer Berlin
Heidelberg.
Jedvert, K., Saltberg, A., Lindström, M. E., & Theliander, H. (2012). Mild steam explosion
and chemical pre-treatment of Norway spruce. BioResources, 7(2), 2051–2074.
Karg, M., & Hellweg, T. (2009). New “smart” poly(NIPAM) microgels and nanoparticle
microgel hybrids: Properties and advances in characterisation. Current Opinion in
Colloid & Interface Science, 14(6), 438–450.
Kilpeläinen, P. O., Hautala, S. S., Byman, O. O., Tanner, L. J., Korpinen, R. I., Lillandt, M.
K. J., ... Ilvesniemi, H. S. (2014). Pressurized hot water flow-through extraction
system scale up from the laboratory to the pilot scale. Green Chemistry, 16(6),
3186–3194.
10