Extraction and characterization of a pectin from coffee (Coffea arabica L.) pulp with gelling properties
Bạn đang xem bản rút gọn của tài liệu. Xem và tải ngay bản đầy đủ của tài liệu tại đây (948.36 KB, 7 trang )
Carbohydrate Polymers 245 (2020) 116473
Contents lists available at ScienceDirect
Carbohydrate Polymers
journal homepage: www.elsevier.com/locate/carbpol
Extraction and characterization of a pectin from coffee (Coffea arabica L.)
pulp with gelling properties
T
Luis Henrique Reichembach, Carmen Lúcia de Oliveira Petkowicz*
Department of Biochemistry and Molecular Biology, Federal University of Parana, PO Box 19046, 81531-980, Curitiba, Parana, Brazil
A R T I C LE I N FO
A B S T R A C T
Keywords:
Agricultural waste
Chemical characterization
Rheology
About 0.5 ton of coffee pulp is generated for each ton of coffee cherry processed. In the present study, this waste
was investigated as a source of pectin. Coffea arabica L. pulp was dried, treated with ethanol and the pectin
extracted with 0.1 M HNO3 (14.6 % yield). Chromatographic, colorimetric and spectroscopic methods were used
for pectin characterization. It had 79.5 % galacturonic acid, high methoxyl content (63.2 %), low levels of
acetylation, protein and phenolics and Mw of 3.921 × 10⁵ g/mol. The pectin from coffee pulp was able to form
gels with high concentration of sucrose or xylitol and low pH. The effect of pH (1.5–3.0), concentrations of pectin
(0.5–2.5 %), sucrose (55–65 %) and xylitol (55–60 %) on the viscoelastic properties was investigated. Gels
prepared with xylitol diplayed similar viscoelastic behavior to the gels prepared with sucrose. The results demonstrated that coffee pulp is a potential source of commercial pectin with gelling properties.
1. Introduction
The growth in population, food production and industrialization
have drastically accelerated the generation of waste material, such as
crop residues, becoming a big concern nowadays (Willy, Muyanga, &
Jayne, 2019). Increased waste generation creates a series of environmental problems, such as contamination of surface and groundwater,
spreading of diseases by birds, insects, and rodents, generation of odors,
release of methane by anaerobic decomposition of waste, changes in
soil pH and microbiome (Ngoc & Schnitzer, 2009). Lignocellulosic
biomass from agricultural wastes has the potential to be recycled and
used for the production of value-added products, such as biofuels, food
additives, organic acids, enzymes and others (Naik et al., 2010).
With a production of ∼ 10 million tons in 2018, (International
Coffee Organization, 2019), coffee is responsible for the generation of
large amounts of different wastes along its processing and consumption,
such as coffee pulp, coffee husks, coffee silver skin, coffee parchment,
coffee wastewater and spent coffee grounds. Coffee pulp accounts for
most of the solid waste generated during coffee wet processing. Nearly
1 ton of pulp is generated for every 2 tons of coffee cherries processed
(Roussos et al., 1995).
Coffee pulp has been investigated as a source of pectin (Garcia et al.,
1991; Otalora, 2018; Rakitikul & Nimmanpipug, 2016). However, in
the studies reported so far the pectins extracted from coffee pulp had no
gelling ability or the gelation properties were not investigated. In
⁎
Corresponding author.
E-mail address: (C.L. de Oliveira Petkowicz).
/>
Available online 05 June 2020
0144-8617/ © 2020 Elsevier Ltd. All rights reserved.
addition, in general the extracted polysaccharides were not properly
characterized. Garcia et al. (1991) used boiling HCl at pH 2 for 1 h to
extract pectin from C. arabica pressed pulp from the Bourbon variety
harvested in Guatemala. The pectin was purified using quaternary
ammonium and ammonium sulfate salts. It had high galacturonic acid
content (91.2 %), low degree of methyl-esterification (DM 23.8 %) and
low molar mass. The purified pectin did not form gel by calcium addition as would be expected for low methoxyl (LM) pectins. Rakitikul
and Nimmanpipug (2016) published a manuscript entitled “Degree of
esterification and gelling properties of pectin structure in coffee pulp”,
however they did not investigate the gelling ability of the extracted
pectin. According to the authors the ground pulp was extracted with
water for removal of pigments. The water insoluble residue was extracted at 80 °C with 6% (w/w) sodium hexametaphosphate at pH 3.
The composition and structure of the polysaccharide was not investigated. Only the DM was determined by titration with NaOH. The
DM was reported to be 93.75 %. The authors assumed with no further
experiments that this high degree of methyl-esterification would result
in good gelation properties. However, this assumption is not true, as
observed for a pectin extracted from mango peel with DM 78.1 % which
did not form a strong gel in the conditions typical for pectin gelation
(Kermani et al., 2015).
More recently, Otalora (2018) has patented a method to obtain
polyphenol functionalized coffee pectin using C. arabica from Colombia. The procedure was carried out by an acid extraction using HCl
Carbohydrate Polymers 245 (2020) 116473
L.H. Reichembach and C.L. de Oliveira Petkowicz
previously described (Colodel et al., 2018). The pectin was hydrolyzed
with 2 M TFA at 120 °C for 2 h. The resulting monosaccharides were
reduced with NaBH4 and then acetylated with pyridine/acetic anhydride. The alditol acetates were extracted with chloroform and analyzed
by gas chromatography (GC). Uronic acid content (UA) was determined
according to Blumenkrantz and Asboe-Hansen (1973), using m-hydroxybiphenyl and concentrated H2SO4/tetraborate for the formation of a
chromogen, measured at 520 nm. Galacturonic acid was used as standard. The experiments were performed in triplicate. The uronic acid
was identified by thin-layer chromatography (TLC) after hydrolysis of
the pectin. A 20 × 20 cm silica gel plate (Merck KGaA, Germany) was
used and the mobile phase was ethyl acetate-propanol-acetic acid-water
(4:2:2:1, v/v). Orcinol-sulfuric acid was used as the detection reagent
(Chaplin & Kennedy, 1994).
at pH 2 for 1 h at 90 °C, followed by an alkali extraction of the residual
product of the first extraction, using NaOH at pH 12 and room temperature. Both extractions were pooled and then treated with laccase.
The resulting pectin was described to have 65.4 % galacturonic acid,
DM 100 % and degree of acetylation (DA) of 97 %. High DA is an undesirable feature, since it has been shown that acetyl contents higher
than 4% can impede gelation (Iglesias & Lozano, 2004).
As differences in the approach used for pectin isolation impact in
the pectin structure and properties, it could be possible to use coffee
pulp from Brazilian Coffea arabica L as source of pectin with gelling
ability. The aim of the present work was to extract and characterize a
pectin with gelling properties from coffee pulp. Differently from previous studies related to coffee pectins, the present study describes the
chemical and structural characterization of the pectin extracted from
coffee pulp that is able to form gel. To our knowledge, this study demonstrates for the first time that coffee pulp can be used to obtain
pectin with gelling ability.
2.4.2. Ash content
Ash content was obtained by thermogravimetric analysis (TGA)
using a Q600 SDT (Ta Instruments, USA). Approximately 100 mg of
pectin was heated from 18 to 800 °C at a rate of 10 °C/min in an atmosphere of synthetic air. The ash content was considered the ratio
between the final and the initial mass. Experiments were performed in
duplicate.
2. Materials and methods
2.1. Materials
Coffee pulp from C. arabica L. was obtained in the São João farm,
located in Ibaiti, Paraná, Brazil (23°5427.7″S 50°0901.4″W). Acetone,
acetic anhydre, ethyl acetate, propanol, acetic acid, H2SO4 and ophosphoric acid were obtained from Merck (Darmstadt, Germany).
Pyridine, sucrose and NaOH were provided by Labsynth (São Paulo,
Brazil). Monosaccharide standards (GalA, Glc. Man, Gal, Rha, Fuc, Ara
and Xyl), m-hydroxybiphenyl, orcinol, comassie brilliant blue G-250,
gallic acid, KBr, bovine serum albumin, NaNO2, NaN3 and penta-Oacetyl-β-D-galactopyranose were from Sigma-Aldrich Corporation
(Missouri, USA). Na2CO3, trifluoroacetic acid (TFA), NaBH4, hydroxylamine, Folin-Ciocalteu reagent and ferric chloride were from
Dinâmica Química Contemporânea Ltda (São Paulo, Brazil). HNO3,
HCl, methanol and chloroform were from FMaia Indústria e Comércio
Ltda (Minas Gerais, Brazil). Xylitol was provided by Linea Alimentos
(Goiás, Brazil) and D2O was obtained from Tedia Company, Inc. (Ohio,
USA).
2.4.3. Moisture
200 mg of the dried pectin CAP was lyophilized in eppendorf tubes
for 24 h. The lyophilized pectin was weighted in order to estimate the
moisture content, which was given by the ratio between the mass after
lyophilization and the inicial mass of vacuum dried pectin.
2.4.4. Protein content
Protein content was measured according to Bradford (1976). The
red form of the Comassie Brilliant Blue G-250 dye was converted to the
blue form upon binding of protein and the absorbance was measured 5
min after dye addition. Bovine serum albumine was used as standard.
Experiments were performed in triplicate.
2.4.5. Phenolic content
Total phenolics content was determined by Singleton and Rossi
(1965) method. Folin-Ciolcateu reagent and aqueous Na2CO3 were used
for the oxidation of phenolates under alkaline conditions. The reduction
of components from Folin-Ciolcateu reagent resulted in the production
of a blue color complex. Absorbance was read at 725 nm and gallic acid
was used as standard. Experiments were performed in triplicate.
2.2. Coffee pulp preparation
Coffee cherries were mechanically depulped and the stripped pulp,
mainly composed of the exocarp and mesocarp (pericarp) of coffee
cherries, was collected, immediately frozen and then freeze-dried. The
dried pulp was ground in a conventional blender and 150 g of the resulting powder was boiled in 1 L of 80 % (v/v) ethanol, under reflux, for
20 min, giving rise to the alcohol insoluble residue (AIR). The AIR was
separated from the ethanol solution by filtration, washed 3 times with
100 mL of absolute ethanol and left to dry at 20 °C. Lastly, it was milled
in an analytical mill IKA-A11 (IKAWerke GmbH & Co. KG, Germany)
and stored at -20 °C for further extraction.
2.4.6. Degree of methyl-esterification (DM)
The DM was determined by Fourier transform infrared spectroscopy
(FT-IR). The peak areas of methyl-esterified and the free carboxyl
groups, at 1749 cm−1 and 1630 cm-1, respectively, were used to calculate the DM of the pectin as previously reported (Vriesmann &
Petkowicz, 2009). Experiments were performed in triplicate.
2.4.7. Degree of acetylation (DA)
Acetyl content of the sample was obtained by the Hestrin (1949)
method. Measurement was made at 540 nm, using penta-O-acetyl-β-Dgalactopyranose as standard. The degree of acetylation (DA) was calculated by the proportion between mols of acetyl and mols of galacturonic acid present at the pectin, according to the equation:
2.3. Pectin extraction
Extraction of pectin from AIR was carried out using boiling 0.1 M
HNO3, with a solid:liquid ratio of 1:25 (w/v), under reflux for 30 min.
The extract was filtered with a polyester fabric and then centrifuged at
5000 rpm for 20 min. Next, the extract was precipitated with 2 volumes
of absolute ethanol and stored for 16 h at 4 °C. The precipitate was
filtered, washed 3 times with 100 mL absolute ethanol and dried under
vacuum, giving rise to CAP (Coffea arabica pectin).
DA (%) =
DA (%) =
2.4. Chemical characterization of the pectin
mols of acetyl
× 100
mols of GalA
acetyl content (%) ữ 43.04
GalA (%) ữ
(%ME ì 190.15) + (%NE × 176.12)
⎤
100
⎦
× 100
Where, ME is methyl-esterified anhydrogalacturonic acid (M = 190.15
g/mol); NE is non-esterified anhydrogalacturonic acid (M = 176.12 g/
2.4.1. Monosaccharide composition
The neutral monosaccharide composition of CAP was obtained as
2
Carbohydrate Polymers 245 (2020) 116473
L.H. Reichembach and C.L. de Oliveira Petkowicz
mol); and acetyl content is the percentage (w/w) of acetyl group (M =
43.04 g/mol) in the sample. Experiments were performed in triplicate.
Table 1
Yield, chemical composition and molecular features of CAP.
Yielda (%)
2.4.8. Nuclear magnetic resonance spectroscopy (NMR)
Pectin was solubilized in D2O in a concentration of 40 mg/mL and
the spectra of heteronuclear single quantum coherence (HSQC) NMR
and 13C NMR were obtained at 70 °C, using a Bruker DRX 400 Avance
spectrometer (Bruker, Germany). Acetone was used as internal standard
(δ = 30.2 for 13C and δ = 2.22 for 1H). Data were analyzed by TopSpin
software, version 3.5 (Bruker, Germany).
14.6 ± 0.6
b
Moisture (%)
Protein (g/100 g)c
Phenolics (g/100 g)c
Ashes (g/100 g)d
Monosaccharide (relative %)e
Rha
Fuc
Ara
Xyl
Man
Gal
Glc
GalA
HGf(%)
RG-If (%)
(Ara + Gal)/Rha
DM (%)g
DA (%)c
Mw (g/mol)h
Mw/Mnh
2.4.9. High performance size exclusion chromatography (HPSEC)
Analyses by high performance size exclusion chromatography
(HPSEC) were performed to determine the average molar mass (Mw)
and polydispersity (Mw/Mn) of the pectin fraction, as previously described (Colodel et al., 2018). Four Ultrahydrogel columns (Waters
Corporation, USA) were connected in series (2000; 500; 250; 120) and a
refractive index (RI) (Waters Corporation, USA) and a Dawn-F multiangle laser light scattering (MALLS) (Wyatt Technology, USA) detectors
were used. The eluent was 0.1 M NaNO2 and 0.02 % NaN3 at a flow rate
of 0.6 mL/min. The samples were filtered through a 0.22 μm cellulose
acetate membrane before injection. The differential refractive index
increment (dn/dc) value of the solvent-solute solution was determined
using concentrations of 0.2–1.0 mg/mL of pectin. The dn/dc was used
to calculate the molar mass by light scattering. Data were analyzed
using ASTRA software (Wyatt Technology, USA).
13.0 ± 1.2
1.4 ± 0.1
0.70 ± 0.03
3.2 ± 1.0
3.1 ± 0.5
traces
2.1 ± 0.1
1.6 ± 0.8
1.3 ± 0.3
8.0 ± 0.9
2.7 ± 0.5
81.2 ± 2.6
78.1
16.3
3.3
63.2 ± 0.8
5.7 ± 0.2
3.921 × 10⁵
1.56 ± 0.03
a
Based on the AIR.
Calculated as loss of mass after lyophilization.
c
Protein, phenolics and degree of acetylation (DA) obtained by colorimetric method.
d
Obtained by thermogravimetric analysis.
e
Neutral monosaccharides determined by GC and GalA
determined by colorimetric method and identified by TLC
(Fig. S1).
f
HG = GalA – Rha and RG-I = 2(Rha) + Ara + Gal
(M’sakni et al., 2006).
g
Degree of methyl-esterification (DM) determined by FTIR.
h
Obtained by HPSEC-RI/MALLS (dn/dc 0.122).
b
2.5. Investigation of the gelling properties of the pectin
Pectin gels were prepared using different conditions: pectin (0.5–2.5
%, w/w), sucrose (55–65 %, w/w), xylitol (55–60 %, w/w) and pH
(1.5–3.0). Solutions of pectin, sucrose or xylitol were prepared in
deionized water and then mixed under stirring. The pH was adjusted
with 0.1 M HNO3 and the solution was boiled under stirring until it
reached the appropriate weight (∼5 min). The gels were left at 4 °C
overnight and then at 20 °C for at least 1 h prior to the analyses.
Rheological analyses were performed at 25 °C with a plate/plate
geometry (P35 Ti L) using a Thermo Scientific Haake Mars rheometer
(Haake GmbH, Germany) coupled to a thermostatic bath (Haake K15),
a Haake DC5 heating control and a Haake UTMC unit. Frequency
sweeps were carried out in the range of 0.01–10 Hz under stress within
the linear viscoelastic region, obtained by stress sweeps (0.01−10 Pa)
at the frequency of 1 Hz. All the experiments were performed in triplicate and error bars are the standard deviation of the averages.
monosaccharides typical from pectins.The GalA content relative to the
polysaccharide portion, obtained excluding moiety, ashes, protein and
phenolics, was 81.2 %. If the amount of GalA is calculated excluding
only the ash and moisture, a content of 79.5 % ± 2.5 is obtained. This
value is in accordance with the Food and Agricultural Organization
(FAO) and the European Union (EU) commercial requirements, in
which pectin must consist of at least 65 % of galacturonic acid on the
ash and moisture-free mass (May, 1990).
The monosaccharide composition was used to estimate the amount
of HG and RG-I of CAP (Table 1). The pectin was mainly composed of
HG (78.1 %). The value of the ratio (Ara + Gal)/Rha revealed short
side chain length. A higher value of this ratio (10.8) was previously
reported by Otalora (2018) for a pectin extracted from coffee pulp. The
difference is probably due to the milder acid extraction conditions (90
°C and pH 2) that results in less degradation and longer side chains of
RG-I. After the acid extraction, the author used an alkali extraction (pH
12) at room temperature, which could promote β-elimination, decreasing the main chain size and also resulting in higher ratio (Ara +
Gal)/Rha. The different origin (Brazil x Colombia) and pretreatment of
the raw material might also cause differences in the extracted pectins.
The protein content of CAP (Table 1) was in the range of values
reported for commercial apple pectin (1.6 %) (Kravtchenko et al., 1992;
Leroux et al., 2003) and lower than that found for coffee mucilage
pectin (3.4 %) (Avallone et al., 2000). The content of phenolics was
higher than found for citrus pectin (0.15−0.18%), but the same described for apple pectin (0.6 %) (Kravtchenko et al., 1992).
The peak areas of methyl-esterified and unesterified carboxyl
groups from FT-IR spectra (Fig. S2) were used to determine the DM
(Table 1). CAP was classified as a high methoxyl (HM) pectin, different
from the results reported by Garcia et al. (1991), who obtained LM
pectins from coffee pulp. CAP had a DM similar to pectins from coffee
3. Results and discussion
3.1. Extraction and chemical characterization of coffee pulp pectin
The dried pulp was treated with ethanol solution resulting in the
AIR. This procedure was used for removal of pigments, low molar mass
compounds and inactivation of endogenous enzymes. Freezing and
drying the raw material prior to the ethanol treatment is also crucial to
avoid pectinolytic enzymes activity.
The AIR was subjected to an acid extraction with boiling 0.1 M
HNO3 for 30 min, giving rise to fraction CAP (Table 1). The yield of CAP
(14.6 %) was higher than that found by Garcia et al. (1991) for pectins
extracted from pressed coffee pulp with boiling HCl at pH 2 for 1 h
(∼5%). The yield was also higher than those reported for pectins from
other agricultural wastes such as cacao pod husks (9.5 %) (Vriesmann
et al., 2011), peapods (8.3 %) (Müller-Maatsch et al., 2016) and sunflower heads (11.6 %) (Iglesias & Lozano, 2004). However, the yield
was lower than that described for pectins from orange peel (20.6 %),
which is the main agroindustrial waste used for commercial production
of pectin (Ma et al., 1993).
The
monosaccharide
composition
(Table
1)
showed
3
Carbohydrate Polymers 245 (2020) 116473
L.H. Reichembach and C.L. de Oliveira Petkowicz
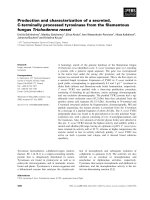
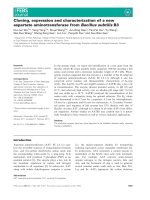
Fig. 1. 1H-13C HSQC NMR spectrum of CAP in D2O using acetone as internal standard.
2007; Ovodova et al., 2005).
The results suggest that CAP is composed mainly of high methoxyl
homogalacturonan and RG-I side chains are mainly substituted with
short chains of β-(1→4) galactans.
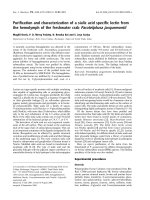
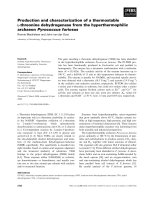
The elution profile of CAP by HPSEC analysis is depicted in Fig. 2.
CAP had a prominent peak eluting around 50 min, detected by both
refractive index (RI) and light scattering. The average molar mass (Mw)
and polydispersity index (Mw/Mn) calculated by light scattering are
given in Table 1.
Garcia et al. (1991) reported Mw of 2.236.104 g/mol for a pectin
extracted from pulp of Guatemalan coffee, more than 10 times lower
than the value found in the present study. The extraction was conducted
with pressed pulp, with no pretreatment, using boiling HCl for 1 h, at
pH 2. The dissimilarities in the experimental protocol and variety of
coffee used in that study may explain the difference. The molar mass of
CAP was higher than other pectins from plant wastes, such as melon
peel (6.76.104 g/mol) (Raji et al., 2017) and passion fruit rind (5.136.37.104 g/mol) (Yapo & Koffi, 2006). The polydispersity index was in
the range of the values found for commercial citrus pectins (1.38–1.88)
(Corredig & Wicker, 2001).
mucilage (61.8 %; Avallone et al., 2000) and the value is in the range of
slow set pectins (DM between 58–65 %) (May, 1990).
The acetyl content of CAP was estimated to be 1.1 % and it was used
to calculate the DA (Table 1). The DA found for CAP was much lower
than the value reported for a pectin from Colombian coffee pulp obtained by sequential extraction with acid and alkali (97 %, Otalora,
2018). The relatively low DA found for Brazilian coffee pectin is favorable for gel formation, since high acetyl contents has been associated with poor gelling properties of pectins (Oosterveld et al., 2000).
Structural information about coffee pectin was obtained by HSQC
NMR (Fig. 1). Chemical shifts (δ) of homogalacturonan were found for
esterified (E) and unesterified (U) galacturonic acid, with the methoxyl
group of E appearing at δ 3.82/52.9. H1/C1 signals of →4)α-D6MeGalAp(1→ were found at δ 4.97/100.1 when linked to another
esterified unit (EE) and at δ 4.92/100.1 when linked to a unesterified
unit (EU). Anomeric H1/C1 signals of →4)α-D-GalAp(1→ appeared at δ
5.09/99.8 for UE and δ 5.16/99.7 for UU. Chemical shifts of H2/C2,
H3/C3, H4/C4 and H5/C5 of →4)α-D-6MeGalAp(1→ were found at δ
3.76/68.0, 4.00/68.2, 4.47/78.4 and 5.04/70.6, respectively, while
those of →4)α-D-GalAp(1→ at δ 3.76/68.0, 4.10/69.6, 4.47/78.4 and
5.32/70.7. Signals from rhamnosyl residues and galactans evidenced
the presence of rhamnogalacturonan I. Unbranched rhamnosyl presented stronger signals than branched rhamnosyl, suggesting that most
of RG-I region from CAP was not substituted. Signals from H1/C1 and
H3/C3 from both rhamnosyl units were detected at δ 5.23/99.1 and
3.90/73.7. H2/C2 and H6/C6 of →2)α-L-Rhap(1→ were respectively
found at δ 4.15/77.6 and 1.26/16.5 while H2/C2, H5/C5 and H6/C6 of
→2,4)α-L-Rhap(1→ appeared at δ 4.11/77.0, 3.54/70.9 and 1.31/16.7.
The signals at δ 4.62/104.4, 3.69/74.7, 3.78/73.5, 4.15/77.6 and 3.79/
60.9 were assigned to H1/C1, H2/C2, H3/C3, H4/C4 and H6/C6 of →
4)β-D-Galp(1→. Terminal galactosyl residues (t-β-D-Galp(1→) were also
found in the spectrum, presenting signals of H1/C1 and H3/C3, with
respective chemical shifts of δ 4.47/103.6 and 3.67/72.2. Acetyl group
was found at δ 2.08/20.2, indicating acetylation at C-3 position of GalA
(Renard & Jarvis, 1999). 13C NMR spectrum was used to obtain the
signals of carboxylic carbons of methyl-esterified and unesterified galacturonic acid, found at δ 170.6 for →4)α-D-6MeGalAp(1→ and at δ
172.2 for →4)α-D-GalAp(1→ (data not shown). All the assignments
were based on the literature (Colodel et al., 2018; Golovchenko et al.,
3.2. Gelling properties of coffee pulp pectin
The word pectin is derived from the Greek (πηχτoς) meaning ‘to
congeal, solidify or curdle’ in reference to its more remarkable property, which is the ability to form gel under specific conditions.
Fig. 2. Elution profile of CAP obtained by HPSEC using RI and MALLS (90° is
shown) detectors.
4
Carbohydrate Polymers 245 (2020) 116473
L.H. Reichembach and C.L. de Oliveira Petkowicz
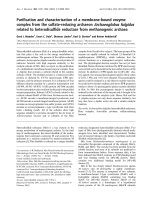
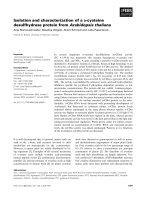
Fig. 3. Effect of pectin concentration on the viscoelastic behavior of CAP with
60 % (w/w) sucrose at pH 2.0 (A) and values of G’ and G” at the frequency of 1
Hz as a function of pectin concentration (B).
Fig. 4. Effect of pH on the viscoelastic behavior of 1.5 % (w/w) CAP with 60 %
(w/w) sucrose (A) and the values of G’ and G” at the frequency of 1 Hz as
function of pH (B).
However, not all pectins extracted so far are able to form gels, such as
those from peels of mango (Kermani et al., 2015), banana, cempedak,
papaya, pineaple, rambutan (Normah & Hasnah, 2000) and sugar beet
(May, 1990). Concerning the pectins from coffee pulp, it was not found
any study describing their ability to form gel. Instead, Garcia et al.
(1991) extracted and purified a LM pectin from C. arabica pressed pulp
which did not form gel.
In the present study, the gelling properties of CAP, extracted from
Brazilian Coffea arabica pulp, was investigated. Frequency sweeps of
gels prepared with 60 % (w/w) sucrose, pH 2.0 and 0.5–2.5 % (w/w)
CAP are depicted in Fig. 3-A. Pectin gelation occurred for all concentrations tested, given that G’ was higher than G” over the analyzed
frequency range. Overall, G’ was less frequency dependent than G”.
There was a clear tendency for stronger gels to be produced in more
concentrated pectin solutions (Fig. 3-B). A higher concentration of
pectin results in increased self-association by hydrogen bonds involving
the protonated carboxyl groups and hydrophobic interactions between
methoxyl groups (Willats et al., 2006). Previous reports on pectins from
different sources also found that the increase of pectin concentration
produced stronger gels, as observed for gels prepared with cacao pod
husk pectin (Vriesmann & Petkowicz, 2013) and an HM pectin from
apple, which had an increase in the gel hardness from 10.2–20.4 g when
the pectin concentration was increased from 2 to 3% (w/v) (RascónChu et al., 2009). The concentration of 1.5 % CAP was chosen to investigate the effect of pH and sucrose content on the gel properties.
At pH values around 3.0, a rapid setting pectin (DM above 72 %)
will be capable of forming gel, while a slow-set pectin (DM between 58
and 65 %) will require lower pH for gelation (May, 1990). Since CAP
was classified as slow-set, the gels were prepared in pH values of 1.5;
2.0; 2.5; 2.87 and 3.0. The pH of 2.87 was used because it was the
natural pH at the pectin concentration used to prepare the gels (1.5 %,
w/w). The gels had similar viscoelastic behavior (Fig. 4 - A and B),
except for pH 3.0, which showed a marked decrease in the values of the
moduli. According to May (1990), if the sugar content is held constant,
the effect of changes in the pH is seen as a loss in strength above a
certain critical pH (May, 1990). For coffee pectin, this critical pH
is > 2.87 and ≤ 3.0, since the decrease in moduli was seen for the gel
prepared at pH 3. Up to pH 2.87, the values of G’ were around 10 orders
of magnitude greater than G’’ at the frequency of 1 Hz, indicating that
the natural pH of CAP is suitable to be used for gelation with no need of
pH adjustments.
Owens and Maclay (1946) were the first to describe that the maximum pH at which pectin gels could be formed decreased with decreasing methoxyl content. They found that the maximum pH could
vary from 2.9 to 3.5, depending on the DM and it was not influenced by
Mw or pectin concentration. As for coffee pectin, one single optimum
pH was not observed in the moduli vs pH curves presented by the authors for lemon peel and commercial citrus pectins.
El-Nawawi and Heikel (1997) investigated the relationship between
the gelling power and pH of pectins with different degrees of methylesterification. They found that HM pectins with lower DM produced
gels with maximum strength at a narrower range of pH than those with
higher DM. The low DM pectins resulted in weaker gels in the higher
pHs (2.8–3.1). For a pectin with DM of 61 %, close to the DM of CAP
(63 %), gels prepared with 55 % sucrose had the maximum strength in
the pH range from 2.2 to 2.7, with little difference among the different
pHs, as found for coffee pectin. However, values of pH lower than 2.2
were not tested by the authors. A pH of 2.5 was chosen to evaluate the
effect of the cosolute concentration on the gelling properties of CAP.
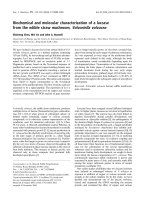
Gelation of HM pectins requires a low water activity that may be
achieved by addition of soluble solids or a water-miscible solvent.
Almost all applications depend on sucrose as water activity-reducing
substance, being the absolute lower and upper limits around 55 % and
65 %, respectively (Rolin & De Vries, 1990). Therefore, gels with concentrations of sucrose of 55, 60 and 65 % (w/w) were compared (Fig. 5
- A). There was an increase in gel strength at higher concentrations of
sucrose due to the optimization of water removal from pectin, enhancing the interactions between chains and the formation of junction
zones. Increased gel strength using higher sucrose contents was observed for other HM pectins, such as cupuassu pulp pectin (Vriesmann
5
Carbohydrate Polymers 245 (2020) 116473
L.H. Reichembach and C.L. de Oliveira Petkowicz
acetylation can be extracted with boiling HNO3 for 30 min from the
pulp of Brazilian Coffeea arabica. The pectin was able to form gel in the
presence of high concentration of sucrose or xylitol and low pH.
Overall, Brazilian coffee pectin appears a suitable ingredient for use in
the food industry, which makes coffee pulp a potential source for pectin
extraction.
Acknowledgements
The authors are grateful to NMR Center of UFPR for NMR analyses,
to São João farm for providing coffee pulp and to the Brazilian agencies
CAPES - Finance Code 001 and CNPq for the financial support. C.L.O.P.
is a research member of the CNPq (309159/2018-0).
Appendix A. Supplementary data
Supplementary material related to this article can be found, in the
online version, at doi:.
References
Avallone, S., Guiraud, J.-P., Guyot, B., Olguin, E., & Brillouet, J.-M. (2000).
Polysaccharide constituents of coffee-bean mucilage. Journal of Food Science, 65,
1308–1311.
Blumenkrantz, N., & Asboe-Hansen, G. (1973). New method for quantitative determination of uronic acids. Analytical Biochemistry, 54, 484–489.
Bradford, M. (1976). A rapid and sensitive method for the quantitation of microgram
quantities of protein utilizing the principle of protein-dye binding. Analytical
Biochemistry, 72, 248–254.
Chaplin, M. F., & Kennedy, J. F. (1994). Carbohydrate analysis: A practical approach (2nd
ed.). Oxford: Oxford University Press.
Colodel, C., Vriesmann, L. C., & Petkowicz, C. L. O. (2018). Cell wall polysaccharides from
Ponkan mandarin (Citrus reticulata Blanco cv. Ponkan) peel. Carbohydrate Polymers,
195, 120–127.
Corredig, M., & Wicker, L. (2001). Changes in the molecular weight distribution of three
commercial pectins after valve homogenization. Food Hydrocolloids, 15, 17–23.
El-Nawawi, S. A., & Heikel, Y. A. (1997). Factors affecting gelation of high-ester citrus
pectin. Process Biochemistry, 32, 381–385.
Garcia, R., Arriola, D., de Arriola, M. C., de Porres, E., & Rolz, C. (1991). Characterization
of coffee pectin. LWT - Food Science and Technology, 129, 125–129.
Giacomazza, D., Bulone, D., Biagio, P. L. S., Marino, R., & Lapasin, R. (2018). The role of
sucrose concentration in self-assembly kinetics of high-methoxyl pectin. International
Journal of Biological Macromolecules, 122, 1183–1190.
Golovchenko, V. V., Bushneva, O. A., Ovodova, R. G., Shashkov, A. S., Chizhov, A. O., &
Ovodova, Y. S. (2007). Structural study of bergenan, a pectin from Bergenia crassifolia. Russian Journal of Bioorganic Chemistry, 33, 47–56.
Hestrin, S. (1949). The reaction of acetylcholine and other carboxylic acid derivatives
with hydroxylamine, and its analytical application. The Journal of Biological
Chemistry, 180, 249–261.
Iglesias, M. T., & Lozano, J. E. (2004). Extraction and characterization of sunflower
pectin. Jounal of Food Engineering, 62, 215–223.
International Coffee Organization (2019). Trade statistics tables - Total crop year production
by exporting countries. Available on. < />asp > Accessed in 12.06.2019.
Kermani, Z. J., Shpigelman, A., Pham, H. T. T., Van Loey, A. M., & Hendrickx, M. E.
(2015). Functional properties of citric acid extracted mango peel pectin as related to
its chemical structure. Food Hydrocolloids, 44, 424–434.
Kravtchenko, T. P., Voragen, A. G. J., & Pilnik, W. (1992). Analytical comparison of three
industrial pectin preparations. Carbohydrate Polymers, 18, 17–25.
Leroux, J., Langendorff, V., Schick, G., Vaishnav, V., & Mazoyer, J. (2003). Emulsion
stabilizing properties of pectin. Food Hydrocolloids, 17, 455–462.
M’sakni, N. H., Majdoub, H., Roudesli, S., Picton, L., Cerf, D. L., Rihouey, C., et al. (2006).
Composition, structure and solution properties of polysaccharides extracted from
leaves of Mesembryanthenum crystallinum. European Polymer Journal, 42, 786–795.
Ma, E., Cervera, Q., & Sánchez, G. M. M. (1993). Integrated utilization of orange peel.
Bioresource Technology, 44, 61–63.
May, C. D. (1990). Industrial pectins: Sources, production and applications. Carbohydrate
Polymers, 12, 79–99.
Müller-Maatsch, J., Bencivenni, M., Caligiani, A., Tedeschi, T., Bruggeman, G., Bosch, M.,
et al. (2016). Pectin content and composition from different food waste streams. Food
Chemistry, 201, 37–45.
Naik, S. N., Goud, V. V., Rout, P. K., & Dalai, A. K. (2010). Production of first and second
generation biofuels: A comprehensive review. Renewable and Sustainable Energy
Reviews, 14, 578–597.
Ngoc, U. N., & Schnitzer, H. (2009). Sustainable solutions for solid waste management in
Southeast Asian countries. Waste Management, 29, 1982–1995.
Normah, O., & Hasnah, K. A. K. (2000). Pectin content of selected local fruit by-products.
Journal of Tropical Agriculture and Food Science, 28, 195–201.
Oosterveld, A., Beldman, G., Leeuwen, S.-V. M. J. F., & Voragen, A. G. J. (2000). Effect of
Fig. 5. Effect of cosolute concentration on the viscoelastic behavior of 1.5 %
(w/w) CAP at pH 2.5 with 55-65 % (w/w) sucrose (A) and 55-60 % (w/w)
xylitol (B) and values of G’ and G” at the frequency of 1 Hz as function of
cosolute concentration (C).
et al., 2010) and commercial citrus pectin (Giacomazza et al., 2018).
The increasing concern regarding to health problems caused by
excessive sugar ingestion enhanced the demand for low-sugar products.
Tsoga, Richardson, and Morris (2004) investigated the role of cosolutes
in the gelation of a commercial pectin with DM 70 %. They used different polyols, including sweeteners like xylitol and sorbitol. Sorbitol
has two-third calories of sucrose but only 60 % of its sweetness
(PubChem, 2019). On the other hand, xylitol has the same sweetness of
sucrose, but only one-third of its calories (Ur-Rehman et al., 2015).
Therefore, the viscoelastic properties of CAP with 55 and 60 % (w/w)
xylitol were investigated (Fig. 5 - B). The mechanical spectra confirmed
that CAP formed gels when sucrose was replaced by xylitol. When the
concentration of xylitol was increased from 55 to 60 % (w/w), the raise
in the values of the moduli was less pronounced than when sucrose was
used. However, the substitution of sucrose by xylitol produced gels with
similar viscoelastic behavior as compared in Fig. 5 – C, indicating that
CAP and xylitol might be used in the manufacture of low-calorie products.
The results suggest that the pectin from Coffea arabica pulp could be
used in regular or low-calorie preparations that require gel formation at
high contents of dissolved solids and low pH, such as confectionary
jellies and jams. It probably could also be used in acidified dairy drinks
and yogurts.
4. Conclusion
An HM pectin with more than 75 % GalA and low degree of
6
Carbohydrate Polymers 245 (2020) 116473
L.H. Reichembach and C.L. de Oliveira Petkowicz
42, 756–762.
Singleton, V. L., & Rossi, J. A. (1965). Colorimetry of total phenolics with phosphomolybdic-phosphotungstic acid reagents. American Journal of Enology and Viticulture, 16,
144–158.
Tsoga, A., Richardson, R. K., & Morris, E. R. (2004). Role of cosolutes in gelation of highmethoxy pectin. Part 1. Comparison of sugars and polyols. Food Hydrocolloids, 18,
907–919.
Ur-Rehman, S., Mushtaq, Z., Zahoor, T., Jamil, A., & Anjum, M. (2015). Xylitol: A review
on bioproduction, application, health benefits, and related safety issues. Critical
Reviews in Food Science and Nutrition, 55, 1514–1528.
Vriesmann, L. C., & Petkowicz, C. L. O. (2009). Polysaccharides from the pulp of cupuassu
(Theobroma grandiflorum): Structural characterization of a pectic fraction.
Carbohydrate Polymers, 77, 72–79.
Vriesmann, L. C., & Petkowicz, C. L. O. (2013). Highly acetylated pectin from cacao pod
husks (Theobroma cacao L.) forms gel. Food Hydrocolloids, 33, 58–65.
Vriesmann, L. C., Silveira, J. L. M., & Petkowicz, C. L. O. (2010). Rheological behavior of a
pectic fraction from the pulp of cupuassu (Theobroma grandiflorum). Carbohydrate
Polymers, 79, 312–317.
Vriesmann, L. C., Teófilo, F. R., & Petkowicz, C. L. O. (2011). Optimization of nitric acidmediated extraction of pectin from cacao pod husks (Theobroma cacao L.) using response surface methodology. Carbohydrate Polymers, 84, 1230–1236.
Willats, W. G. T., Knox, J. P., & Mikkelsen, J. D. (2006). Pectin: New insights into an old
polymer are starting to gel. Trends in Food Science & Technology, 17, 97–104.
Willy, D. K., Muyanga, M., & Jayne, T. (2019). Can economic and environmental benefits
associated with agricultural intensification be sustained at high population densities?
A farm level empirical analysis. Land Use Policy, 81, 100–110.
Yapo, B. M., & Koffi, K. L. (2006). Yellow passion fruit rind - A potential source of lowmethoxyl pectin. Journal of Agricultural and Food Chemistry, 54, 2738–2744.
enzymatic deacetylation on gelation of sugar beet pectin in the presence of calcium.
Carbohydrate Polymers, 43, 249–256.
Otalora, A. F. B. (2018). Pectin extraction from coffee pulp, patent US 9,896,572 B2.
Ovodova, L. R. G., Bushneva, O. A., Shashkov, A. S., Chizhov, A. O., & Ovodov, Y. S.
(2005). Structural studies on pectin from marsh cinquefoil Comarum palustre L.
Biochemistry (Moscow) Supplement Series A, Membrane and Cell Biology, 70, 867–877.
Owens, H. S., & Maclay, W. D. (1946). Effect of methoxyl content of pectin on the
properties of high-solids gels. Journal of Colloid Science, 1, 313–326.
PubChem (2019). Compound summary: Sorbitol. Available on. < i.
nlm.nih.gov/compound/Sorbitol#section=Synonyms > Accessed in 04.08.2019.
Raji, Z., Khodaiyan, F., Rezaei, K., Kiani, H., & Hosseini, S. S. (2017). Extraction optimization and physicochemical properties of pectin from melon peel. International
Journal of Biological Macromolecules, 98, 709–716.
Rakitikul, W., & Nimmanpipug, P. (2016). Degree of Esterification and gelling properties
of pectin structure in coffee pulp. Key Engineering Materials, 675-676, 11–14.
Rascón-Chu, A., Martínez-López, A. L., Carvajal-Millán, E., Ln-Renova, N. E. P.,
Márquez-Escalante, J. A., & Romo-Chacón, A. (2009). Pectin from low quality
‘Golden Delicious’ apples: Composition and gelling capability. Food Chemistry, 116,
101–103.
Renard, C. M. G. C., & Jarvis, M. C. (1999). Acetylation and methylation of homogalacturonans 1: optimisation of the reaction and characterisation of the products.
Carbohydrate Polymers, 39, 201–207.
Rolin, C., & De Vries, J. (1990). Pectin. In P. Harris (Ed.). Food gels (pp. 401–434). Elsevier
Applied Food Science.
Roussos, S., Aquiáhuatl, M. A., Trejo-hernández, M. R., Perraud, I. G., Favela, E.,
Ramakrishna, M., et al. (1995). Biotechnological management of coffee pulp - isolation, screening, characterization, selection of caffeine-degrading fungi and natural
microflora present in coffee pulp and husk. Applied Microbiology and Biotechnology,
7