Effect of cellulose size-concentration on the structure of polyvinyl alcohol hydrogels
Bạn đang xem bản rút gọn của tài liệu. Xem và tải ngay bản đầy đủ của tài liệu tại đây (2.78 MB, 10 trang )
Carbohydrate Polymers 245 (2020) 116612
Contents lists available at ScienceDirect
Carbohydrate Polymers
journal homepage: www.elsevier.com/locate/carbpol
Effect of cellulose size-concentration on the structure of polyvinyl alcohol
hydrogels
T
Gabriel Goetten de Limaa,b,*, Bruno Dias Ferreirac, Mailson Matosa, Bruno Leandro Pereiraa,b,
Michael J.D. Nugentb, Fabrício Augusto Hanseld, Washington Luiz Esteves Magalhóesa,d,**
a
Programa de Pús-Graduaỗóo em Engenharia e Ciờncia dos Materiais - PIPE, Universidade Federal do Paraná, Curitiba, Paraná, Brazil
Materials Research Institute, Athlone Institute of Technology, Athlone, Ireland
c
Departamento de Química, Universidade Federal do Paraná, Curitiba, Paraná, Brazil
d
Embrapa Florestas, Colombo, Brazil
b
A R T I C LE I N FO
A B S T R A C T
Keywords:
PVA
Microfibrillated cellulose
Composite hydrogels
Freeze-thawing
Kraft process
Microfibrillated cellulose as a reinforcement agent has been investigated extensively due to their unique characteristics, which can reorder the structure of polymers and hydrogels leading to improved mechanical properties with minimal disadvantages in terms of the targeted original applications. However, effect of using a
macro- to a micro-fibrillated cellulose onto polyvinyl alcohol hydrogels is still unknown, because of the unique
ability for both to be produced as hydrogels from freeze-thawing mechanisms – hydrogen bonding - there is a
potential synergism. Therefore, macro and microfibrillated kraft bleached paper was synthesised at various
concentrations on polyvinyl alcohol hydrogels. The overall effect presented a strong interaction between both
compounds but it was increased with macrofibrillated cellulose. Increase in crystallinity was also observed with
a macro-sized fibre without variation on tensile elastic modulus but an overall improvement was perceived on
thermal properties and a slower swelling rate with a microfibrillated cellulose.
1. Introduction
Hydrogels are 3D polymer networks that can absorb large quantities
of water. They have been used as drug delivery, wound healing and as
many other biomedical devices (Thakur & Thakur, 2018). However,
adapting the properties of hydrogels to the requirements of a specific
application is essential to create versatile, high-performance functional
materials. The formation of high-resistant hydrogels remains one of the
barriers to effective hydrogel translation for practical applications
(Jabbari, 2019).
The addition of cellulose and its derivatives can change the hydrogel
structure to the intended application, affecting the swelling capacity,
targeted drug-delivery and stimuli response (Gicquel et al., 2019).
There have been many variations of cellulose used in preparing hydrogels, including vegetable cellulose, bacterial cellulose and cellulose
derivatives. The key difference between these variations is in terms of
synthesis process; for example, native cellulose presents a significant
challenge in terms of solubility. This is because it is not easily dissolved
in common solvents, due to its highly extended hydrogen bonding
structure (Fu, Qi, Ma, & Wan, 2019).
⁎
Native cellulose stands out because of microfibrillated cellulose
(MFC), which is achieved by the high energy mechanical homogenization of wood pulp. This process promotes the exposure and
opening of surfaces that were enclosed inside the material, labelled as
fibrils/microfibrils (Claro et al., 2019). This superficial modification
generates a larger area of contact and connection between the microfibrils leading to an increase of the material resistance. Given its high
strength, dimensional anisotropy and natural source of MFC, the use of
nanocellulose as a functional and renewable reinforcing agent for
polymer composites and hydrogels have attracted significant research
interest (Balea, Blanco, & Negro, 2019).
As a reinforcing agent, cellulose in micro and nano sizes can achieve
significant effects in the polymeric material. It has been reported that
the addition of 5 % from microfibrillated cellulose can improve the
tensile strength of polymeric films by up to 40 % (Lin et al., 2019).
Nonetheless, recent reviews state that properties obtained by nano- and
macro-sized cellulose can be comparable to their energy cost to process.
Therefore, the properties of choice could be achieved with a more
economical solution, by tailoring the size of the cellulose and the process method (Hubbe & Grigsby, 2020).
Corresponding authors at: Programa de Pús-Graduaỗóo em Engenharia e Ciờncia dos Materiais - PIPE, Universidade Federal do Paraná, Curitiba, Paraná, Brazil.
Corresponding authors at: EMBRAPA Florestas, Colombo, Paraná, Brazil.
E-mail addresses: (G.G. de Lima), (W.L.E. Magalhães).
⁎⁎
/>Received 28 April 2020; Received in revised form 2 June 2020; Accepted 6 June 2020
Available online 11 June 2020
0144-8617/ © 2020 Elsevier Ltd. All rights reserved.
Carbohydrate Polymers 245 (2020) 116612
G.G. de Lima, et al.
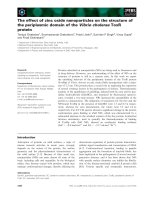
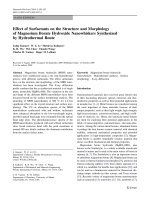
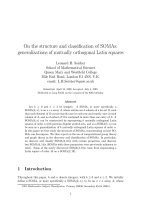
Fig. 1. a) Samples after the final freeze-thawing cycles; b) PVA-M-37 and c) pure PVA; d) chart of number of freeze-thawing cycles required for gel formation.
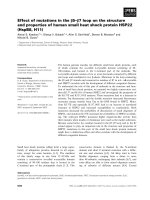
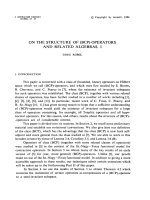
Fig. 2. FTIR of the studied hydrogels using a) cellulose from macrofibrillated suspension and b) MFC, regions labelled as i), ii) and iii) were the most relevant to the
study; c) detailed OH region; the numbers detailed the peak obtained for each studied hydrogel; and d) spectra of the hydrogels with the highest cellulose fraction;
arrows indicate peaks found only on MFC.
formation, the incorporation of MFC in polyvinyl alcohol (PVA) hydrogels can completely modify the structure of the material, so that it
can be used in several specific areas.
Since a decrease in fibre size tends to increase the properties in
MFC, this effect should also be investigated in hydrogels – more specifically from freeze-thawing mechanisms. Therefore, this work
Hydrogels, such as polyvinyl alcohol produced by physical crosslink
via freeze-thawing, lack sufficient integrity, and the addition of cellulose can result in a stronger hydrogel compared to their own counterparts (Fu et al., 2019). However, the effect of adding nanocellulose as a
reinforcing agent is a recent study in hydrogels and has not been fully
elucidated. Because of the very specific physical nature of hydrogel
2
Carbohydrate Polymers 245 (2020) 116612
G.G. de Lima, et al.
supermasscolloider mill. Prior to any process to the pulp, the concentration was adjusted to 3 wt% using distilled water and further
fragmented using a 450 W blender for 10 min.
2.3. Macrofibrillated cellulose suspension
For the macrofibrillated suspension, the pulp in the blender was
further fragmented for more 50 min. This condition was performed
until no cellulose aggregation could be seen by the naked eye against
the light.
2.4. Microfibrillated cellulose suspension
Cellulose suspension after blender for 10 min was subjected to
further grinding using Super Masscolloider (Masuko Sangyo Co. Ltd.,
Japan). The technical parameters related to the microfluidizer in obtaining the cellulose nanofibrils were: rotation 1500 rpm; the number of
steps 30; distance between discs 0.1 mm. Number of steps was related
to the maximum that we could pass the cellulose suspension without
surpassing the maximum amperage of the electric system.
2.5. Blending of polyvinyl alcohol with cellulose suspension
Three conditions for each suspension was used in this work, and
before blending with the polymer, in which distilled water was added to
the cellulose suspension to obtain concentrations of 3 vol.%, 1.5 vol.%
and 0.75 vol.%. Subsequently, PVA was dissolved at the same concentration (5 %w/v) for all cellulose suspensions at 80 °C with constant
stirring until complete solubilisation of PVA was achieved. Finally, the
samples were rapidly frozen to a constant temperature of −20 °C for
two hours using a commercial freezer. The frozen solutions were then
thawed in a controlled temperature environment at 25 °C, this freezethawing procedure was performed six times, and after completion of the
physical crosslink, samples were dried in an oven at 30 °C. The cycle in
which a fully formed gel was able to hold its form, without loss of integrity, was used as another result to characterise its hydrogel property.
The nomenclature of the samples used in this work is followed by
the designation of the cellulose suspension. If used as a blender – B –
and if passed through the mill – M – following to their specific concentrations that was based on the ratio of cellulose in PVA, given the
following percentages (w/w) 9 %, 23 and 37 %.
2.6. Fourier transform infrared spectroscopy (FTIR)
The FT-IR spectra were obtained on a Perkin Elmer spectrometer,
model FT-IR/NIR Frontier, using an attenuated total reflectance (ATR)
accessory with zinc selenide (ZnSe) crystal surface. A resolution of 4
cm−1 and the arithmetic average of 4 scans was used in the wavenumber range of 4000–550 cm−1. Prior measurements, samples were
dried in a vacuum oven at 40 °C until no variation on its weight were
detected; afterwards, samples were cryogenic fractured and a small
piece was analysed for the FTIR.
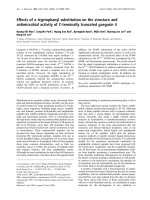
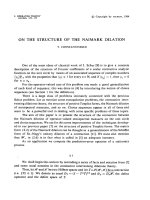
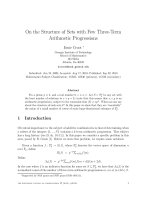
Fig. 3. XRD spectra of a) pure PVA hydrogel and cellulose; and the studied
hydrogels with cellulose from b) macrofibrillated suspension and c) MFC.
investigates the effect of synthesizing micro- and macro-fibrillated
cellulose in freeze-thawing polyvinyl alcohol hydrogels, while varying
the concentration and analysing the resultant hydrogel formation.
2. Materials and methods
2.7. Thermodynamic analysis
2.1. Materials
For the materials studied herein PVA Mowiol® 8–88, M.W. 67,000
Da (Sigma-Aldritch) with 86.7–88.7 mol% hydrolysis. Bleached eucalyptus kraft pulp (Suzano Papel e Celulose) was used as the raw
material for MFC preparation.
For DSC, sample weights between 9−12 mg were measured and
encapsulated in sealed aluminium sample pans. A temperature ramp
from 0 °C to 250 °C at a rate of 10 °C/min was used with an empty
crimped pan as a reference. The crystallinity of the PVA hydrogels was
measured according to Eq. (1):
2.2. Development of fibrillated cellulose suspension
X¯C =
Two cellulose suspensions were used in this work, one based with
blender only and another containing blender and posterior
where Xc is the average crystallinity, ΔHf is the melting enthalpy and Δ
Hf° is the melting enthalpy of a fully crystalline polymer, for PVA –
3
ΔHf (Tm)
(1 − w )ΔH f0 (Tm0 )
(1)
Carbohydrate Polymers 245 (2020) 116612
G.G. de Lima, et al.
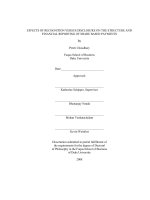
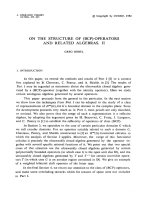
Fig. 4. a) Stress-strain curves for the dried hydrogels performed by the DMA tensile mode and its b) elastic modulus. Capital letters difference between treatments at
same concentration (macrofibrillated cellulose x MFC) and, lowercase letters difference between concentrations in each treatment (PVA, 9, 23 and 37 %).
2.8. X-ray diffractometry (XRD)
Table 1
Thermal properties obtained from DSC, DMA and TGA techniques for the studied hydrogels.
Samples
PVA
PVA-B-9
PVA-B-23
PVA-B-37
PVA-M-9
PVA-M-23
PVA-M-37
MFC Film
DSC
DMA
TGA
Tm (°C)
ΔHf (J/g)
%C
Tg (°C)
Tmax (°C)
T10 (°C)
218.2
219.1
218.2
216.5
217.6
217.5
217.0
–
63.2
56.7
45.2
25.3
57.3
31.1
26.5
–
45.6
45.0
42.4
29.2
45.5
29.2
30.6
–
56
43
47
58
58
61
59
–
366
368
361
275
364
342
361
352
268
296
270
242
290
266
284
277
The X-ray diffractogram patterns were obtained with an X-ray
Diffractometer X XRD 700 (Shimadzu, Japan), using Cu-Kα radiation (k
=1.5418 Å), and settings of 40 kV and 20 mA. The scattered radiation
was detected in the angular range of 10–40° (2θ), with a scanning speed
of 2° min−1 (2θ) and a step of 0.06° (2θ).
2.9. Kinetics of swelling and deswelling of hydrogels
Swelling studies of the composite samples were conducted in
phosphate-buffered saline at pH 7.4. For the swelling properties, the
PVA hydrogels were measured gravimetrically. To measure the swelling
kinetics, the pre-weighted samples were immersed in PBS. Periodically,
samples were removed and the excess surface solution was gently removed with a paper towel and the swollen samples were weighted at
various time intervals. The swelling ratio percentage of a hydrogel was
calculated and plotted against time.
To study the influence of the concentration and degree of MFC defibrillation on the hydrogel. In addition to the swelling analysis, the
swelling data was carried out using a kinetic model of the second order
equation proposed by Schott (Schott, 1992):
For DSC - Tm: melting point of PVA; ΔHf: Heat of fusion for PVA hydrogels; %C:
crystallinity percentage; DMA – Glass transition temperature of PVA and TGA –
Tmax maximum temperature of decomposition and T10 Temperature to decompose 10 % of the hydrogel.
138.60 J/g.
TGA curves were obtained with a heating rate of 10 °C min−1 until
600 °C using alumina pans with samples weighing around 5.0 mg. The
experiments were carried out under nitrogen flow of 50 mL min−1, in a
Q600 TA Instruments. Coupled with the instrument, we used the mass
spectrometry analysis from the same data (TG-MS) to identify the
compounds being released during degradation. The mass spectrometer
was operated at 70 eV, with the scanning range from 1 to 150 Da.
Further, the main fragments (m/z) were selected (i.e. m/z 70, 106, and
96), and for comparison of the intensity signals between the different
samples, for that a normalisation procedure was used (Arenillas,
Rubiera, & Pis, 1999). In this study, the sum of total intensity registered
in the MS for the selected fragments were selected as the normalisation
factor, following it, each signal was also normalised by the sample mass
unit (mg).
DMA analyses were performed on DMA Q800 TA Instruments
equipment using the film tension clamp. First, dried hydrogels with the
same size were tested under a frequency sweep with a temperature
ramp of 5 °C /min up to 160 °C, frequency 1 Hz and pre-load of 1 N, in
order to calculate the glass transition. In addition, stress-strain tests
were also performed with a ramp force of 1 N/min up to 18 N, and the
elastic modulus was calculated from the initial linear region – 0.002 %
strain of the stress-strain curve. All tests from DMA were performed
using three scans per sample.
t
= A + Bt
W
(2)
where B = W∞−1 and A = (dW / dt)−1, W and W∞ are the water
absorption capacity at time t and at equilibrium respectively, B is the
inverse of the theoretical equilibrium swelling and A is the inverse of
the initial swelling rate. Plotting t/W against t it is possible to obtain,
from the angular and linear coefficient, the values of W∞ and Ks; where
Ks is the swelling rate constant (g/g min) and is related by Ks =
(A*W∞2)−1.
Deswelling were also carried out in order to measure the level of
gellification (Gel content) (Jose, Shehzad, & Al-Harthi, 2014). After
samples reached swelling equilibrium, they were placed in an oven at
60 °C and their weight determined at specific interval times until the
weight stabilised. The gel content was calculated by:
Gel content (%) =
Wf
Wi
× 100
(3)
where Wf is the final weight after the hydrogel is completely dried and
Wi the initial weight before going to the oven.
4
Carbohydrate Polymers 245 (2020) 116612
G.G. de Lima, et al.
Fig. 5. Derivative thermogravimetric curves of the MFC (a) and PVA (b) and full MS scans between 50 and 120 Da at central of each diagnostic stage of MFC (c) and
PVA (d, e, f and g).
3. Results and discussion
the main contribution from PVA, due to the highest weight fraction in
the materials (Fig. 2a and b). Its peaks and description are described in
supplemental file S2. However, cellulose shows similar spectra from
PVA and to identify the effect of cellulose addition, peaks from the
highest intensity of the pure cellulose were analysed in each sample.
Addition of cellulose to the structure of PVA hydrogels altered and
shifted some bands for these hydrogels, also shown in supplemental file
S2.
It is also important to mention that, compared to raw MFC, there is a
shift from the common OeH region (3700−2985 cm−1), such region is
related to characteristics of inter- and intra- molecular bonding.
Although a lower content of cellulose led to a higher shift compared to a
higher quantity of MFC, this can be related to the hydrogen bond of
pure PVA. Whereas lower frequencies in the spectra - 3262 for the
highest value - is found for PVA; cellulose is within the 3306 region (Fig. 2c – and in agreement with other works (Shibayama et al., 1991).
Groups OeH can have covalent bonds with ionic character, and
when free, they are shown at higher frequencies. When this group is
within a hydrogen bond, these covalent bonds are weakened and absorb
at lower frequencies (Turki, El Oudiani, Msahli, & Sakli, 2018). We
deduce that, with increasing content of cellulose, there are stronger
3.1. Visual observation and overall macroscopic structure
Hydrogels presented herein were macroscopically very different
(Fig. 1), and at maximum concentration, the hydrated hydrogels exhibited higher macroscopic compressibility resistance than pure PVA.
The hydrogels were also more resistant at the end of the last freeze
thawing cycle, this was also observed by the easier handling during
each freeze thawing steps – Fig. 1b and Supplemental File S1.
The visual opacity of the hydrogel is reduced when cellulose is
added to the structure; though fewer physical crosslink cycles were
needed to gelificate the solution from either cellulose addition (Fig. 1c),
a phenomenon reported before for nanocellulose. The macrofibrillated
cellulose presented a rather similar visual aspect compared to pure PVA
(Fig. 1a and c).
3.2. FTIR measurements
3.2.1. Effect of varying cellulose content
As expected, the microstructure of the hydrogel from FTIR exhibits
5
Carbohydrate Polymers 245 (2020) 116612
G.G. de Lima, et al.
Fig. 6. Derivative thermogravimetric curves of the cross-linked PVA hydrogels with macrofibrillated (a) and MFC (b) celluloses and the evolution profiles of product
ions assigned as crotonaldehyde (c and d), benzaldehyde (e and f) and 2-furfural (g and h) during thermal degradation of cross-linked PVA hydrogels.
Johari, & Jusoh, 2014). They were also compared to macrofibrillated
cellulose, and were attributed to the nano-sized structure of cellulose.
hydrogen bonding forming with cellulose and PVA at the expense of
these free OeH groups and self-bonding of PVA OHe groups, an effect
reported before for thymol (Turki et al., 2018). Though it is quite
possible that, because of the similar structure of PVA and cellulose, both
can form a crosslink by hydrogen bonding (Cai & Zhang, 2006).
Therefore, it may have been enhanced compared to other polymers
crosslinking with cellulose such as polyvinylpyrrolidone (Hatch et al.,
2019). This phenomenon has been reported before for a hydrogel that
crosslinked hemicellulose with PVA (Guan, Bian, Peng, Zhang, & Sun,
2014).
3.3. X ray diffraction analysis
The microstructure of the PVA hydrogels was also investigated
through XRD (Fig. 3), generally, diffraction patterns of PVA hydrogels
have reported having two main peaks on the region from 10 to 30°
(Gupta, Sinha, & Sinha, 2010). Although a new peak can be seen at
28.8°, and it has been suggested this could be a PVA hydrogel peak from
physical crosslink (Xiao, Wu, Zhou, Qian, & Hu, 2017), it could be due
to contaminants or background as the films to perform the analysis
were very thin. For cellulose, there have been four main peaks presented, if deconvoluted (Selarka, Baney, & Matthews, 2013); nonetheless, the peak at 19.32° and 21.92° for PVA corresponds to planes
(101) and (10-1), and 15.88° 22.62° corresponds to cellulose.
In the diffractograms of the hydrogels, the intensities of the main
peak of PVA and cellulose are increased with cellulose content. Physical
crosslinking by freeze-thawing increases crystallinity, which leads to be
insoluble in water and the crystallite is formed by folding PVA chains
via dissolution and rearrangement of these chains (Lee et al., 2017).
The diffraction plane (101) is attributed to the periodic crystal structure
of PVA chains induced by the interference between the PVA chains in
the direction of the intermolecular hydrogen bonding (Huang, Zuo, Li,
& Li, 2009). Therefore, an increase in the intensity of this plane can be
correlated to an increase in the number of well-packed regular PVA
chains.
The addition of cellulose increased the intensity of the (110) plane
due to the crystalline cellulose in the (200) plane. Nonetheless, the
molecular weight of the PVA is rather low and could explain the low
crystallinity found for pure PVA hydrogels, and it is in agreement with a
previous report (Xiao et al., 2017). Since the PVA chains have a more
3.2.2. Effect of varying size of cellulose
The majority of peaks of pure cellulose does not change depending
on the size it was found within the structure of polymers (Duchemin, Le
Corre, Leray, Dufresne, & Staiger, 2016). However, differences on intensity and appearance of new, tough small, peaks were observed depending on the cellulose size (Ma, Liu, Liu, & Sui, 2015).
However, only a specific region was analysed for comparison of
cellulose sizes – regions between 2900−2800 cm−1 (CHe stretching)
represents various cellulose groups and it is difficult to analyse (Aguayo
et al., 2018). In addition to the peak 1651 cm−1, which is associated to
adsorption of water (Kargarzadeh et al., 2012). Nonetheless, bands
which appear after synthesise into MFC are associated with 1472 cm−1,
bending (CH2) scissoring of cellulose (Garside & Wyeth, 2003), and
1456 cm−1 which is characteristic of PVA corresponding to eCHe
bending (Wang, Ding, & Wang, 2019).
For the case of peaks at 1362 cm−1, found both on PVA and pure
cellulose, corresponds from bending (CeH) (Garside & Wyeth, 2003)
and the 1261 cm−1, corresponding to PVA (COe) stretching (Lin,
Cheng, Wei, & Lin, 2011), were mainly visible in the microfibrillated
cellulose (Fig. 2d). The appearance of some of these peaks has been
reported before for PVA and MFC from polymer casting (Lani, Ngadi,
6
Carbohydrate Polymers 245 (2020) 116612
G.G. de Lima, et al.
Fig. 7. Hypothetical physical crosslink structure in the highest cellulose concentrations (37 %). (a and b) PVA + macrofibrillated cellulose in which cellulose is the
major chain entanglement factor and (c and d) PVA + MFC where PVA is the major factor.
chains might be lower being preferably aligned around the cellulose
fibrils.
Previous work has reported that PVA hydrogels tend to form in the
structure zones with rich PVA content with increased crystallinity –
densely packed – and zones with a poor phase resulted in the amorphous region. This aspect can further corroborate our obtained results
(Ricciardi et al., 2005); however, studies have also reported that PVA
and cellulose are miscible in the amorphous region (Shibayama et al.,
1991). Nonetheless, because of the increased crystallinity herein, the
crystals may act as knots and the water acts as the hydrogen bonding
with the hydroxyl groups of the polymers (Guan et al., 2014). Furthermore, it has been reported before that a decrease in PVA crystallinity occurs with increasing cellulose addition (Shibayama et al.,
1991).
restricted movement, due to the high viscosity from the cellulose suspension, they could not self-assemble themselves. Therefore, this decrease in free volume may be due to the additional cellulose polymers
which impact on both the size of the crystallites and the degree of
crystallinity.
The XRD pattern presents a rather interesting mechanism which, we
deduce, that PVA tends to link more with the cellulose chains rather
with their own. Moreover, since these chains are highly oriented towards the cellulose fibres, it could have given this increase in crystallinity. This is further seen with an increase in concentration from both
cellulose suspensions, produced with blender (macrofibrillated cellulose) and with supermasscolloider (mill, MFC), leading to an increase in
both intensities on crystalline of PVA.
Macrofibrillated cellulose (Fig. 3b) resulted in increased peaks from
these hydrogels than the ones produced using MFC. The MFC (Fig. 3c)
incorporated into PVA hydrogels had a decrease in cellulose crystallinity following the profile of pure PVA. However, the lowest concentration had reached similar values on intensity for PVA- cellulose
plane (110) - compared to the blender process; also, there is a sudden
drop on crystallinity at highest concentrations.
We deduce that, because of increased fibre length from macrofibrillated cellulose and lower viscosity, PVA chains could be oriented
and linked with cellulose better than from smaller sizes. This resulted in
the obtained spectra, in which the size of crystallites tends to be smaller
in the MFC (Zheng, Fu, Li, & Wu, 2018). This could also be inferred
from the FTIR results, where the shift from macrofibrillated celluose in
the −OH region (Fig. 2c) were longer than MFC, resulting in stronger
hydrogen bonds. In the case of MFC, the hydrogen bonding from PVA
3.4. Mechanical characterization
Dried hydrogels were tested under tensile tests to understand, and
compare, the effect of cellulose addition to the overall mechanical integrity (Fig. 4). These materials were found to be more resistant when
cellulose was added, even at lower amounts. The mechanical tensile
resistance and profile of pure PVA hydrogel at this molecular weight is
within the values obtained by a previous work (Fukumori & Nakaoki,
2013), and cellulose addition presented a significantly higher resistance
with a decrease on strain (Fig. 4a). Therefore, their values of elastic
modulus were higher compared to pure PVA, and it follows the trend
obtained from their diffraction patterns (Fig. 4b).
The macrofibrillated cellulose, produced from blender and
7
Carbohydrate Polymers 245 (2020) 116612
G.G. de Lima, et al.
to this work. This could have been due to the lower molecular weight of
the PVA used and fewer freeze-thawing cycles. Increasing the molecular
weight may be beneficial for increased physical crosslinking and better
interaction between cellulose and PVA (Abitbol, Johnstone, Quinn, &
Gray, 2011).
The reinforcement of the hydrogel can be further seen by the increase in the glass transition temperature of this material when MFC
suspension was added, in agreement with a previous work (Iijima,
Kosaka, Hatakeyama, & Hatakeyama, 2016). Although macrofibrillated
cellulose suspension presented a decrease at lower concentrations, it
surpasses the value of pure PVA at the highest dosages.
The effect of their thermal degradation, performed by TGA, exhibits
a decrease towards lower values when macrofibrillated cellulose suspension was used, tough MFC suspension maintained the values of the
pure PVA. The lowest values from these hydrogels on thermal degradation maximum was 37 % for macrofibrillated cellulose and 23 %
for MFC. Furthermore, the 10 % temperature to decompose the materials was also increased in the majority of the samples (Table 1).
MFC and PVA derivative thermogravimetric curves are shown in
Fig. 5a and b and the MFC presented only one degradation stage at
approximately 352.6 °C. This probably corresponds to the concomitant
processes of the cellulose degradation of glycosyl units and oxidation
breakdown, in order to form products with a low molecular weight.
In the case of PVA, five main transition stages from thermogravimetric curves can be observed (Fig. 5b). The first transition step (stage
1 at 130.0 °C) is related to the moisture evaporation, and thus, does not
bring information about structure breakdown. The second, third, and
fourth stage degradation transition occurs around 278.5 °C, 301.0 °C
and 367.0 °C respectively, which corresponds to the removal of the
oxygen functional groups and formation of the polyene intermediate.
The last stage at 436.5 °C is associated to chain breaks and cyclization,
yielding char and small hydrocarbon molecules (Peng, Duan, Xie, & Liu,
2014).
TG–MS coupling provides information from the pyrolysis experiments, in which the evolution of different volatile products can be
monitored during thermal decomposition of materials. Full MS scans
between 50 and 120 Da of each stage are provided for MFC from stage
1, and PVA from stages 2, 3, 4 and 5 (Fig. 5c–g). The main diagnostic
mass/charge ratio (m/z) and its assigned product ions for MFC were m/
z 58 (C3H6O+), m/z 68 (C4H4O+), m/z 82 (C5H6O+), m/z 84
(C4H4O2+) and m/z 96 (C5H4O2+), which can be associated for the
following evolved products, acetone, furan, methyl-furan, furanone,
and 2-furfural, respectively (Fig. 5c, Tsuge, Ohtani, & Watanabe, 2011).
In the case of PVA, the major evolved products were classified as
crotonaldehyde (m/z 70, C4H6O+), benzaldehyde (m/z 106, C7H6O+),
and methyl-benzaldehyde (m/z 120, C8H8O+). Such product ions were
detected mainly in the stages 2, 3 and 4 indicating the degradation of
PVA (Fig. 5d, e and e, Tsuge et al., 2011). The fifth stage of PVA is
associated to the char production and the increase of m/z 91 (C7H8+)
may indicate the evolution of toluene, one of the predominant product
of char pyrolysis (Kaal & Rumpel, 2009).
In order to select, the specific ion products for monitoring each
material (i.e., PVA or cellulose) in the hydrogels, the plot of diagnostic
m/z of MCF were checked in the PVA, and inversely, the diagnostic m/z
of PVA in the MFC plot (Fig. 5a and b). The diagnostic m/z for the
evolved products of PVA was not detected in high abundance in the
MCF thermal degradation (Fig. 5a), as a result, the product ions with m/
z 70 (crotonaldehyde) and m/z 106 (benzaldehyde) were used to
evaluate the PVA thermal degradation in the hydrogels. However, most
of the diagnostic m/z of MFC were detected in high abundance during
thermal degradation of PVA (Fig. 5b), but there were low abundance
ions of m/z 84 and m/z 96. As a consequence, the evolved product 2furfural (m/z 96) was used to follow cellulose thermal degradation in
the hydrogels.
The hydrogels incorporated with different amounts of macrofibrillated cellulose and MFC resemble the pure PVA thermal
Fig. 8. Swelling ratio of the studied PVA hydrogels with a) macrofibrillated
suspension and b) MFC suspension.
Table 2
Theoretical adjustment values using Schott equation for the obtained hydrogels.
Sample
R2
Ks
W∞calc
W∞obs
Gel content (%)
Pure PVA
PVA-B-9
PVA-B-23
PVA-B-37
PVA-M-9
PVA-M-23
PVA-M-37
0.9999
0.9997
0.9998
0.9998
0.9997
0.9998
0.9993
0.0142
0.0120
0.0176
0.0218
0.0145
0.0166
0.0086
3.48
2.66
2.44
2.01
2.79
2.47
2.41
3.46
2.63
2.43
2.00
2.77
2.45
2.37
14.95
21.68
23.82
28.09
23.82
26.08
28.19
Ks: Swelling rate, W∞calc: theoretical and W∞obs experimental value of equilibrium swelling and Gel content based on deswelling measurements.
incorporated into the hydrogels also resulted in stronger materials, as
can be seen from their tensile curves. Though, the higher concentrations of macrofibrillated cellulose i.e., 23 and 37 %) and MFC at 37 %
exhibited the highest elastic modulus, and a significant difference was
detected by macrofibrillated cellulose at the maximum concentrationwhen compared with MFC at 9 % condition (Fig. 4b).
MFC has been reported to have values on tensile elastic modulus in
the order of 5 GPa (Claro et al., 2019) and could directly influence the
results obtained herein, in which cellulose fibres have higher strength
and are very resistant to tensile tests. Although the hydrogels decreased
from their pure values, it represents an overall improvement to hydrogels from freeze-thawing mechanism.
3.5. Thermal characterization
The thermal properties were investigated for these hydrogels
(Table 1), and the addition of cellulose decreases the melting point of
the PVA crystallites. This further corroborates the results so far, in that
there is a preference of interaction from cellulose and PVA rather than
self-association. However, previous work suggests that this interaction
and decrease on crystallinity led to a decrease in gel strength by the
usage of cellulose suspension on PVA hydrogels, which was in contrary
8
Carbohydrate Polymers 245 (2020) 116612
G.G. de Lima, et al.
viscosity), lower columnar crystals. This effect has been reported before
for polypropylene (Lee, Lee, & Via, 2010).
degradation (Fig. 6a and b), mainly with the presence of two stages:
PVA degradation (stage 4) and the char production (stage 5, Fig. 6b).
The cellulose degradations are not clearly perceived in the derivative
thermogravimetric curves, but its effect in the hydrogels is noted by the
temperature decrease of stages 4 and 5, when compared to pure PVA.
For the hydrogels with a low cellulose amount (9 %) a thermal degradation stage is detected with a shoulder peak at a lower temperature
(sum of stage 2 and 3, Fig. 6b) for both macrofibrillated cellulose and
MFC celluloses (Fig. 6a and b). However, with the increased amount of
cellulose to 23 % this thermal degradation pattern is less noted, being
totally absent at 37 % of cellulose.
Interestingly, the hydrogels incorporated with 37 % of cellulose,
despite having only two clear degradation stages, for the hydrogel with
macrofibrillated cellulose a reduction on its thermal stability was perceived (PVA-B-37, Fig. 6a). Such thermal degradation at the first stage
is even lower than MFC degradation (stage 1, Fig. 5a). This may be
associated with the thermal degradation of bleached pulp (macrofibrillated cellulose produced via blender) which is less thermal stable
than bleached MFC (MFC produced via mill) (Lengowski, de Muñiz, de
Andrade, Simon, & Nisgoski, 2018).
At higher concentrations, the hydrogels with macrofibrillated cellulose may be affected by the cellulose degradation. Therefore, contrasts with the hydrogels synthesised via mill, which seems to be more
associated to the thermal degradation of PVA. Interestingly, the char
production temperature (ca., 432.0 °C) during hydrogels degradation is
similar to all cellulose treatments even with the reduction of thermal
stability of macrofibrillated cellulose (Fig. 6a and b).
Such trends in the thermal degradation are supported by the PVA
and MFC diagnostic m/z of the evolution of selected volatile products
during decomposition of hydrogels (Fig. 6c–h). A double peak for m/z
70 (i.e., crotonaldehyde evolved in the PVA degradation) is seen for
hydrogels with 9 % of cellulose incorporated (Fig. 6c and d). This effect
can be associated to the shoulder peaks detected in the derivative
thermogravimetric curves (Fig. 6a and b). The broader m/z 70 in the
hydrogels with 23 % of cellulose indicates that PVA degradation is
responsible for a single stage, which is confirmed by narrower peaks at
37 % of cellulose incorporated.
The diagnostic m/z 106 for PVA degradation (i.e., benzaldehyde) is
seen as a single peak in all treatments, but strangely in a lower amount
for the PVA-B-37 (macrofibrillated cellulose, Fig. 6e), which may be
associated to the decrease in thermal degradation of the hydrogel. The
benzaldehyde is evolved at higher amounts for higher temperatures
when compared to the crotonaldehyde (Fig. 6c and e), and for that
reason, the production of benzaldehyde is lower in the sample PVA-B37 due to a lower degradation temperature.
The cellulose diagnostic m/z 96 (i.e., 2-furfural) have the similar
pattern of m/z 106 (Fig. 6g and h). However, considering the temperature of maximum production 2-furfural product ions, the thermal
stability of cellulose in the hydrogels follow the order: PVA-M37 > PVA-B-9 ∼ PVA-B-23 > PVA-M-9 ∼ PVA-M-23 > > PVA-B-37.
Such trends reinforce that hydrogel with macrofibrillated cellulose at a
higher amount (37 %) may be strictly associated with the thermal degradation of cellulose.
Therefore, there might be a difference at higher concentration of
macrofibrillated cellulose hydrogels, suggesting an inverse ordering of
the chains. Meaning the macrofibrilated cellulose could be the major
link and PVA chains are crosslinking around the lengths of the fibre
(Fig. 7a and b). Conversely, the MFC and macrofibrillated cellulose at
lower concentration might be linking the chains of the PVA, and the
suggested crosslink structure is shown in the Fig. 7c and d.
In addition, it is possible that the transcrystallinity might play a key
factor in the chain entanglement. These hydrogels could have many
columnar crystals instead of induced by the surface of the cellulose fibres. However in the case of the present study, it can be related that
using a low concentration of macrofibrillated cellulose (low viscosity)
might have more columnar crystals; whereas with MFC (higher
3.6. Swelling kinetics
Swelling of the hydrogels can also relate to the mechanical strength
and degree of crystallinity, being more resistant at lower values of
water uptake and more amorphous for higher values. The hydrogels
incorporated with cellulose had lower water uptake (Fig. 8) compared
to pure PVA hydrogels, resulted from the strong interaction between
cellulose and PVA. The lowest swelling ratio can be determined by their
respective cellulose amount. Additionally, there is a further decrease
with an increasing amount of cellulose added, and it seems to follow the
trend obtained from tensile elastic modulus results.
Nonetheless, these hydrogels follow the Schott equation modelling
(Table 2), which describes a swelling process that results from the unravelling of the polymer macromolecules after diffusion into solvent
upon hydration. As it can be seen from these values, they correlate quite
well with the model and predict the absorption capacity and swelling
rate adequately for all hydrogels studied. Therefore, an increase on
cellulose content led to an increase on swelling rate, and a decrease on
absorption capacity.
The values of maximum water uptake presented similar values
compared from the theoretical and the swelling rate had a difference in
behaviour depending on the cellulose used. Hydrogels containing
macrofibrillated cellulose processed from blender had a higher rate of
water absorption compared to the ones from MFC. This could be an
interesting factor when considering an application for drug delivery,
where it could be possible to tailor the delivery rate by the cellulose
amount and/or process.
The highest concentration of MFC had a decrease on swelling rate,
and it is contrary to the trend seen from all samples. This trend might
have been due to the increased difficulty of water diffuse into the
sample. Furthermore, dehydration kinetics were performed resulting in
higher gel content compared to pure PVA. The gel content directly relates to the hydrogen bonding within the chains, and it can be seen that
an increase in cellulose also increased these values, with no variation
between the process.
4. Conclusions
Cellulose that acts as a reinforcement for the structure of hydrogels
have been described extensively, but their actual effect from their sizeconcentration is an important discussion which has not been thoroughly evaluated. Due to the formation of unique crosslinks by hydrogen bonding through the freeze-thawing mechanism, PVA can link
rather more readily with cellulose as opposed to their own macrochains
and the various concentrations of Kraft paper from macrofibrillated and
macrofibrillated cellulose results in different effects on the structure.
Therefore, it is possible to tailor the cellulose to obtain desirable physical and mechanical characteristics for specific applications and fabricate novel materials.
CRediT authorship contribution statement
Gabriel Goetten de Lima: Conceptualization, Methodology, Data
curation, Writing - original draft, Visualization, Investigation, Writing review & editing. Bruno Dias Ferreira: Visualization, Investigation.
Mailson Matos: Visualization, Investigation. Bruno Leandro Pereira:
Visualization, Investigation. Michael J.D. Nugent: Supervision.
Fabrício Augusto Hansel: Visualization, Investigation. Washington
Luiz
Esteves
Magalhães:
Conceptualization,
Methodology,
Supervision.
9
Carbohydrate Polymers 245 (2020) 116612
G.G. de Lima, et al.
Declaration of Competing Interest
entities. BioResources, 15(1).
Iijima, M., Kosaka, S., Hatakeyama, T., & Hatakeyama, H. (2016). Phase transition of poly
(vinyl alcohol) hydrogel filled with micro-fibrillated cellulose. Journal of Thermal
Analysis and Calorimetry, 123(3), 1809–1815. />Jabbari, E. (2019). Challenges for natural hydrogels in tissue engineering. Gels, 5(2), 30.
Jose, J., Shehzad, F., & Al-Harthi, M. A. (2014). Preparation method and physical, mechanical, thermal characterization of poly(vinyl alcohol)/poly(acrylic acid) blends.
Polymer Bulletin, 71(11), 2787–2802. />Kaal, J., & Rumpel, C. (2009). Can pyrolysis-GC/MS be used to estimate the degree of
thermal alteration of black carbon? Organic Geochemistry, 40(12), 1179–1187.
Kargarzadeh, H., Ahmad, I., Abdullah, I., Dufresne, A., Zainudin, S. Y., & Sheltami, R. M.
(2012). Effects of hydrolysis conditions on the morphology, crystallinity, and thermal
stability of cellulose nanocrystals extracted from kenaf bast fibers. Cellulose, 19(3),
855–866. />Lani, N. S., Ngadi, N., Johari, A., & Jusoh, M. (2014). Isolation, characterization, and
application of nanocellulose from oil palm empty fruit bunch Fiber as nanocomposites. Journal of Nanomaterials, 2014, 1–9. />Lee, B. G., Lee, S., & Via, B. K. (2010). Influence of surface morphology of the kraft pulp
fibers on the growth of the transcrystalline layer of polypropylene. Journal of Applied
Polymer Science. NA-NA.
Lee, H., Yamaguchi, K., Nagaishi, T., Murai, M., Kim, M., Wei, K., ... Kim, I. S. (2017).
Enhancement of mechanical properties of polymeric nanofibers by controlling crystallization behavior using a simple freezing/thawing process. RSC Advances, 7(69),
43994–44000. />Lengowski, E. C., de Muñiz, G. I. B., de Andrade, A. S., Simon, L. C., & Nisgoski, S. (2018).
Morphological, physical and thermal characterization of microfibrillated cellulose.
Revista Árvore, 42(1), />Lin, F., Zheng, R., Chen, J., Su, W., Dong, B., Lin, C., ... Lu, B. (2019). Microfibrillated
cellulose enhancement to mechanical and conductive properties of biocompatible
hydrogels. Carbohydrate Polymers, 205, 244–254.
Lin, S.-Y., Cheng, W.-T., Wei, Y.-S., & Lin, H.-L. (2011). DSC-FTIR microspectroscopy used
to investigate the heat-induced intramolecular cyclic anhydride formation between
Eudragit E and PVA copolymer. Polymer Journal, 43(6), 577–580. />1038/pj.2011.15.
Ma, N., Liu, D., Liu, Y., & Sui, G. (2015). Extraction and characterization of nanocellulose
from Xanthoceras sorbifolia Husks. Int J Nanosci Nanoeng, 2(6), 43–50.
Peng, C., Duan, X., Xie, Z., & Liu, C. (2014). Shape-controlled generation of gold nanoparticles assisted by dual-molecules: The development of hydrogen peroxide and
oxidase-based biosensors. Journal of Nanomaterials, 2014, 1–7. />1155/2014/576082.
Ricciardi, R., Mangiapia, G., Lo Celso, F., Paduano, L., Triolo, R., Auriemma, F., ...
Lauprêtre, F. (2005). Structural organization of poly(vinyl alcohol) hydrogels obtained by freezing and thawing techniques: A SANS study. Chemistry of Materials,
17(5), 1183–1189. />Schott, H. (1992). Swelling kinetics of polymers. Journal of Macromolecular Science Part BPhysics, 31(1), 1–9. />Selarka, A., Baney, R., & Matthews, S. (2013). Processing of microcrystalline cellulose in
dimethyl sulfoxide, urea and supercritical carbon dioxide. Carbohydrate Polymers,
93(2), 698–708. />Shibayama, M., Yamamoto, T., Xiao, C.-F., Sakurai, S., Hayami, A., & Nomura, S. (1991).
Bulk and surface characterization of cellulose/poly(vinyl alcohol) blends by Fouriertransform infra-red spectroscopy. Polymer, 32(6), 1010–1016. />1016/0032-3861(91)90586-8.
Thakur, V. K., & Thakur, M. K. (Eds.). (2018). HydrogelsSingapore: Springer Singapore.
/>Tsuge, S., Ohtani, H., & Watanabe, C. (2011). Pyrolysis-GC/MS data book of synthetic
polymers: Pyrograms, thermograms and MS of pyrolyzates. Elsevier.
Turki, A., El Oudiani, A., Msahli, S., & Sakli, F. (2018). Investigation of OH bond energy
for chemically treated alfa fibers. Carbohydrate Polymers, 186, 226–235. https://doi.
org/10.1016/j.carbpol.2018.01.030.
Wang, Z., Ding, Y., & Wang, J. (2019). Novel polyvinyl alcohol (PVA)/Cellulose nanocrystal (CNC) supramolecular composite hydrogels: Preparation and application as
soil conditioners. Nanomaterials, 9(10), 1397. />nano9101397.
Xiao, X., Wu, G., Zhou, H., Qian, K., & Hu, J. (2017). Preparation and property evaluation
of conductive hydrogel using poly (Vinyl alcohol)/Polyethylene Glycol/Graphene
oxide for human electrocardiogram acquisition. Polymers, 9(12), 259. https://doi.
org/10.3390/polym9070259.
Zheng, Y., Fu, Z., Li, D., & Wu, M. (2018). Effects of ball milling processes on the microstructure and rheological properties of microcrystalline cellulose as a sustainable
polymer additive. Materials, 11(7), 1057. />
The authors declare that there are no conflicts of interest regarding
the publication of this manuscript.
Acknowledgment
This study was financed in part by the Coordenaỗóo de
Aperfeiỗoamento de Pessoal de Nớvel Superior - Brasil (CAPES) Finance Code 001.
Appendix A. Supplementary data
Supplementary material related to this article can be found, in the
online version, at doi: />References
Abitbol, T., Johnstone, T., Quinn, T. M., & Gray, D. G. (2011). Reinforcement with cellulose nanocrystals of poly(vinyl alcohol) hydrogels prepared by cyclic freezing and
thawing. Soft Matter, 7(6), 2373. />Aguayo, M., Fernández Pérez, A., Reyes, G., Oviedo, C., Gacitúa, W., Gonzalez, R., &
Uyarte, O. (2018). Isolation and characterization of cellulose nanocrystals from rejected fibers originated in the kraft pulping process. Polymers, 10(10), 1145. https://
doi.org/10.3390/polym10101145.
Arenillas, A., Rubiera, F., & Pis, J. (1999). Simultaneous thermogravimetric–mass spectrometric study on the pyrolysis behaviour of different rank coals. Journal of
Analytical and Applied Pyrolysis, 50(1), 31–46. />Balea, A., Blanco, A., & Negro, C. (2019). Nanocelluloses: Natural-based materials for
fiber-reinforced cement composites. A critical review. Polymers, 11(3), 518.
Cai, J., & Zhang, L. (2006). Unique gelation behavior of cellulose in NaOH/Urea aqueous
solution. Biomacromolecules, 7(1), 183–189. />Claro, F. C., Matos, M., Jordão, C., Avelino, F., Lomonaco, D., & Magalhães, W. L. E.
(2019). Enhanced microfibrillated cellulose-based film by controlling the hemicellulose content and MFC rheology. Carbohydrate Polymers, 218, 307–314. https://
doi.org/10.1016/j.carbpol.2019.04.089.
Duchemin, B., Le Corre, D., Leray, N., Dufresne, A., & Staiger, M. P. (2016). All-cellulose
composites based on microfibrillated cellulose and filter paper via a NaOH-urea
solvent system. Cellulose, 23(1), 593–609. />Fu, L.-H., Qi, C., Ma, M.-G., & Wan, P. (2019). Multifunctional cellulose-based hydrogels
for biomedical applications. Journal of Materials Chemistry B, 7(10), 1541–1562.
Fukumori, T., & Nakaoki, T. (2013). Significant improvement of mechanical properties for
polyvinyl alcohol film prepared from Freeze/Thaw cycled gel. Open Journal of Organic
Polymer Materials, 3(4), 110–116. />Garside, P., & Wyeth, P. (2003). Identification of cellulosic fibres by FTIR spectroscopy thread and single fibre analysis by attenuated total reflectance. Studies in
Conservation, 48(4), 269–275. />Gicquel, E., Martin, C., Gauthier, Q., Engström, J., Abbattista, C., Carlmark, A., ... Bras, J.
(2019). Tailoring rheological properties of thermoresponsive hydrogels through
block copolymer adsorption to cellulose nanocrystals. Biomacromolecules, 20(7),
2545–2556.
Guan, Y., Bian, J., Peng, F., Zhang, X.-M., & Sun, R.-C. (2014). High strength of hemicelluloses based hydrogels by freeze/thaw technique. Carbohydrate Polymers, 101,
272–280. />Gupta, S., Sinha, S., & Sinha, A. (2010). Composition dependent mechanical response of
transparent poly(vinyl alcohol) hydrogels. Colloids and Surfaces B, Biointerfaces,
78(1), 115–119. />Hatch, K. M., Hlavatá, J., Paulett, K., Liavitskaya, T., Vyazovkin, S., & Stanishevsky, A. V.
(2019). Nanocrystalline Cellulose/Polyvinylpyrrolidone fibrous composites prepared
by electrospinning and thermal crosslinking. International Journal of Polymer Science,
2019, 1–12. />Huang, X., Zuo, Y., Li, J. D., & Li, Y. B. (2009). Study on crystallisation of nano-hydroxyapatite/polyvinyl alcohol composite hydrogel. Materials Research Innovations,
13(2), 98–102. />Hubbe, M. A., & Grigsby, W. (2020). From nanocellulose to wood particles: A review of
particle size vs. The properties of plastic composites reinforced with cellulose-based
10