β(2→6)-Type fructans attenuate proinflammatory responses in a structure dependent fashion via Toll-like receptors
Bạn đang xem bản rút gọn của tài liệu. Xem và tải ngay bản đầy đủ của tài liệu tại đây (9.61 MB, 21 trang )
Carbohydrate Polymers 277 (2022) 118893
Contents lists available at ScienceDirect
Carbohydrate Polymers
journal homepage: www.elsevier.com/locate/carbpol
β(2→6)-Type fructans attenuate proinflammatory responses in a structure
dependent fashion via Toll-like receptors
´ndez-Lainez a, b, c, *, R. Akkerman a, M.M.P. Oerlemans a, M.J. Logtenberg d, H.A. Schols d,
C. Ferna
´pez-Vel´
L.A. Silva-Lagos a, G. Lo
azquez e, P. de Vos a
a
Immunoendocrinology, Division of Medical Biology, Department of Pathology and Medical Biology, University of Groningen and University Medical Center Groningen,
Hanzeplein 1, 9700 RB Groningen, the Netherlands
Laboratorio de Errores Innatos del Metabolismo y Tamiz, Instituto Nacional de Pediatría, Ciudad de M´exico, Mexico
c
Posgrado en Ciencias Biol´
ogicas, Universidad Nacional Aut´
onoma de M´exico UNAM, Ciudad de M´exico, Mexico
d
Laboratory of Food Chemistry, Wageningen University, Wageningen, the Netherlands
e
Laboratorio de Biomol´eculas y Salud Infantil, Instituto Nacional de Pediatría, Ciudad de M´exico, Mexico
b
A R T I C L E I N F O
A B S T R A C T
Keywords:
Branched-chain fructans
Functional food
Immunomodulation
Non-digestible carbohydrates
Toll-like receptors
Graminan-type fructans (GTFs) have demonstrated immune benefits. However, mechanisms underlying these
benefits are unknown. We studied GTFs interaction with Toll-like receptors (TLRs), performed molecular docking
and determined their impact on dendritic cells (DCs). Effects of GTFs were compared with those of inulin-type
fructans (ITFs). Whereas ITFs only contained β(2→1)-linked fructans, GTFs showed higher complexity as it
contains additional β(2→6)-linkages. GTFs activated NF-κB/AP-1 through MyD88 and TRIF pathways. GTFs
stimulated TLR3, 7 and 9 while ITFs activated TLR2 and TLR4. GTFs strongly inhibited TLR2 and TLR4, while
ITFs did not inhibit any TLR. Molecular docking demonstrated interactions of fructans with TLR2, 3, and 4 in a
structure dependent fashion. Moreover, ITFs and GTFs attenuated pro-inflammatory cytokine production of
stimulated DCs. These findings demonstrate immunomodulatory effects of GTFs via TLRs and attenuation of
cytokine production in dendritic cells by GTFs and long-chain ITF.
1. Introduction
Economic progress has led to spreading of the Western life style
which has contributed to an increased risk for development of noncommunicable diseases such as cardiovascular diseases, stroke, cancer,
diabetes and respiratory diseases (Beaglehole et al., 2011; Patry &
Nagler, 2021). These changes in lifestyle include less physical activity,
higher intake of processed foods enriched with animal fats as well as
lower intake of dietary fibers compared to more traditional diets (Health
& Services, 2015; Temba et al., 2021). During recent years, especially
enhanced intake of dietary fibers has been shown to be an effective
strategy to reduce risk for developing chronic metabolic and immune
diseases (Veronese et al., 2018). However, the mechanisms that underlie
these health benefits are not completely understood. It has been shown
that beneficial effects of dietary fiber intake might be associated with
enhanced production of short-chain fatty acids (SCFAs) by intestinal
microbiota (Van den Abbeele et al., 2021) but also other mechanisms
such as direct interaction of dietary fibers with immune cells in the in
testine have been suggested to be involved (Vogt et al., 2013).
An important family of dietary fibers are fructans which can be found
in the cell wall of bacteria, fungi or in angiosperm plants (Flamm et al.,
´pez & Simpson, 2020). Fructans
2001; Oerlemans et al., 2020; P´erez-Lo
Abbreviations: AP-1, activating-protein 1; DP, degree of polymerization; EU, endotoxin units; FLA-ST, flagellin from S. typhimurium; FSL-1, synthetic diacylated
lipoprotein - TLR2/TLR6 ligand; GTF I, graminan-type fructan I; GTF II, graminan-type fructan II; G418, geneticin; HEK, human embryonic kidney cells; HPAEC, high
performance anion exchange chromatography; HPSEC, high-pressure size exclusion chromatography; CL264, 2-(4-((6-amino-2-(butylamino)-8-hydroxy-9H_purin_9yl) methyl)benzamido)acetic acid; ITF I, inulin-type fructan I; ITF II, inulin-type fructan II; LAL, limulus amebocyte lysate; MWD, molecular weight distribution; NFκB, Nuclear factor kappa-light-chain-enhancer of activated B cells; ODN 2006, class B CpG synthetic oligonucleotide; Poly I:C, high molecular weight-synthetic analog
of dsRNA; SEAP, Secreted Alkaline Phosphatase; ssRNA40/LyoVec, single-stranded GU-rich oligonucleotide complexed with the cationic lipid LyoVec™; THP1,
Human monocytic cells; TLRs, Toll-like receptors.
* Corresponding author at: Immunoendocrinology, Division of Medical Biology, Department of Pathology and Medical Biology, University of Groningen and
University Medical Center Groningen, Hanzeplein 1, 9700 RB Groningen, the Netherlands.
E-mail address: (C. Fern´
andez-Lainez).
/>Received 31 July 2021; Received in revised form 25 October 2021; Accepted 11 November 2021
Available online 15 November 2021
0144-8617/© 2021 The Authors. Published by Elsevier Ltd. This is an open access article under the CC BY license ( />
C. Fern´
andez-Lainez et al.
Carbohydrate Polymers 277 (2022) 118893
are water soluble and energy-storing polysaccharides in plants (Van den
Ende, 2013). Fructans are synthesized from glucose units to which a
fructose unit is added. According to their composition, fructans are
denoted as GFn or Fn, where “G” corresponds to the terminal glucose
unit, “F” corresponds to fructose, and “n” denotes the number of mole
cules that elongate the fructan chain (Roberfroid, 2005). Fructans are
structurally diverse, and their composition depends on the metabolism
present in the plant from which they are extracted (Versluys et al.,
2018). Fructans can be classified in several groups according to the
position of fructose carbon atoms that form the glycosidic bond for the
elongation. Inulins are a type of fructans composed of β(2→1) bonds.
These β(2→1) inulins have a linear structure and are different from the
inulin neoseries that contain a glucose moiety between two fructose
chains linked through β(2→1) bonds (Vijn & Smeekens, 1999). Another
form of fructans are levans which are comprised of β(2→6) bonds and
are also linear. Just like inulin, these levans also exist as neoseries
containing a central sucrose molecule to which fructose chains are
´pez, 2006; Vijn &
linked by β(2→6) bonds (Mancilla-Margalli & Lo
Smeekens, 1999). These levans can be extracted from both bacteria and
plants, where they have different biological functions (Young, et al.
2021). A third family of fructans are the graminans. These fructans
consist of a mixture of both β(2→1) bonds and β(2→6) bonds and have a
branched structure. All these fructans have a β-configuration of their
chemical bonds which makes them mostly inaccessible to human
digestive enzymes. Therefore, fructans are widely considered to be nondigestible carbohydrates (NDCs) (Roberfroid et al., 1998).
Graminan type fructans (GTFs) isolated from Agave tequilana (agave)
are widely used in Latin America and recognized for their health benefits
´pez & Urías-Silvas, 2007). Because of these health benefits they have
(Lo
´pezbeen applied as prebiotics in infant formula for newborns (Lo
Vel´
azquez et al., 2015). Despite these recognized benefits, still there is
poor knowledge about the effects of GTFs on immune health. On the
other hand, inulin-type fructans (ITFs) are well recognized for their
metabolic and immune health benefits (Vogt et al., 2013) and those
isolated from Cichorium intybus (chicory), are widely used and consumed
in Europe as food supplement. For some ITFs it has been shown that their
beneficial effect on immune health occurs via binding to Toll-like re
ceptors (TLRs) (Vogt et al., 2013). In humans, TLRs are a group of ten
transmembrane proteins that participate in the immune response
against pathogenic microorganisms (Abreu, 2010). Once TLRs recognize
specific pathogenic molecules such as lipoproteins from bacterial cell
wall or genetic material (RNA, DNA) signaling cascades are activated
(Gay & Gangloff, 2007). These signaling cascades can follow either the
Myeloid Differentiation primary-response protein 88 (MyD88) or the
TIR domain-containing adaptor protein inducing IFN-β (TRIF) pathways
for the production of inflammatory cytokines (Takeda & Akira, 2004).
ITFs can activate TLRs and regulate inflammatory responses and effects
are chain-length dependent (Bermudez-Brito et al., 2015). These
immunomodulatory properties can be beneficial for gut and immune
health as previously demonstrated in human studies (Bermudez-Brito
et al., 2015; Kiewiet et al., 2021; Vogt et al., 2017).
We hypothesized that fructans from agave exert immunomodulation
via TLRs, which might explain their health benefits. To determine this,
we performed the current study in which we investigated the modula
tory effect of GTFs on TLRs which was compared to that of ITFs of
different chain lengths. Furthermore, as it is unknown for both GTFs and
ITFs how and on which binding sites they interact with TLR we applied
in silico docking studies to propose the specific binding sites of fructans
on TLRs. This was performed on the TLRs that were most strongly
regulated by fructans. Finally, the impact of these fructans on the
cytokine responses from dendritic cells (DCs) was studied.
2. Materials and methods
2.1. Fructans
In order to study the effects of linear or branched structures of
fructans on TLR signaling, two types of branched β(2→1) and β(2→6)
linked graminan-type fructans were tested. One is a mixture of low DP
chains (GTF I, Metlos™) and the other is a mixture of predominant
higher DP (GTF II, Metlin™) fructan, both extracted from Agave tequi
lana Weber blue variety, were provided by Nekutli™, Guadalajara,
M´
exico. These GTFs were studied and compared with two previously
described linear β(2→1)-linked inulin-type fructans, ITF I (Frutafit™
CLR) and ITF II (Frutafit™TEX!). ITF I is short chain (DP range 3–10)
and ITF II is long chain (DP range 10–60). Both β(2→1) fructans
extracted from Cichorium intybus root, were provided by Sensus™ B. V.,
Roosendaal, The Netherlands (Vogt et al., 2013).
2.2. Chemical characterization of inulin and Graminan-type fructans
Chain length profile of GTF I and GTF II, as well as those of ITFs
tested, were determined through HPAEC analysis, with a Dionex (Sun
nyvale, CA, USA) Carbopac PA-1 column (2 × 250 mm) preceded by a
Carbopac PA-1 guard column (2 × 25 mm). Samples were analyzed at a
concentration of 50 μg/ml and introduced with a partial-loop injection
of 10 μl. Carbohydrates were separated with a gradient elution: 0–400
mM NaOAc in 100 mM NaOH during 40 min, followed by a washing step
of 5 min with 1 M NaOAc in 100 mM NaOH and column equilibration
with 100 mM NaOH for 15 min. Pulsed amperometrics was used as
detection system with a Dionex ISC5000 ED detector (Vogt et al., 2013).
Data were acquired with Chromeleon software version 7.0 (Thermo
Scientific, San Jose, CA, USA). Annotation of individual components
present in GTF I and GTF II was accomplished by comparison of the
elution profiles with the previously characterized ITFs (Vogt et al.,
2013).
For determination of fructans MWD, HPSEC on an Ultimate 3000
HPLC system (Dionex) coupled to a Shodex RI-101 refractive index de
tector (Showa Denko, Tokyo, Japan) was used. For the analysis, 20 μl of
sample (2.5 mg/ml) dissolved in water were injected at 55 ◦ C. Three
TSK-Gel columns connected in tandem (4000–3000–2500 SuperAW;
150 × 6 mm, Tosoh Bioscience, Tokyo, Japan), with the TSK Super AW-L
guard column (35 × 4.6 mm, Tosoh Bioscience) were used and samples
were eluted at 0.6 ml/min with NaNO3 (0.2 M). Data were acquired with
Chromeleon software version 7.0 (Thermo Scientific) and MWD was
calculated by interpolation in a pullulan (Polymer Laboratories, Palo
Alto, Ca, USA) standard curve in a range of 0.18–790 kDa.
2.3. Endotoxin measurement and removal
Endotoxin levels of all fructans were determined with the commer
cial Pierce LAL Chromogenic Endotoxin Quantitation Kit™ according to
the manufacturer instructions. In case endotoxin levels were above 1
EU/ml, we applied the Pierce High-Capacity Endotoxin Removal
Resin™. This resin decreased the endotoxin levels to less than 1 EU/ml
(Table S1). These endotoxin concentrations have no influence on the
studied cells (L´
epine & de Vos, 2018; Vogt et al., 2013). Once fructans
were endotoxin-free, they were freeze-dried and stored at − 20 ◦ C until
use. To exclude any influence from possible endotoxin remnants, we
additionally performed tests in which we added the fructans to the cells
in the presence and absence of 100 μg/ml of the endotoxin-blocker
polymyxin B (Invivogen, Toulouse, France). There were no significant
differences between treated and non-treated cells (Fig. S1).
2.4. Reporter cell lines
THP1-XBlue™-MD2-CD14 human monocytes were used as reporter
cell-line. This is a cell line which endogenously expresses all human
2
C. Fern´
andez-Lainez et al.
Carbohydrate Polymers 277 (2022) 118893
TLRs and has been genetically modified with the SEAP inducible re
porter gene, under control of NF-κB and AP-1 promoters. It also has an
extra insert for the expression of MD2 and CD14 accessory proteins
which enhance TLR signaling (Cheng et al., 2019; Sahasrabudhe et al.,
2018). Additionally, human embryonic kidney cells (HEK-Blue™)
expressing either human TLRs 2, 3, 4, 5, 7, 8 or 9 were applied. Also, this
cell-line has a SEAP reporter gene system. It is important to note that
HEK-Blue™ TLR2 cell line, also expresses the TLRs 1 and 6. TLR2 forms
active heterodimers with TLR1 and TLR6 (Sahasrabudhe et al., 2018).
All these cell lines were acquired from Invivogen (Invivogen, Toulouse,
France).
THP1-XBlue™-MD2-CD14 and HEK-Blue™ cell lines were cultured
in RPMI-1640 medium with 2 mM glutamine and DMEM medium
(Lonza, Basel, Switzerland), respectively. RPMI-1640 contained nor
mocin 100 μg/ml (Invivogen, Toulouse, France) and DMEM medium
penicillin/streptomycin 50 U/ml and 50 μg/ml. (Gibco, Leicestershire,
UK). Both media were supplemented with 10% heat-inactivated fetal
bovine serum (Sigma, St. Louis, MO, USA), sodium bicarbonate 1.5 g/l
(Sigma, St. Louis, MO, USA) and sodium pyruvate 1 mM (Biowest,
Nuaill´
e, France). Selection antibiotics (Invivogen, Toulouse, France) are
indicated in Table S2. Cell lines were passaged twice a week and worked
at 80% confluency, according to manufacturer's instructions.
Switzerland (Grosdidier et al., 2011). For performing the docking ana
lyses, TLRs were defined as protein targets and fructans were defined as
ligands.
The crystallographic structure from human TLR2 in complex with
Pam3CSK4 agonist available in the Protein Data Bank was used (PDB
code 2Z7X) (Jin et al., 2007). The crystallographic structure of human
TLR3 ligand binding domain was also applied (PDB code 2A0Z) (Bell
et al., 2005). The crystallographic structure of TLR4 in complex with
myeloid differentiation factor 2 (MD2) and lipopolysaccharide (LPS)
agonist was also applied (PDB code 3FXI) (Park et al., 2009).
Since β(2→6) linkage is exclusive of GTFs, as a first approximation to
determine potential interaction sites of these fructans with TLRs, we
selected the simplest β(2→6) oligosaccharide found in GTFs, which is
β-D-fructofuranosyl-(2→6)-β-D-fructofuranosyl α-D-glucopyranoside (6kestose). Since ITFs only possess β(2→1) linkages, the fructan β-Dfructofuranosyl-(2→1)-β-D-fructofuranosyl α-D-glucopyranoside (1kestose), was used to investigate whether it could have different binding
sites to TLRs. Crystallographic structure of 1-kestose was extracted from
Protein Data Bank and 6-kestose 3D-structure was obtained from its
simplified molecular-input line-entry system (SMILES) notation depos
ited in PubChem data base (Table S3) (Berman et al., 2000; Kim et al.,
2019).
Linear inulin and branched agavin, both constituted of GF10 series,
were chosen as representative ligands of ITF II and GTF II, respectively
(Table S4). Hereinafter called GF10-inulin and GF10-agavin. GF10-inulin
3D-structure was obtained by modification of the PubChem structure
(ID: 24763). Avogadro software version 1.2.0 was used for construction
of the structure (Hanwell et al., 2012). GF10-agavin structure was con
structed based on the structure proposed by Mancilla-Margalli et al.
´pez, 2006) by using the Optical Structure
(Mancilla-Margalli & Lo
Recognition Software (OSRA) (Filippov & Nicklaus, 2009) and Avoga
dro software for structure refinement (Hanwell et al., 2012).
Prior to docking analyses, the energy of protein targets and ligands
3D-structures were minimized using Yasara minimization server or
Avogadro (Filippov & Nicklaus, 2009; Hanwell et al., 2012; Krieger
et al., 2009). The different protein-ligand models obtained from mo
lecular docking, were evaluated and analyzed using UCSF Chimera
software version 1.14 (Pettersen et al., 2004). The interaction measures
and figures were generated with Pymol Molecular Graphics System
ădinger, LLC (DeLano, 2002).
version 2.3.5 Edu, Schro
2.5. TLR activation and inhibition assays with reporter cell lines
Assays for quantifying TLR activation were performed in THP1XBlue™-MD2-CD14 and HEK-Blue™ cell lines by incubating 200 μl of
the experimental sample in 96-well plates, at cell densities indicated in
Table S2. This was done during 24 h at 37 ◦ C, 5% CO2, in presence of 0.5,
1 or 2 mg/ml of GTFs, as well as of ITFs at 2 mg/ml. These working
concentrations were based on response curves from previous studies
(L´epine & de Vos, 2018; Vogt et al., 2013).
Culture medium and agonists for each TLR, were included as positive
and negative controls respectively (Table S2). TLR activation was
determined by quantitation of SEAP secretion from the supernatant of
cells which was diluted 1:10 with Quantiblue™ reagent (Invivogen,
Toulouse, France). After incubation for 1 h at 37 ◦ C, the change in
absorbance was measured at 655 nm in a Bio-Rad™ Benchmark Plus
microplate spectrophotometer reader (Bio-Rad Laboratories B.V, Vee
nendaal, Netherlands). Data were normalized relative to negative con
trol, which were set to 1.
To assess whether fructans induce TLR signaling through the MyD88
or TRIF pathways, the synthetic peptides Pepinh-MYD™ and PepinhTRIF™ (Invivogen, Toulouse, France) were used. Pepinh-MYD™ and
Pepinh-TRIF™ block these signaling pathways. THP1 -XBlue™-MD2CD14 cells were pre-incubated with 50 μM of Pepinh-MYD™ or PepinhTRIF™ for 6 h at 37 ◦ C, 5% CO2. Afterwards the different fructans were
added and cells were incubated during 24 h, followed by quantitation of
SEAP production. The fold-change of NF-κB/AP-1 was calculated as
mentioned above.
To assess the inhibitory effect of GTFs and ITFs on TLRs, HEK-Blue™
cells were pre-incubated for 1 h at 37 ◦ C, 5% CO2 with the fructans,
followed by addition of the appropriate TLR ligands and incubation
during 24 h. Next, SEAP production was determined as mentioned
above. Positive controls were cells treated only with each individual
TLR-specific agonist. The inhibition rate was calculated as the foldchange of NF-κB/AP-1 induction, compared to each specific TLR
agonist positive control.
2.7. Stimulation of dendritic cells with agave and chicory fructans
Human dendritic cells (DCs) isolated from umbilical cord blood
CD34+ progenitor cells (MatTek Corporation, Ashland, MA, USA), were
used. DCs were defrosted and seeded in 96-well plates (3 × 10⁵ cells/
well), with maintenance culture medium containing cytokines (DC-MM;
Mat Tek Corporation, Ashland, MA, USA), according to manufacturer's
instructions. In order to get them attached to the wells DCs were incu
bated for 24 h at 37 ◦ C and 5% CO2 (normal conditions).
The influence of ITFs and GTFs on DCs cytokine release was inves
tigated by incubating them for 48 h in the presence or absence of 500
μg/ml of ITFs and GTFs dissolved in DCs maintenance culture medium.
In order to test the inhibitory effect of fructans on immune cells, DCs
were pre-incubated for 1 h with 500 μg/ml of ITFs and GTFs, followed by
the addition of TLR4 agonist (LPS), and a mixture of TLR2 agonists (FSL1 and Pam3CSK4) at 10 ng/ml. Afterwards, DCs were incubated in
presence of the agonists during 48 h under normal conditions. Cell su
pernatants were collected and stored at − 80 ◦ C until further use. Posi
tive controls were DCs treated only with TLR4 and TLR2 agonists.
Untreated controls were cells cultured only with DCs culture medium.
The inhibition rate was calculated as the fold-change of cytokines pro
duction, compared to each TLR agonist positive control.
2.6. Prediction of fructans binding mode to TLRs by molecular docking
To predict the potential interaction sites of the different fructans with
TLR2 or with TLR3 or with TLR4, molecular docking analyses were
performed. We used the protein-small molecule docking web service,
which is based on the docking software EADock DSS from the Molecular
Modeling Group of the Swiss Institute of Bioinformatics, Lausanne,
3
C. Fern´
andez-Lainez et al.
Carbohydrate Polymers 277 (2022) 118893
2.8. Determination of cytokine profile
Whitney U test or Friedman test, followed by Dunn's multiple compar
isons adjustment test. Results are expressed as mean ± SD or as median
and interquartile range (IQR), for data with parametric and nonparametric distribution respectively. A p-value <0.05 was considered
to be statistically significant (*p < 0.05, **p < 0.01, ***p < 0.001, ****p
< 0.0001), p-values < 0.1 were considered as a trend.
Magnetic Luminex ® Assay (R&D systems, Biotechne, Minneapolis,
USA) was used to quantify the DCs cytokine profile (MCP-1/CCL2, MIP1α/CCL3, IL-1RA, IL-1β, IL-6, TNFα and IL-10). The manufacturer's
protocol was followed. Briefly, 50 μl of DCs supernatants or standard
solutions were mixed in 96-well plates with a mixture of magnetic beads
containing antibodies for the different cytokines. The plates were
incubated overnight at 4 ◦ C under constant shaking. Afterwards,
detection antibodies were added and the plate was incubated at RT for
30 min under constant shaking. Later, the plate was washed three times,
followed by incubation with streptavidin for 30 min at RT under con
stant shaking. Then, after three-wash steps in which 100 μl of wash
buffer was added per well, the plate was read in a Luminex 200 system.
The data were analyzed with the Luminex xPOTENT software. At least
five independent assays were performed for each test.
3. Results
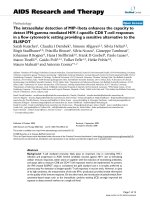
3.1. Characterization of inulin and graminan-type fructans
Inulin and graminan-type fructans were analyzed for determination
of their molecular weight distribution profiles and the components that
make up the mixtures. ITFs are inulin-type fructans with only β(2→1)
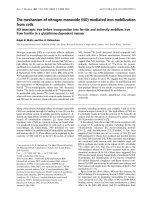
linkages (Vogt et al., 2013). The DP of ITF I ranges from 3 to 10 (Fig. 1
a), but it also has chains with DP up to 25. These fructan is a
fructooligosaccharide-enriched inulin, containing both GFn and Fn type
oligosaccharides, although the GFn series is the most dominant over the
Fn series in this fructan (Fig. 1b). ITF II consists only of GFn units, with a
broad range of chain lengths from DP9 to 60 (Fig. 1b). GTFs are a
mixture of oligosaccharides linked by β(2→1) and β(2→6) (Lopez et al.,
2003). DP 3 and 4 make up most of the GTF I mixture, although it has a
very low amount of components in the range of DP 7–45 (Fig. 1a). GTFs
contain Fn type oligosaccharides as well as GFn series. The oligomer
2.9. Statistical analyses
Data were analyzed with GraphPad Prism™ software (version 8.2.1
for Windows™, San Diego, CA, USA). Normal distribution of data was
assessed with Shapiro-Wilk test. Normal distributed data were analyzed
with one-way ANOVA followed by Dunnett's multiple comparisons
adjustment. Non-parametric distributed data was analyzed with Mann-
Fig. 1. HPSEC and HPAEC profiles of fructans
from Agave tequilana and Cychorium intybus. (A)
Molecular weight distribution profiles of ITFs
and GTFs. GTF I molecular weight distribution is
DP 3–4. ITF I has chains smaller than 10 DP. GTF
II DP is around 17 with the presence of high
molecular weight components. ITF II DP ranges
between 9 and 60. Calibration of the system
using pullulan standards is indicated. B) GTF I is
composed of fructofuranosyl units with a termi
nal glucose. C) GTF II components belong to the
GF series as well, and some others are of the Fn
series. ITF II consists only of fructans of the GFn
type.
4
C. Fern´
andez-Lainez et al.
Carbohydrate Polymers 277 (2022) 118893
profile obtained from HPAEC demonstrates that GTF I is mainly
composed of kestose (GF2), nystose (GF3) and fructosylnystose (GF4)
(Fig. 1b). GTFII contains in addition to these sugars, oligosaccharides F2
and F3 (Fig. 1c). GTF II has longer structures of which DP17 is the most
abundant. Furthermore, in both GTFs, but specially in GTF I peaks that
overlap with those of ITFs were detected. Additionally, in these studied
GTFs, there were peaks detected which did not overlap with the ITFs
profiles and hence, might represent the (neo-) levan or graminan type
fructans.
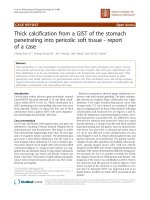
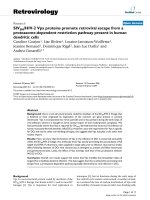
was of 1.04 with ITF II. Between GTF II and ITF II, a low and similar
activating effect was observed on TLR4, which was 1.19 enhanced by
GTF II, and 1.28 enhanced by ITF II (p < 0.01) (Fig. 3j).
3.4. Fructan-type influence the magnitude of inhibitory effect on
individual TLRs
As the final effects of fructans on THP-1-MD2-CD14 cells may depend
on the sum of activating and inhibiting effects of the fructans, we also
studied and compared inhibitory effects of ITFs and GTFs on TLRs. To
this end, all HEK-Blue™ cells were pre-incubated for 1 h with either 2
mg/ml of linear or 0.5, 1 and 2 mg/ml of branched fructans, followed by
administration of the appropriate agonists to each cell line.
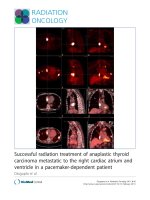
ITF I suppressed TLR5 and 9, with a fold change of 0.78 (p < 0.001)
for TLR5 (Fig. 4c), and a fold change of 0.9 (p < 0.0001) for TLR9
(Fig. 4f). The other TLRs were unaffected by ITF I (Fig. 4). This was
different with GTF I which strongly inhibited the activation of TLR 4, 8
and 9 in a dose dependent way (Fig. 4b, e, f). TLR4 activation was
strongly inhibited by GTF I from 0.834 (p < 0.0001) to a 0.0.395-fold
reduction (p < 0.0001), while the activation of TLR4 was not affected
by ITF I (Fig. 4b). TLR9-activation was reduced from 1.006 to a fold
change of 0.75 (p < 0.0001) by GTF I, while it was reduced to 0.9 (p <
0.0001) with ITF I (Fig. 4f). Interestingly, increasing the concentration
of GTF I, did not inhibit but rather significantly enhanced TLR3 and 7
activation (both p < 0.0001), which did not occur with ITF I (Fig. 4a, d).
As TLR2 forms heterodimers with TLR1 and TLR6 to induce immune
responses, we separately tested inhibition of TLR2-TLR1 by using the
specific agonist Pam3CSK4, and for TLR2-TLR6 heterodimer by applying
FSL-1. As shown in Fig. 5 a and c, the strongest inhibitory effect exerted
by GTF I, was observed on TLR2-TLR6 activation, which was reduced
from a fold change of 0.798 (p < 0.05) to 0.317 (p < 0.0001), and for
TLR2-TLR1 the signaling was reduced from a fold change of 0.899 (p <
0.05) for 0.5 mg/ml of GTF I, to a fold change of 0.409 (p < 0.0001) for
2 mg/ml of GTF I. The activation of TLR2 was not inhibited by ITF I.
ITF II had no inhibitory effect on TLRs-activation, while GTF II
strongly inhibited TLR2, 4 and 9 in a dose-dependent manner (Figs. 5b,
d, 6b, f). TLR4 activation was strongly inhibited by GTF II, and such
effect was proportional as the concentration increased, from a foldchange of 0.867 (p < 0.001) to 0.565 (p < 0.001) (Fig. 6b). To a lesser
extent, GTF II inhibited TLR9 activation from 0.979 to a fold-change of
0.88 (p < 0.0001) (Fig. 6f).
In addition, the branched GTF II strongly inhibited TLR2-TLR1
activation in a dose-dependent way (Fig. 5b). This was mainly due to
a strong reduction from 0.897 to a fold change of 0.421 (p < 0.0001).
While the TLR2-TLR6 activation was reduced from 0.861 to 0.395 (p <
0.0001) with GTF II 0.5 mg/ml and 2 mg/ml respectively (Fig. 5d).
Instead of being inhibited, TLR3, 5, 7 and 8 were significantly
increased with higher doses of GTF II. The largest increase observed was
for TLR3 with a fold change of 2.1 (p < 0.001). This was not observed
when cells were pre-treated with ITF II (Fig. 6a, c, d, e).
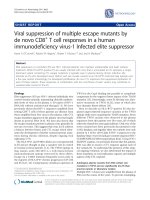
3.2. GTFs are stronger stimulators of NF-kB activation in THP-1-MD2CD14 cells than ITFs
ITFs and GTFs were tested for their capacity to induce NF-κB/AP-1
activation in a THP1-MD2-CD14 reporter cell line, which endogenously
expresses all TLRs. NF-κB and AP-1 are essential transcription factors in
signaling for cytokine release. ITFs were tested at a concentration of 2
mg/ml, as this was shown in a previous study to be an effective dose
(L´epine & de Vos, 2018; Vogt et al., 2013). GTFs were tested at con
centrations of 0.5, 1, and 2 mg/ml, as the concentration-dependent ef
fects are unknown.
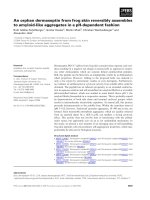
None of the ITFs were found to activate NF-κB/AP-1, except for ITF I
in presence of MyD88 inhibitor (Fig. 2). This was different with GTF I
and II that both activated NF-κB/AP-1. GTF I stimulated NF-κB/AP-1
only very mildly and only at a low concentration of 1 mg/ml (Fig. 2a).
This was different with GTF II, as the fold change was of 1.59 (p < 0.001)
compared with controls, and gradually increased with higher doses
(Fig. 2b). Next, we determined whether the NF-κB/AP-1 activation
observed with GTF I and II depends on the MyD88 signaling pathway, by
repeating the experiments and adding the MyD88 inhibitor at 50 μM.
MyD88 is the central transcription factor for all TLRs, with exception of
TLR3 and endosomal TLR4. This MyD88 suppression resulted in com
plete loss of GTF I activation but, the effect was not MyD88-dependent
with GTF II, as no reduction of NF-κB/AP-1 induced activation was
observed in presence of Pepinh-MYD (Fig. 2c–d). As TLRs might also
signal via TRIF pathway, we repeated the experiments with the TRIF
inhibitor peptide, and also tested GTF I during TRIF inhibition. This
resulted in a complete blockade of the GTF II induced activation of NFκB/AP-1, and had no effect on GTF I (Fig. 2e–f).
3.3. TLR-activation is fructan type-dependent
The foregoing experiments demonstrate that the activating effect of
GTFs and to a lesser extent the activating capacity of ITFs, are TLR
dependent either via MyD88 or TRIF signaling. To identify which TLRs
are activated, GTFs were also tested on reporter HEK-Blue cell lines
which express either TLRs 2, 3, 4, 5, 7, 8 or 9. GTFs were tested at
concentrations of 0.5, 1, and 2 mg/ml, while ITF I and II were included
to allow comparison between β(2→1) and β(2→1)-β(2→6) fructans. To
this end, we compared ITF I with GTF I as they are similar mixtures of
chain-length values and we compared ITF II with GTF II because they
share components with DP higher than 60.
ITF I only activated TLRs 2, 4 and 9. It exerted a stronger activation
of TLRs 2 and 4, than of TLR 9 (Fig. 3a, c, g). Values were different with
GTF I, which stimulated all TLRs. ITF I exerted a stronger activation of
TLR2, which was 3.2 (p < 0.0001) fold enhanced and only 1.2 with GTF I
(p < 0.001) (Fig. 3a). Also, TLR4 was strongly stimulated with ITF I
which was 2.57-fold enhanced (p < 0.0001), and only 1.08-fold by GTF I
(Fig. 3c). Effect on TLR5 by both fructans was similar and low, as it only
induced a fold change of 1.05 for ITF I and 1.2 (p < 0.05) for GTF I
(Fig. 3d).
ITF II only slightly stimulated TLRs 2 and 4 (Fig. 3h, j). While GTF II
activated all TLRs in a dose-dependent manner, except on TLR4. The
strongest stimulation observed with GTF II was on TLR9, with a 5.4-fold
change (p < 0.0001), which was of 1.09 with ITF II (Fig. 3n). Also, GTF II
induced a 4.05 (p < 0.0001) fold enhancement of TLR3 (Fig. 3i), which
3.5. Docking predicts fructans bind differently to TLRs
In order to gain insight into the molecular mechanisms that drive the
different activation and inhibitory effects exerted by ITFs and GTFs on
TLRs, molecular docking analyses were performed. To that end, 1-kes
tose, 6-kestose, GF10-inulin and GF10-agavin were selected as one of
the simplest structures that are present in the different fructans studied.
From the aforementioned structures, ITF I can only have 1-kestose, GTF I
and GTF II can have 6-kestose but neither of the ITFs can have it. ITF II
can only have GF10-inulin but cannot have GF10-agavin, and GTF II can
have both GF10-inulin and GF10-agavin. TLR2, TLR4 and TLR3 were
chosen for these analyses as they were strongly influenced by the fruc
tans and also because their crystal structure is well known.
5
C. Fern´
andez-Lainez et al.
Carbohydrate Polymers 277 (2022) 118893
Fig. 2. NF-κB/AP-1 activation in THP1-MD2-CD14 reporter cells expressing all TLRs. A–B) THP1-MD2-CD14 cells. C–D) THP1-MD2-CD14 cells with Pepinh-MYD.
E–F) THP1-MD2-CD14 cells with Pepinh-TRIF. Cells were pre-incubated in presence and absence of MyD88 inhibitor Pepinh-MYD, or TRIF inhibitor Pepinh-TRIF
during 6 h before stimulation with 2 mg/ml of short and long linear chain fructans (ITF I and II) and 0.5, 1 and 2 mg/ml of short and long branched chain fruc
tans (GTF I and II), after 24 h of incubation, NF-κB/AP-1 release was determined. Activation of NF-κB/AP-1 is presented as fold change of the untreated control.
Results represent the median with interquartile range of at least three independent experiments, with three technical replicates. Statistical significance levels
compared to the negative control were determined by Friedman test (non-parametric statistical test), followed by the Dunn's multiple comparisons test (post hoc
test). A p-value <0.05 was considered to be statistically significant (*p < 0.05, **p < 0.01, ***p < 0.001, ****p < 0.0001), p-values < 0.1 were considered as a trend.
6
C. Fern´
andez-Lainez et al.
Carbohydrate Polymers 277 (2022) 118893
Fig. 3. Activation effects of ITFs and GTFs on HEK-Blue™ reporter cell lines. Each cell line was incubated during 24 h with 2 mg/ml of ITFs and 0.5, 1 and 2 mg/ml
of GTFs. Next, NF-κB/AP-1 release was determined. Activation of NF-κB/AP-1 is presented as fold change of the untreated control. A–G) NF-κB/AP-1 activation effect
of GTF I compared with ITF I. H–N) NF-κB/AP-1 activation effect of GTF II compared with ITF II. Appropriate agonists for each TLR served as positive controls. At
least five independent assays, each one with three technical replicates. These data were normally distributed. Therefore, results are represented as the mean ± SD.
Statistical significance levels compared to the negative control were determined by one-way ANOVA with Holm-Sidak's multiple comparisons test. A p-value <0.05
was considered to be statistically significant (*p < 0.05, **p < 0.01, ***p < 0.001, ****p < 0.0001), p-values < 0.1 were considered as a trend.
7
C. Fern´
andez-Lainez et al.
Carbohydrate Polymers 277 (2022) 118893
Fig. 4. Inhibitory effects of ITF I and GTF I on HEK-Blue™ reporter cell lines. Cells expressing TLR3 (A), TLR4 (B), TLR5 (C), TLR7 (D), TLR8 (E), and TLR9 (F), were
pre-incubated during 1 h with short linear ITF I at 2 mg/ml and short branched GTF I at 0.5, 1 and 2 mg/ml, followed by the addition of the specific agonists for each
TLR, and incubation of 24 h. Next, NF-κB/AP-1 release was determined. Panels A-F show inhibitory effect of GTF I and ITF I on TLRs activation, expressed as foldchange of NF-κB/AP-1 induction, compared to that of each specific TLR agonist. Results represent the mean ± SD of at least five independent assays, each with three
technical replicates. Statistical comparisons were performed with one-way ANOVA and Geisser-Greenhouse correction, followed by Dunnett's multiple comparisons
test. A p-value <0.05 was considered to be statistically significant (*p < 0.05, **p < 0.01, ***p < 0.001, ****p < 0.0001), p-values < 0.1 were considered as a trend.
8
C. Fern´
andez-Lainez et al.
Carbohydrate Polymers 277 (2022) 118893
Fig. 5. Inhibitory effects of GTFs on HEK-Blue™ hTLR2 cells. Cells expressing TLR2-1 and TLR2-6 heterodimers, were pre-incubated during 1 h with 2 mg/ml of ITF I
and ITF II, and 0.5, 1 and 2 mg/ml of GTF I and GTF II, followed by addition of the specific agonists Pam3CSK4 for TLR2-TLR1 heterodimer, and FSL-1 for TLR2-TLR6
heterodimer. After 24 h of incubation, NF-κB/AP-1 release was determined. Panels A–B show inhibitory effects of fructans on TLR2-TLR1 heterodimer activation, and
panels C–D show inhibitory effect of fructans on TLR2-TLR6 heterodimer activation, expressed as fold-change of NF-κB/AP-1 induction, and compared to the positive
control of each TLR2-heterodimer. Results represent the mean ± SD of at least five independent assays, each with three technical replicates. Statistical comparisons
were performed with one-way ANOVA and Geisser-Greenhouse correction, followed by Dunnett's multiple comparisons test. A p-value <0.05 was considered to be
statistically significant (*p < 0.05, **p < 0.01, ***p < 0.001, ****p < 0.0001), p-values < 0.1 were considered as a trend.
[27]
3.5.1. TLR2 docking predicted interactions
Molecular docking analysis of TLR2 with representative molecules of
fructans, located them in different sites of this receptor. The best ranked
pose of 1-kestose had a binding energy of − 9.85 kcal/mol. 1-kestose
established interactions with TLR2 residues at the central part of the
ectodomain. Polar residues from TLR2 such as R447, S445 and K422
were interacting with 1-kestose (Fig. 7a–c). This was different with 6kestose. The best ranked pose of 6-kestose had a binding energy of
− 8,22 kcal/mol and was found in a different region than the one found
for 1-kestose. 6-kestose was located within the agonist binding pocket of
TLR2. 6-kestose interacted with the 18 residues that conforms the pocket
. Most of amino acid residues interacting with 6-kestose were nonpolar, such as leucine, isoleucine and valine. Three hydrogen bonds
were formed between F322, F349 and L350 residues and 6-kestose
(Fig. 7d–e).
1-kestose was found at the surface of TLR2 at the central ectodomain
and at 19.2 Å from the entrance of the agonist binding site. GF10-inulin
was interacting with amino acid residues H238, L214, T236, Q209,
D233 and K208 through hydrophobic interactions and hydrogen bonds
(Fig. 7f–h).
GF10-agavin was found located outside of the TLR2 pocket agonist
entrance, exerting a partial blocking of this cavity, it was found
9
C. Fern´
andez-Lainez et al.
Carbohydrate Polymers 277 (2022) 118893
Fig. 6. Inhibitory effects of ITF II and GTF II on HEK-Blue™ reporter cell lines. Cells expressing TLR3 (A), TLR4 (B), TLR5 (C), TLR7 (D), TLR8 (E), and TLR9 (F),
were pre-incubated during 1 h with ITF II at 2 mg/ml and GTF II at 0.5, 1 and 2 mg/ml, followed by the addition of the specific agonists for each TLR, and incubation
of 24 h. Next, NF-κB/AP-1 release was determined. Panels A–F show inhibitory effect of GTF II and ITF II on TLRs activation, expressed as fold-change of NF-κB/AP-1
induction, compared to that of each specific TLR agonist. Results represent the mean ± SD of at least five independent assays, each with three technical replicates.
Statistical comparisons were performed with one-way ANOVA and Geisser-Greenhouse correction, followed by Dunnett's multiple comparisons test. A p-value <0.05
was considered to be statistically significant (*p < 0.05, **p < 0.01, ***p < 0.001, ****p < 0.0001), p-values < 0.1 were considered as a trend.
10
C. Fern´
andez-Lainez et al.
Carbohydrate Polymers 277 (2022) 118893
Fig. 7. Proposed binding site of fructans to TLR2-TLR1. Panels A–C demonstrates that 1-kestose binds to residues of the TLR2-TLR1 interface. Panels D–E indicates
that 6-kestose has affinity to the Pam3CSK4 binding pocket of TLR2-TLR1. Panels F–H shows that GF10-inulin interacts with the TLR2 surface. Panels I–J show GF10agavin established molecular interactions with amino acid residues of the agonist entrance pocket.
11
C. Fern´
andez-Lainez et al.
Carbohydrate Polymers 277 (2022) 118893
Fig. 7. (continued).
interacting with key amino acid residues of the binding site, such as
Y326 and F325 (Fig. 7i–j).
3.5.2. TLR4 docking predicted interactions
As profound TLR4 inhibitory effects were observed for GTFs, docking
analysis was performed to predict the potential binding sites of these
12
C. Fern´
andez-Lainez et al.
Carbohydrate Polymers 277 (2022) 118893
fructans. Docking analysis was made with the TLR4-MD2 complex with
each of the four fructans. The functional unit of the TLR4-MD2 complex
is formed by two TLR4 subunits, each forming a heterodimer with one
MD-2 protein (Fig. 8a). The analysis predicts 1-kestose to bind within
the MD-2 protein pocket (Fig. 8a). 1-kestose was found to interact only
with MD-2 protein mainly through hydrophobic interactions with nonpolar amino acid residues, such as I52, L61, L78, F147 and F151
(Fig. 8b–c). 6-kestose was also found within the MD-2 pocket (Fig. 8f),
however the hydrophobic residues I32, I46, I94 and Y102 interacted
with 6-kestose but not with 1-kestose (Fig. 8e–f). GF10-inulin was found
near the TLR4-MD2 interface (Fig. 8g). GF10-inulin only interacted with
amino acid residues of TLR4 such as H458 and G384, and those residues
have not been described as key residues for interaction with LPS or for
heterodimerization (Fig. 8h–i). Conversely, GF10-agavin was found to
interact with TLR4 as well as with MD-2 (Fig. 8j). GF10-agavin estab
lished contact with some of the MD2 amino acid residues that participate
in the interaction with LPS such as I124. Furthermore, GF10-agavin
interacted with 14 amino acid residues from MD-2 (Fig. 8k–l).
3.5.3. TLR3 docking predicted interactions
Enhancement of the activation instead of inhibition of TLR3 medi
ated by GTFs was found during the inhibition assays (Figs. 4a, 6a). In
order to gain insight in the possible mechanism, docking analyses were
performed with TLR3 and representative molecules of fructans. 1-kes
tose was located at the non-glycosylated side face of TLR3 (Fig. 9a, b),
interacting with polar amino acid residues of TLR3, such as S160, K187
and E190 (Fig. 9c). 6-kestose was found located at N-terminal end of
TLR3 (Fig. 9d–e). This molecule was interacting with key amino acids
Fig. 8. Predicted sites of interaction between fructans and the TLR4-MD-2 heterodimer. The 1-kestose binding site was within the MD-2 pocket (A–C). 6-kestose
established interactions with hydrophobic residues of the MD-2 pocket (D–F). GF10-inulin only interacted with TLR4 amino acid residues (G–I). GF10-agavin was
found to interact with both TLR4 and MD-2 (J–L).
13
C. Fern´
andez-Lainez et al.
Carbohydrate Polymers 277 (2022) 118893
Fig. 8. (continued).
described for interaction with the natural agonist of TLR3, such as H39,
H60, F84 and H108 (Fig. 9f) (Choe et al., 2005). On the other hand,
GF10-inulin, was located at the glycosylated face of TLR3 (Fig. 9g–h).
GF10-inulin was found interacting with polar amino acid residues such as
E189 and R222, as well as hydrophobic amino acid residues such as
I220, L243 and F217 (Fig. 9i). It was different GF10-agavin, which was
found at the N-terminal end of TLR3 (Fig. 9j–k), and the key arginine 64
was one of the amino acid residues which established an interaction with
GF10-agavin (Fig. 9l).
3.6. Fructans induce branching and structure-dependent inhibitory effects
on cytokine production of TLR2 and TLR4 stimulated DCs
Dendritic cells are key players in the gut mucosal immune system
and are distributed along the intestinal epithelium (Rescigno et al.,
2001). We therefore investigated whether the fructans can also influ
ence cytokine production of DCs. To that end, we incubated DCs for 48 h
in the presence and absence of the fructans and determined cytokine
release. However, as shown in Fig. S2, the fructans as such did not
change cytokine production of DCs (Fig. S2). Since a strong inhibitory
effect of the activation of TLR2 and TLR4 was found in HEK-cells, we
14
C. Fern´
andez-Lainez et al.
Carbohydrate Polymers 277 (2022) 118893
Fig. 8. (continued).
investigated in a next set of experiments whether fructans may reduce
inflammatory responses induced by agonists for these two TLRs.
Therefore, we pre-incubated DCs for 1 h with fructans followed by a
stimulation with a combination of TLR2 agonists (FSL-1 and Pam3CSK4)
and the TLR4 agonist LPS.
Pre-incubation of DCs with fructans caused attenuation of the in
flammatory effect of the TLR2 agonist. ITF I only had a minor effect on
the TLR2 induced release of TNFα by DCs (Fig. 10a). This was different
for ITF II, which induced a 0.52-fold reduction (p < 0.05) in the TLR2
induced TNFα release. The pre-incubation of DCs with GTF I induced a
0.51-fold reduction (p < 0.05) in the production of TLR2 induced proinflammatory cytokine TNFα release. However, pre-incubation of DCs
with GTF II did not induce a significant decrease of TLR2 induced TNFα
production (Fig. 10a). No significant differences were found when DCs
were preincubated with the fructans for production of MCP-1/CCL2,
MIP-1α/CCL3, IL-1RA, IL-1β, IL-6 and IL-10 (Fig. S3a–f).
We also studied the effect of fructans on the cytokine production of
DCs when stimulated with the TLR4 agonist LPS. ITF I had no significant
effect on chemokine ligand of monocyte chemoattractant protein-1
(MCP-1)/CC (CCL2) (Fig. 10b). However, pre-incubation of ITF II fol
lowed by the addition of LPS, caused a decrease of 0.34-fold MCP-1/CC
(CCL2) (p < 0.001) in TLR4 stimulated DCs. GTF I strongly attenuated
MCP-1/CC (CCL2) in the TLR4 stimulated DCs with a 0.41-fold (p <
0.0001) reduction. Similar results were found for the pre-incubation of
DCs with GTF II, which induced a 0.32-fold decrease (p < 0.001) in the
TLR4 stimulated DCs (Fig. 10b).
The production of TNFα was not decreased when TLR4 stimulated
DCs were pre-incubated with ITF I. This was different for GTF I, since the
15
C. Fern´
andez-Lainez et al.
Carbohydrate Polymers 277 (2022) 118893
Fig. 8. (continued).
production of TNFα was 0.66-fold decreased (p < 0.05) in TLR4 stimu
lated DCs (Fig. 10c). A tendency to decrease the TNFα production was
also observed in TLR4 stimulated DCs exposed to ITF II (0.73-fold, p <
0.1). This finding was different with GTF II, since no decrease in the
production of TNFα was observed in TLR4 stimulated DCs (Fig. 10c). For
IL6 we found no statistical lowered production in TLR4-stimulated DCs
although GTF I showed a tendency to decrease with a fold change of 0.69
(p < 0.1) (Fig. S4d).
immunomodulating effects via TLRs. We show that GTFs especially
stimulate TLRs 3, 7 and 9 while they were also able to inhibit TLR2 and
TLR4. Also, by performing in silico docking studies we identified the
ligand binding sites for ITFs and GTFs on TLRs. To the best of our
knowledge, this is the first study that demonstrates the direct effect of
GTFs on human TLR signaling, their modes of interaction, as well as
their influence on cytokine production in TLR2 and TLR4 stimulated
dendritic cells.
In this study we investigated both the MyD88 and TRIF dependent
pathways that might be influenced by fructans. MyD88 is involved in the
signaling of all TLRs except TLR3 and endosomal TLR4 while TRIF
signaling is involved in TLR3 and endosomal TLR4 activation (Yama
moto et al., 2003). When testing the stimulation of TLRs by GTFs, we
found that in contrast to ITFs the downstream pathway followed for NF-
4. Discussion
The chemical structure and chain length of branched β(2→1)/
β(2→6)-linked fructans from Agave tequilana and linear β(2→1)-linked
fructans from Cichorium intybus were investigated and compared for
16
C. Fern´
andez-Lainez et al.
Carbohydrate Polymers 277 (2022) 118893
Fig. 9. Molecular interactions predicted between fructans and TLR3. 1-kestose was found to be located at the non-glycosylated side face of TLR3 (A–C). 6-kestose was
located at the N-terminal end of TLR3 (D–F). GF10-inulin was found located at the glycosylated face of TLR3 (G–I). GF10-agavin was found at the N-terminal end of
TLR3 (J–L).
17
C. Fern´
andez-Lainez et al.
Carbohydrate Polymers 277 (2022) 118893
Fig. 9. (continued).
κB/AP-1 activation was different between both GTFs. When adding
MyD88 inhibitor peptide to GTF I, the activation of NF-κB/AP-1 was
completely lost which was different for GTF II where activation of NFκB/AP-1 was only inhibited when adding the TRIF inhibitor. Thus, we
show that GTF II not only depends on MyD88 but also on TRIF pathway
for TLR signaling. As the main difference between GTFI and GTFII is the
presence of molecules above DP 60 in GTF II, our data suggest that
differences observed in the downstream signaling pathways of GTFs is
dependent on the differences in structure between them.
Not only different pathways but also different TLRs were activated
and inhibited by the fructans in a structure dependent way. The capacity
to recognize a broad panel of ligands by TLRs is caused and determined
18
C. Fern´
andez-Lainez et al.
Carbohydrate Polymers 277 (2022) 118893
Fig. 10. Cytokine production (fold change of positive control) by dendritic cells pre-treated with GTFs and ITFs and stimulated with TLR2 and TLR4 agonists. *
represent statistical differences between positive control and the different treatments (*p < 0.05, **p < 0.01, ***p < 0.001, ****p < 0.0001), p-values < 0.1 were
considered as a trend.
by the leucine rich repeats (LRR) scaffold in TLRs which can accom
modate a broad diversity of structures (Bell et al., 2005). When
comparing the capacity of ITFs and GTFs to activate TLRs in HEK-Blue
cell lines we found that ITFs and GTFs activate different TLRs. ITFs
stimulated TLRs which were dependent on the MyD88 pathway such as
TLR2 and 4 which corroborates our previous findings (Vogt et al., 2013)
but a different and stronger activation was observed with GTFs that
stimulated TRIF dependent TLRs such as TLR3, TLR7 and TLR9. This
illustrated again the structure dependent immunomodulating effects of
fructans.
Not only activation but also inhibition of TLR signaling was observed
by GTFs. In several studies it has been shown that this capacity of food
components is functional and can attenuate inflammatory responses
(Kiewiet et al., 2018). Especially GTFs had a strong inhibitory effect on
activation of TLR2 and TLR4. To gain insight in how GTFs can have such
a strong inhibitory effect, we performed molecular docking studies to
identify the site of interaction of representative molecules with TLRs.
For TLR2, we studied how fructans can interact with binding to its
heterodimer with TLR1 which is essential for TLR2 induced immune
activation and cytokine release (Jin et al., 2007). This study demon
strates that 6-kestose can bind within the pocket of TLR2 where the
natural agonist of its receptor Pam3CSK4 normally binds to the TLR2-1
heterodimer. This finding suggests that 6-kestose prevents binding of
TLR2-1 ligands such as Pam3CSK4 to activate TLR2. GF10-agavin was
19
C. Fern´
andez-Lainez et al.
Carbohydrate Polymers 277 (2022) 118893
found outside of the entrance for TLR2 agonist partially blocking this
pocket. Moreover, this molecule established contact with Y326 residue,
which has been described as a key residue for agonist binding to TLR2
(Jin et al., 2007). These findings suggest that both studied molecules
possess the ability to avoid the binding of agonist to TLR2, although the
site of binding is structure dependent.
Interaction of 1-kestose and GF10-inulin with TLR2 was also observed
but this was not in the ligand binding sites of TLR2-1 but in the heter
odimer interface for 1-kestose, and in the central ectodomain for GF10inulin, which therefore could explain the observed lack of inhibitory
effect but mild activating effects, which has been reported before (Vogt
et al., 2013). These differences in the inhibition capacity between the
studied fructans, might be related to the presence of β(2→6) bonds and
the branched structure of GTFs, since GTFs' branched structure is more
similar to the branched configuration of the lipid chains that normally fit
in the TLR2 pocket (Jin et al., 2007).
GTFs also exerted a strong inhibitory effect on TLR4. Activation of
TLR4 requires the formation of a heterodimer with MD2 protein (Park
et al., 2009). The natural agonist of TLR4 is LPS (Kim et al., 2007) which
binds to TLR4-MD2 complex through its acyl non-polar chains. Parts of
these chains exert hydrophobic interactions with the TLR4-MD2 pocket
which facilitates the dimerization. Our docking studies demonstrate the
unique capacity of 6-kestose and GF10-agavin to interact with key resi
dues for the formation of the TLR4-MD2 complex or for the binding of
LPS such as I32, I46 and I94 and I124, by which it can inhibit the TLR4
activation induced by LPS. 1-kestose and GF10-inulin interacted differ
ently with TLR4 and MD2. 1-kestose only interacted with MD2 residues
such as L78 and F147, while GF10-inulin only interacted with TLR4
residues such as H458 and G384. Moreover, none of these interactions
were with key-amino acids involved in activation of the receptor or
formation of the heterodimer. Again, this prediction could illustrate the
characteristic properties of β(2→6) fructans to inhibit signaling of some
proinflammatory TLRs.
Findings were different with TLR3. Preincubation with GTFs induced
a stronger effect of the agonist for TLR3 rather than an inhibition
illustrating the synergistic effect of the agonist and GTFs. Our docking
studies revealed that 6-kestose and GF10-agavin interacted with residues
of TLR3 which have been previously described as key residues for
interaction of this receptor with its natural agonist (Bell et al., 2005;
Choe et al., 2005). The natural agonist of TLR3 is viral double stranded
RNA (Bell et al., 2005; Choe et al., 2005). It has also been proposed that
phosphate and ribose sugar moieties of RNA are responsible for in
teractions and activation of TLR3 (Bell et al., 2005). The structural
similarities between ribose arrangement in RNA helix and the fructose
units in GTFs with β(2→6) bonds and branched structure might explain
the recognition of these polysaccharides by TLR3 and its over stimula
tion. This was different with 1-kestose and GF10-inulin, since these
molecules established interactions with amino acid residues located at
the glycosylated face and the N-terminal end of TLR3. These glycosy
lated sites represent a steric hindrance for the binding of the agonist to
TLR3 (Bell et al., 2005). Thus, this might be the explanation for the
absence of interaction between ITFs and TLR3.
Dendritic cells are key players in the intestine immunity and are able
to distinguish harmful from harmless antigens (Mowat, 2003; Rescigno
et al., 2001; Sato & Iwasaki, 2005). They are equipped with TLRs and
overactivation may lead to several intestinal and systemic disorders
(Mowat, 2003). We therefore next tested whether ITFs are able to
manage inflammatory responses by attenuating TLR2-1 and TLR4
induced responses in dendritic cells. As such the fructans did not change
cytokines of unstimulated dendritic cells which corroborates previous
findings (Bermudez-Brito et al., 2015). This was different in TLR2 and
TLR4 stimulated dendritic cells. Both types of GTFs as well as ITFII had a
profound inhibitory effect on TLR2 and TLR4 induced immune activa
tion of dendritic cells. GTF I also exerted a reduction in the production of
the chemokine ligand of monocyte chemoattractant protein-1 (MCP-1)/
CC (CCL2) induced by TLR induced activation. This attenuation aligns
with the findings of the docking studies and could possibly also be an
explanation for the modulation in release of proinflammatory cytokines
by immune cells described for other polysaccharides with prebiotic ac
tivity, such as galacto-oligo-saccharides, goat milk oligosaccharides and
´n-Can
˜ adas et al., 2014).
also fructooligosaccharides and inulins (Capita
In summary our findings may explain the mechanisms by which
immunomodulating food ingredients such as agave fructans with
β(2→6) bonds beneficially modulate immune responses (BermudezBrito et al., 2015; Vogt et al., 2013; Vogt et al., 2014). Agave plants are
´pez-Romero et al., 2018) and
endemic in the Latin American region (Lo
often used as an affordable source for obtaining fructans for food sup
plementation to support health. However, our data also suggest that the
structure of fructans should be carefully determined and taken into
consideration when intended to be used as food supplement as we show
that the presence of linear or branched structure, the chain-length, as
well as the dose of these molecules can exert differential responses.
Further studies are needed in order to establish specifically in which
disease state agave fructans could serve as an alternative or supple
mental therapeutic option (Liu et al., 2004). As TLR2 and TLR4 signaling
have been shown to be involved in mucositis and other intestinal dis
orders our data suggest that GTFs and ITF II have beneficial effects on
these disorders. This suggestion is supported by a recent observation
that ITF II supported gastrointestinal health in aged individuals (Kiewiet
et al., 2021). Overall our study shows that beneficial immunomodula
tory effects of GTFs may be explained by its impact on TLRs and
attenuation of proinflammatory responses.
CRediT authorship contribution statement
´ndez-Lainez: Conceptualization, Methodology, Investiga
C. Ferna
tion, Formal analysis, Software, Writing – original draft. R. Akkerman:
Methodology, Writing – review & editing. M.M.P. Oerlemans: Meth
odology, Writing – review & editing. M.J. Logtenberg: Methodology,
Writing – review & editing. H.A. Schols: Conceptualization, Method
ology, Formal analysis, Writing – review & editing. L.A. Silva-Lagos:
´ pez-Vela
´ zquez:
Methodology, Writing – review & editing. G. Lo
Conceptualization, Methodology, Formal analysis, Software, Writing –
review & editing. P. de Vos: Conceptualization, Writing – review &
editing, Supervision, Project administration.
Declaration of competing interest
The authors declare no conflict of interest.
Acknowledgements
This study was partially financed by the “Programa de Recursos
´n” from Instituto Nacional de Pediatría, Grant
Fiscales para Investigacio
number 2019/062. C.F.L. was financially supported by Abel Tasman
Talent Program Sandwich PhD from the University of GroningenUniversity Medical Center Groningen, UG/UMCG in collaboration
´noma de M´exico, UNAM and CONACyT
with Universidad Nacional Auto
(#260625).
Appendix A. Supplementary data
Supplementary data to this article can be found online at https://doi.
org/10.1016/j.carbpol.2021.118893.
References
Abreu, M. T. (2010). Toll-like receptor signalling in the intestinal epithelium: How
bacterial recognition shapes intestinal function. Nature Reviews Immunology, 10,
131–144.
Beaglehole, R., Bonita, R., Horton, R., Adams, C., Alleyne, G., Asaria, P., & Casswell, S.
(2011). Priority actions for the non-communicable disease crisis. The Lancet, 377
(9775), 1438–1447.
20
C. Fern´
andez-Lainez et al.
Carbohydrate Polymers 277 (2022) 118893
possible applications in food and pharmaceuticals. Journal of the Science of Food and
Agriculture, 98(7), 2461–2474.
L´
opez-Vel´
azquez, G., Parra-Ortiz, M., de la Mora-de la Mora, I., García-Torres, I.,
Enríquez-Flores, S., Alc´
antara-Ortigoza, M. A., & Cruz-Rubio, J. M. (2015). Effects of
fructans from Mexican agave in newborns fed with infant formula: a randomized
controlled trial. Nutrients, 7(11), 8939–8951.
Mancilla-Margalli, N. A., & L´
opez, M. G. (2006). Water-soluble carbohydrates and
fructan structure patterns from agave and dasylirion species. Journal of Agricultural
and Food Chemistry, 54(20), 7832–7839.
Mowat, A. M. (2003). Anatomical basis of tolerance and immunity to intestinal antigens.
Nature Reviews Immunology, 3(4), 331–341.
Oerlemans, M. M., Akkerman, R., Ferrari, M., Walvoort, M. T., & de Vos, P. (2020).
Benefits of bacteria-derived exopolysaccharides on gastrointestinal microbiota,
immunity and health. Journal of Functional Foods, 104289.
Park, B. S., Song, D. H., Kim, H. M., Choi, B.-S., Lee, H., & Lee, J.-O. (2009). The
structural basis of lipopolysaccharide recognition by the TLR4–MD-2 complex.
Nature, 458(7242), 1191–1195.
Patry, R. T., & Nagler, C. R. (2021). Fiber-poor Western diets fuel inflammation. Nature
Immunology, 1–3.
P´
erez-L´
opez, A. V., & Simpson, J. (2020). The sweet taste of adapting to the desert:
Fructan metabolism in agave species. Frontiers in Plant Science, 11, 324.
Pettersen, E. F., Goddard, T. D., Huang, C. C., Couch, G. S., Greenblatt, D. M.,
Meng, E. C., & Ferrin, T. E. (2004). UCSF Chimera—a visualization system for
exploratory research and analysis. Journal of Computational Chemistry, 25(13),
1605–1612.
Rescigno, M., Urbano, M., Valzasina, B., Francolini, M., Rotta, G., Bonasio, R., &
Ricciardi-Castagnoli, P. (2001). Dendritic cells express tight junction proteins and
penetrate gut epithelial monolayers to sample bacteria. Nature Immunology, 2(4),
361–367.
Roberfroid, M. B. (2005). Introducing inulin-type fructans. British Journal of Nutrition, 93
(S1), S13–S25.
Roberfroid, M. B., Van Loo, J. A., & Gibson, G. R. (1998). The bifidogenic nature of
chicory inulin and its hydrolysis products. The Journal of Nutrition, 128(1), 11–19.
Sahasrabudhe, N. M., Beukema, M., Tian, L., Troost, B., Scholte, J., Bruininx, E., &
Schols, H. A. (2018). Dietary fiber pectin directly blocks toll-like receptor 2–1 and
prevents doxorubicin-induced ileitis. Frontiers in Immunology, 9, 383.
Sato, A., & Iwasaki, A. (2005). Peyer’s patch dendritic cells as regulators of mucosal
adaptive immunity. Cellular and Molecular Life Sciences, 62(12), 1333–1338.
Takeda, K., & Akira, S. (2004). TLR signaling pathways. Seminars in Immunology, 16, 3–9.
Elsevier.
Temba, G. S., Kullaya, V., Pecht, T., Mmbaga, B. T., Aschenbrenner, A. C., Ulas, T., &
Kumar, V. (2021). Urban living in healthy tanzanians is associated with an
inflammatory status driven by dietary and metabolic changes. Nature Immunology, 22
(3), 287–300.
Van den Abbeele, P., Duysburgh, C., Ghyselinck, J., Goltz, S., Berezhnaya, Y., Boileau, T.,
& Marzorati, M. (2021). Fructans with varying degree of polymerization enhance the
selective growth of bifidobacterium animalis subsp. Lactis BB-12 in the human gut
microbiome in vitro. Applied Sciences, 11(2), 598.
Van den Ende, W. (2013). Multifunctional fructans and raffinose family oligosaccharides.
Frontiers in Plant Science, 4, 247.
Veronese, N., Solmi, M., Caruso, M. G., Giannelli, G., Osella, A. R., Evangelou, E., &
Tzoulaki, I. (2018). Dietary fiber and health outcomes: An umbrella review of
systematic reviews and meta-analyses. The American Journal of Clinical Nutrition, 107
(3), 436444.
ă
Versluys, M., Kirtel, O., Toksoy Oner,
E., & Van den Ende, W. (2018). The fructan
syndrome: Evolutionary aspects and common themes among plants and microbes.
Plant, Cell & Environment, 41(1), 16–38.
Vijn, I., & Smeekens, S. (1999). Fructan: More than a reserve carbohydrate? Plant
Physiology, 120(2), 351–360.
Vogt, L., Ramasamy, U., Meyer, D., Pullens, G., Venema, K., Faas, M. M., & de Vos, P.
(2013). Immune modulation by different types of β2→ 1-fructans is toll-like receptor
dependent. PLoS One, 8(7), Article e68367.
Vogt, L. M., Meyer, D., Pullens, G., Faas, M. M., Venema, K., Ramasamy, U., & de Vos, P.
(2014). Toll-Like Receptor 2 Activation by b2→ 1-Fructans Protects Barrier Function of
T84 Human Intestinal Epithelial Cells in a Chain Length–Dependent Manner.
Vogt, L. M., Elderman, M. E., Borghuis, T., de Haan, B. J., Faas, M. M., & de Vos, P.
(2017). Chain length-dependent effects of inulin-type fructan dietary fiber on human
systemic immune responses against hepatitis-B. Molecular Nutrition & Food Research,
61(10), 1700171.
Yamamoto, M., Sato, S., Hemmi, H., Hoshino, K., Kaisho, T., Sanjo, H., & Takeda, K.
(2003). Role of adaptor TRIF in the MyD88-independent toll-like receptor signaling
pathway. Science, 301(5633), 640–643.
Bell, J. K., Botos, I., Hall, P. R., Askins, J., Shiloach, J., Segal, D. M., & Davies, D. R.
(2005). The molecular structure of the toll-like receptor 3 ligand-binding domain.
Proceedings of the National Academy of Sciences, 102(31), 10976–10980.
Berman, H. M., Westbrook, J., Feng, Z., Gilliland, G., Bhat, T. N., Weissig, H., &
Bourne, P. E. (2000). The protein data bank. Nucleic Acids Research, 28(1), 235242.
Bermudez-Brito, M., Sahasrabudhe, N. M., Ră
osch, C., Schols, H. A., Faas, M. M., & de
Vos, P. (2015). The impact of dietary fibers on dendritic cell responses in vitro is
dependent on the differential effects of the fibers on intestinal epithelial cells.
Molecular Nutrition & Food Research, 59(4), 698–710.
Capit´
an-Ca˜
nadas, F., Ortega-Gonz´
alez, M., Guadix, E., Zarzuelo, A., Su´
arez, M. D., de
Medina, F. S., & Martínez-Augustin, O. (2014). Prebiotic oligosaccharides directly
modulate proinflammatory cytokine production in monocytes via activation of TLR
4. Molecular Nutrition & Food Research, 58(5), 1098–1110.
Cheng, L., Kiewiet, M. B., Groeneveld, A., Nauta, A., & de Vos, P. (2019). Human milk
oligosaccharides and its acid hydrolysate LNT2 show immunomodulatory effects via
TLRs in a dose and structure-dependent way. Journal of Functional Foods, 59,
174–184.
Choe, J., Kelker, M. S., & Wilson, I. A. (2005). Crystal structure of human toll-like
receptor 3 (TLR3) ectodomain. Science, 309(5734), 581–585.
DeLano, W. L. (2002). Pymol: An open-source molecular graphics tool. CCP4 Newsletter
on Protein Crystallography, 40(1), 82–92.
Filippov, I. V., & Nicklaus, M. C. (2009). Optical structure recognition software to
recover chemical information: OSRA, an open source solution. Journal of Chemical
Information and Modeling, 49(3), 740–743.
Flamm, G., Glinsmann, W., Kritchevsky, D., Prosky, L., & Roberfroid, M. (2001). Inulin
and oligofructose as dietary fiber: A review of the evidence. Critical Reviews in Food
Science and Nutrition, 41(5), 353–362.
Gay, N. J., & Gangloff, M. (2007). Structure and function of toll receptors and their
ligands. Annual Review of Biochemistry, 76, 141–165.
Grosdidier, A., Zoete, V., & Michielin, O. (2011). SwissDock, a protein-small molecule
docking web service based on EADock DSS. Nucleic Acids Research, 39(suppl_2),
W270–W277.
Hanwell, M. D., Curtis, D. E., Lonie, D. C., Vandermeersch, T., Zurek, E., &
Hutchison, G. R. (2012). Avogadro: An advanced semantic chemical editor,
visualization, and analysis platform. Journal of Cheminformatics, 4(1), 1–17.
Health, U. D.o., & Services, H. (2015). US Department of Agriculture. 2015–2020 dietary
guidelines for Americans. Washington, DC.
Jin, M. S., Kim, S. E., Heo, J. Y., Lee, M. E., Kim, H. M., Paik, S.-G., & Lee, J.-O. (2007).
Crystal structure of the TLR1-TLR2 heterodimer induced by binding of a tri-acylated
lipopeptide. Cell, 130(6), 1071–1082.
Kiewiet, M. B., Rodríguez, M. I. G., Dekkers, R., Gros, M., Ulfman, L. H., Groeneveld, A.,
& Faas, M. M. (2018). The epithelial barrier-protecting properties of a soy
hydrolysate. Food & Function, 9(8), 4164–4172.
Kiewiet, M. B. G., Elderman, M. E., El Aidy, S., Burgerhof, J. G. M., Visser, H.,
Vaughan, E. E., & de Vos, P. (2021). Flexibility of gut microbiota in ageing
individuals during dietary fiber long-chain inulin intake. Molecular Nutrition & Food
Research, 65(4), 2000390.
Kim, H. M., Park, B. S., Kim, J.-I., Kim, S. E., Lee, J., Oh, S. C., & Yoo, O. J. (2007). Crystal
structure of the TLR4-MD-2 complex with bound endotoxin antagonist eritoran. Cell,
130(5), 906–917.
Kim, S., Chen, J., Cheng, T., Gindulyte, A., He, J., He, S., & Yu, B. (2019). PubChem 2019
update: Improved access to chemical data. Nucleic Acids Research, 47(D1),
D1102–D1109.
Krieger, E., Joo, K., Lee, J., Lee, J., Raman, S., Thompson, J., & Karplus, K. (2009).
Improving physical realism, stereochemistry, and side-chain accuracy in homology
modeling: Four approaches that performed well in CASP8. Proteins: Structure,
Function, and Bioinformatics, 77(S9), 114–122.
L´
epine, A., & de Vos, P. (2018). Synbiotic effects of the dietary fiber long-chain inulin
and probiotic lactobacillus acidophilus W37 can be caused by direct, synergistic
stimulation of immune toll-like receptors and dendritic cells. Molecular Nutrition &
Food Research, 62(15), 1800251.
Liu, F., Liu, Y., Meng, Y., Yang, M., & He, K. (2004). Structure of polysaccharide from
polygonatum cyrtonema hua and the antiherpetic activity of its hydrolyzed
fragments. Antiviral Research, 63(3), 183–189.
L´
opez, M. G., & Urías-Silvas, J. E. (2007). Agave fructans as prebiotics. Recent Advances in
Fructooligosaccharides Research, 37, 1–14.
Lopez, M. G., Mancilla-Margalli, N. A., & Mendoza-Diaz, G. (2003). Molecular structures
of fructans from Agave tequilana Weber var. Azul. Journal of Agricultural and Food
Chemistry, 51(27), 7835–7840.
L´
opez-Romero, J. C., Ayala-Zavala, J. F., Gonz´
alez-Aguilar, G. A., Pe˜
na-Ramos, E. A., &
Gonz´
alez-Ríos, H. (2018). Biological activities of agave by-products and their
21