Polysaccharide-based hydrogels crosslink density equation: A rheological and LF-NMR study of polymer-polymer interactions
Bạn đang xem bản rút gọn của tài liệu. Xem và tải ngay bản đầy đủ của tài liệu tại đây (9.88 MB, 15 trang )
Carbohydrate Polymers 277 (2022) 118895
Contents lists available at ScienceDirect
Carbohydrate Polymers
journal homepage: www.elsevier.com/locate/carbpol
Polysaccharide-based hydrogels crosslink density equation: A rheological
and LF-NMR study of polymer-polymer interactions
Tilen Kopaˇc a, Michela Abrami b, Mario Grassi b, Aleˇs Ruˇcigaj a, Matjaˇz Krajnc a, *
a
b
University of Ljubljana, Faculty of Chemistry and Chemical Technology, Veˇcna pot 113, SI-1000 Ljubljana, Slovenia
University of Trieste, Department of Engineering and Architecture, Building B, via Valerio 6, I-34127 Trieste, Italy
A R T I C L E I N F O
A B S T R A C T
Keywords:
Crosslink density
Rheology
LF-NMR
Hydrogel interactions
Mathematical modeling
A simple relation between pendant groups of polymers in hydrogels is introduced to determine the crosslink
density of (complex) hydrogel systems (mixtures of 2,2,6,6-tetramethylpiperidine-1-oxyl (TEMPO) modified
nanocellulose, alginate, scleroglucan and Laponite in addition of crosslinking agents). Furthermore, the rheo
logical properties and their great potential connection to design complex hydrogel systems with desired prop
erties have been thoroughly investigated. Hydrogel structures governing internal friction and flow resistance
were described by the predominant effect of ionic, hydrogen, and electrostatic interactions. The relationship
between rheological properties and polymer-polymer interactions in the hydrogel network is explained and
expressed in a new mathematical model for determining the crosslink density of (crosslinked) hydrogels based on
single or mixture of polymer systems. In the end, the combined used of rheology and low field nuclear magnetic
resonance spectroscopy (LF-NMR) for the characterization of hydrogel networks is developed.
1. Introduction
Hydrogels belong to a group of intelligent materials (Mahinroosta
et al., 2018) that, due to their many unique mechanical, physical and
chemical properties, have found a significant role in a wide applicability
in many fields (Chen et al., 2019; Zinge & Kandasubramanian, 2020). In
recent years, there has been an increasing interest in researching the use
of hydrogels in medicine (Rosiak & Yoshii, 1999), pharmacy (Peppas
et al., 2000), including clinical studies, diagnostics and cell immobili
zation (Hoare & Kohane, 2008), separation of biomolecules or cells
(Wang et al., 1993), microfluidics (Goy et al., 2019), tissue engineering
(Drury & Mooney, 2003), food industry (Andrade Batista et al., 2018),
etc. The study of the characterization of the hydrogel structure is
therefore very important and advantageous in all the mentioned areas.
Knowledge of the properties of polymers and the resulting hydrogels, as
well as the response of hydrogel properties to the method of preparation,
polymer concentration and concentration of crosslinking agent, can
significantly contribute to the development of new hydrogel systems and
increase the practical value (Kopaˇc et al., 2020).
The hydrogel structure is formed when enough polymer chains are
interconnected (in crosslink points) to create a hydrogel network that
begins to swell due to hydrophilic nature (Ahmed, 2015). Therefore, the
crosslink density is a major factor in the design of hydrogels with the
desired properties. Modeling of controlled drug release from hydrogels
(drug delivery systems) has been the subject of considerable research
over the last 50 years (Manga & Jha, 2017). However, significantly
fewer models have been developed to predict mechanical hydrogel
properties such as crosslink density and shear modulus. To date, the only
known mathematical models for predicting crosslink density with
respect to the properties of constituent polymers are Peppas-Merrill
equation Eq. (A.1) in Appendix A (Carr & Peppas, 2009), which is a
modification of the Flory-Rehner equation Eq. (A.2) in Appendix A
(Bruck, 1961). The models describe the mixing of polymer and liquid
molecules according to the theory of equilibrium swelling due to the
crosslink density. They are based on the Flory-Rehner theory, which
specifies a change in free energy when a polymer gel swells (Bruck,
1961; Carr & Peppas, 2009). Eq. (A.1) and (A.2) in Appendix A only
apply to simple solvent-swellable polymer systems. On the other hand,
for more sophisticated polymer systems, it is often difficult to determine
all the necessary parameters in Eq. (A.1) and (A.2) in Appendix A,
especially the Flory parameter, reflecting the need for more recent
adaptations.
Single polymer hydrogels have been well studied and are already
being developed for practical use (Das & Pal, 2015). However, the
* Corresponding author.
E-mail address: (M. Krajnc).
/>Received 1 September 2021; Received in revised form 29 October 2021; Accepted 11 November 2021
Available online 15 November 2021
0144-8617/© 2021 The Authors. Published by Elsevier Ltd. This is an open access article under the CC BY license ( />
T. Kopaˇc et al.
Carbohydrate Polymers 277 (2022) 118895
development of delivery systems for many applications nowadays re
quires careful planning of the desired properties of the product. In order
to increase the various properties to achieve the desired properties of the
target application, the current trend focuses on the preparation of
hydrogel mixtures of at least two polymers. By mixing the basic poly
mers, hydrogen, van der Waals and electrostatic interactions are formed
between the polymer chains, which increase the crosslink density and
impart the viscoelastic and thixotropic properties to the resulting com
plex (Liang et al., 2019) that are unique characteristic of hydrogel sys
tems (Liang et al., 2020). This creates a rheological synergism between
the basic polymers that enhances the properties of the constituent
polymers that do not form the three-dimensional (3D) hydrogel struc
ture. To even further extend the hydrogel properties, different cross
linking agents have been added to complex systems consisting of
mixtures of different polymers. The mathematical description of cross
link density in such chemically or ionically crosslinked complex polymer
networks is therefore difficult to be described by Eq. (A.1) and (A.2) in
Appendix A. Another non-ideal feature of hydrogels, which is not
considered in the equation Peppas-Merrill, is spatial gel inhomogeneity,
as hydrogels always exhibit an inhomogeneous crosslink density distri
bution (Abrami et al., 2018; Fanesi et al., 2018). While crosslink density
of hydrogels can be described by rheological measurements, the gel
inhomogeneity can be effectively determined by LF-NMR analysis
(Fanesi et al., 2018).
Accordingly, in this work, the combined use of rheology and LF-NMR
is exploited to describe the structural properties of hydrogels giving the
necessary fundamentals for mathematical model development. The
mechanical properties of different hydrogel systems based on TEMPO
nanocellulose (TOCNF), sodium alginate (ALG), scleroglucan (SCLG)
and Laponite (LAP) were tested. The rheological oscillatory tests were
performed to study polymer-polymer interactions (ionic, hydrogen, and
other electrostatic interactions, etc.) which are the main factor for
hydrogel to crosslink and to form a hydrogel network (3D structure).
Following that, it is recommended to know the structural formula
(Scheme 1) of TOCNF (Isogai et al., 2011; Liang et al., 2020), ALG
(Homayouni et al., 2007), SCLG (Coviello et al., 2005) and LAP (Ruzicka
& Zaccarelli, 2011) with special emphasis on substituent groups in order
to understand the possible formation of chemical bonds in a process of
gel formation. Based on these results, we hypothesize that the mathe
matical model can successfully predict crosslink density by knowing
possible polymer-polymer interactions associated with the selected
polymer and crosslinker used.
ALG and TOCNF are anionic biopolymers which, in presence of
divalent cations, form strong ionic interactions due to carboxyl pendant
groups on the surface of polymer. Ionic bonds are significantly stronger
than hydrogen and other electrostatic forces in hydrogel network so that
ionic bonds play a pivotal role in determination of crosslink density in
most cases. On the other hand, SCLG and TOCNF single polymer
hydrogel systems (in absence of crosslinking agent) predominantly form
hydrogen interactions between polymer chains. Therefore, it is assumed
that hydrogen and electrostatic interactions predominantly determine
the viscoelastic properties of hydrogel structures even at low concen
trations of ionic bonds. In the end, LAP mostly forms electrostatic in
teractions (Park et al., 2020) which is the main reason why it has
important effect on crosslink density in mixtures with anionic polymers.
In the end, the combined use of rheology and LF-NMR enables under
standing the polymer-polymer interactions in hydrogel network, which
were exploited to develop a new equation for calculation the crosslink
density of complex hydrogel systems.
2. Experimental
2.1. Materials
The TEMPO oxidized nanofibrillated cellulose, a linear poly
saccharide composed of anhydroglucose repeating units linked by
β-(1–4) glycosidic bonds (French, 2017), was purchased from The Pro
cess Development Centre, University of Maine (UMaine PDC), USA.
According to specifications given by the producer, the material
[(C6H10O5)x(C6H9O4COONa)y] is characterized by a carboxylation level
of 0.2–2 mmol/g solids, which was experimentally determined in the
literature (Kopaˇc et al., 2021) at 1.2 mmol/g, and a pKa of substituent
group at 3.9. The fiber dimensions are classified between 20 and 50 nm
in width and lengths of up to several microns. The material was pur
chased in freeze-dried powder with a density of 1.5 g/cm3, which forms
a gel structure in water (1–3 wt%) with a density of 1.0 g/cm3.
Sodium alginate, a polysaccharide made up of high α-L-guluronic acid
(G) content ~70% and (1–4)-linked β-d-mannuronic acid (M) monomers
with molecular weight of 20–60 kDa, were supplied by Sigma-Aldrich
(St. Louis, USA).
Scleroglucan Actigum CS 11 was purchased from Cargill France SAS,
France. The structure consists of the main chain of (1,3)-linked β-Dglucopyranosyl units, bearing a single β-D-glucopyranosyl unit-linked
(1,6). The supplier provides 99%min purity, and the average molecu
lar weight Mw is 1.2⋅106.
Laponite XLG was provided by BYK-Chemie GmbH, Germany. Ac
cording to the supplier specifications, it is a synthetic layered silicate
with a low heavy metals content, it is insoluble in water but hydrates and
swells giving clear and colorless colloidal dispersions in water. At con
centrations of 2 wt% or greater in water, highly thixotropic gels are
obtained. It obtains a high surface area (BET) of 800 m2/g. Laponite
nanoparticles are defined as disk-shaped crystals with an average
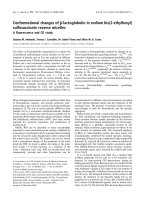
Scheme 1. Chemical structures of the alginate, TEMPO nanocellulose, scleroglucan and Laponite.
2
T. Kopaˇc et al.
Carbohydrate Polymers 277 (2022) 118895
diameter of 30 nm and a thickness of 1 nm.
Calcium chloride was as received from Merck (Darmstadt, Germany)
and sodium azide (NaN3, an assay of ≥99.5%) was supplied by SigmaAldrich (St. Louis, USA).
where Ge and Gk are Maxwell's elements spring constants.
2.3.2. LF-NMR measurements
Typically, LF-NMR characterization of polymeric networks can be
performed by looking at the magnetic relaxation of hydrogen belonging
to polymeric chains, as nicely documented by Saalwachter (Saal
wachter, 2003; Saalwachter, 2007; Saalwachter et al., 2013; Valentın
et al., 2009). Alternatively, it is possible recording the relaxation of the
hydrogen belonging to the solvent swelling the polymeric network as
performed by other authors (Abrami et al., 2014; Abrami et al., 2019;
Brownstein & Tarr, 1979; Chui et al., 1995; Jaeger et al., 2010; Li et al.,
2015; Li et al., 2016; Scherer, 1994). While in the first case the use of
deuterated solvents is mandatory to suppress the relaxation of solvent
hydrogen (which, typically, in hydrogels represent the majority of sys
tem hydrogen (up to 99.5%)), in the second case, non-deuterated sol
vents have to be used. Indeed, this second approach aims to evaluate the
effect of polymeric chains on the magnetic relaxation of solvent
hydrogen (Chui et al., 1995; Scherer, 1994). In this paper, we decided to
follow the second strategy to avoid the use of expensive deuterated
solvents. All characterizations were performed at 25 ◦ C by means of a
Bruker Minispec mq20 (0.47 T, 20 MHz, Germany). The determination
of the average water protons transverse (spin-spin) relaxation time in
side the samples (T2m) was performed according to the CPMG
(Carr–Purcell–Meiboom–Gill) (Meiboom & Gill, 1958) sequence {90◦
[-τ-180◦ -τ (echo)]n-TR} with a 8.36 μs wide 90◦ pulse, τ = 0.25 ms, and
TR (sequences repetition rate) equal to 10 s.
LF-NMR characterization implies the introduction of a 1–2 mL of
blend in NMR tube, then analysis proceeds and the output consist in the
magnetization decay (I(t)) due to the magnetic relaxation of hydrogens
belonging to water molecules contained in the sample. Then, I(t) is fitted
by means of a sum of decaying exponentials, each one characterized by a
different time decay constant (T2i) and weight (Ai) (Abrami et al., 2018;
Fanesi et al., 2018):
∑m
I(t) =
Ai e(− t/T2i )
(4)
i=1
2.2. Hydrogel samples preparation
Single hydrogel systems (only one type of biopolymer content) were
prepared by dispersing constituent biopolymer in demineralized water
at concentrations of 1–3 wt%. The water contained 0.02 wt% sodium
azide to prevent eventual microbiological contamination. The disper
sion was stirred for 2 h on a propeller stirrer at max 500 rpm. The
dispersion was then exposed to an ultrasonic bath for 1 h to achieve
better dispersion of solid particles. After sonication, stirring was pro
vided at 750 rpm for 12 h. The prepared constituent biopolymer dis
persions were kept in the fridge at a temperature of 4.2 ◦ C for 15 days to
establish typical 3D hydrogel structure and to avoid the effect of aging
ˇ
(according to the studies in (Lapasin et al., 2017; Sebenik
et al., 2019)).
Single hydrogel systems were blended in different weight ratios
(from 0.9 to 0.1) on a four-blade propeller stirrer for a further 2 h
mixing. Single hydrogel blends were subsequently crosslinked by linking
the carboxyl groups of anionic polymers via calcium ions. In this case,
the prepared samples are denoted as complex (interpenetrated) hydro
gel systems. Blends of single hydrogels were simply poured into a 3D
printed mold of the same dimensions as the measuring plate on the
rheometer (diameter of 5 cm and thickness of 1 mm). In the case of
complex hydrogel systems, samples were further on sprayed (to achieve
uniform crosslinker distribution over the specimen) with an aqueous
solution of calcium chloride in various concentrations (data are avail
able in Table S2). The volume of added crosslinking agent solution was
equal to the volume of the hydrogel blends. The prepared complex
neutral and anionic biopolymer-based hydrogel systems were main
tained in a refrigerator at 4.2 ◦ C for 24 h to establish the final hydrogel
structure (time required for participation of all Ca2+ ions in crosslinking
process). The list of produced systems can be seen in Table S2.
The set of all the decay constants forms the decay spectrum or
transverse-relaxation-time distribution (Ai,T2i). Details of Eq. (4) fitting
to experimental data are given in Supporting Materials. On the basis of
Eq. (4), we can define the average value of the relaxation time (T2m) and
the average value of its inverse (1/T2)m by (Abrami et al., 2018; Fanesi
et al., 2018):
/
/
( )
∑m
∑m
∑m
1
T2m =
A
T
A
;
A
=
100A
A
m
i 2i
i
i%
i
i
i=1
i=1
i=1
T2
/
(5)
∑m
∑m
(A
A
=
i /T2i )
i
i=1
i=1
2.3. Characterization
2.3.1. Rheological measurements
Rheological measurements were performed on an Anton Paar Phys
ica MCR 301 rheometer at a temperature of 25 ◦ C. The measuring
equipment used was a crosshatched plate with a diameter of 50 mm
(PP50/P2). Samples were prepared to correspond to a thickness of 1 ±
0.1 mm between the plates. Rheological measurements include oscilla
tory (amplitude and frequency) tests. Amplitude tests were performed at
constant oscillation frequency 1 Hz in order to determine the linear
viscoelastic range within which frequency tests were performed (at a
constant strain of 0.1% (Lundahl et al., 2018)). The oscillation fre
quencies varied from 100 to 0.01 Hz. The results of frequency tests
called mechanical spectra were fitted with generalized Maxwell model:
′
G = Ge +
′
G′ =
∑n
∑n
i=1 1
Gi λ2i ω2
+ λ2i ω2
i=1 1
Gi λi ω
+ λ2i ω2
while T2m differs from 1/(1/T2)m, we found the existence of a strong (r
= 0.982, p < 10− 4) linear correlation (T2m (ms) = (0.985 ± 0.01)*1/(1/
T2)m) + (26.7 ± 4.7)) between T2m and 1/(1/T2)m referring to our 90
systems.
LF-NMR measures the spin-spin relaxation time (T2m) of the water
hydrogen present in a liquid solution. T2m is a very useful parameter to
characterize soft materials. Indeed, T2m value is inversely proportional
to solid concentration (polymer, nanoparticles, nanofibers) and it also
depends on the spatial organization of the solid fraction. Indeed, as
water molecules near to solid surface relax faster than far ones (surface
behaves as a magnetization absorber due to presence of impurities), T2m
is affected by the characteristics of the three-dimensional network such
as the mesh size (Abrami et al., 2018; Fanesi et al., 2018).
As reported in the introduction, hydrogels always exhibit an inho
mogeneous crosslink density distribution which is reflected in a mesh
size distribution inside the network. In addition, the mesh size distri
bution (and consequently the crosslink density distribution) can be
determined by substituting the average relaxation time T2m with the
(1)
(2)
where Ge is the equilibrium modulus, Gi are Maxwell elements spring
constant which determine relaxation modules, λi is the corresponding
relaxation time of the ith Maxwell element, n is the number of considered
Maxwell elements and ω is frequency. Furthermore, the shear modulus G
can be estimated from the sum of the Maxwell elastic elements:
n
∑
G=
Gk + Ge
(3)
k=1
3
T. Kopaˇc et al.
Carbohydrate Polymers 277 (2022) 118895
individual relaxation time T2i (from the relaxation spectrum of the
hydrogel sample giving T2m) in Eq. (6). As for all our samples fast
diffusion conditions (Brownstein & Tarr, 1979) are met and the com
bined effect on (1/T2)m of the internal magnetic field gradient ΔG (<
102 T/m) and the water self-diffusion coefficient D (2.5 × 10− 9 m2/s) is
negligible (≈ 0.003% of 1/T2,H2O), the determination of the (average)
hydrogel network mesh size, ε, via LF-NMR is provided by Eq. (6)
(Abrami et al., 2018; Coates et al., 1999) (see further comments on Eq.
(6) in Appendix B).
( )
1
1
2M
(6)
=
+ √̅̅̅̅̅̅̅̅̅̅̅̅̅
T2 m T2,H2 O ε 1− 0.58φp
where Nhyd is the amount of hydroxyl content on the surface per gram of
dry polymer [mmol/g] and can be calculated mathematically using the
same procedure as presented by Ho et al. (Ho et al., 2011). Furthermore,
mp and mp0 are the mass concentration of dry polymer in the solvent and
a minimum mass concentration of polymer with the ability of hydrogel
formation [g/m3]. The lowest concentration of polymer that still forms
the hydrogel mp0 can be determined experimentally (as in the article
(Kopaˇc et al., 2020)) or as adopted from the literature. The last
parameter in Eq. (10) is the hydrogen bonds functionality affinity ahyd
[/] which defines the contribution of hydrogen bonds to the formation of
a hydrogel network (the ability to form crosslinking points). As reported
earlier, different interactions can form crosslinking points. Hydrogen
interactions are the most common but are much weaker than ionic or
covalent bonds. Therefore, the effect of hydrogen interactions is often
negligible in the case of ionic and covalent crosslinking. What is more,
the hydrogen bonds are only 197 pm long, making it impossible for all
the hydroxyl groups on the polymer chains to find interaction together.
The effect of hydrogen bond strength and functionality affinity is
described by the parameter ahyd, which was proved to be constant for all
hydrogel systems with hydrogen interactions when the mechanical
properties of gels are stable (final gels properties after the process of
aging).
3πφp
where T2,H2O is the relaxation time of free water protons (3000 ms at 25
C and 20 MHz), φp is polymer volume fraction and M is relaxivity,
dimensionally a velocity (length/time), that reflects the effect of poly
meric chains on the water protons relaxation. Empirical parameter M
can be determined by using the ε from the rheological measurements
(Eq. (7)) or new developed mathematical model (Eq. (12)) considering
correlation between crosslink density ρx and ε (Eq. (8)):
◦
ρx =
G
RT
(
φp
φp0
)2/3
√̅̅̅̅̅̅̅̅̅̅̅̅̅
6
3
ε=
πρx NA
(7)
3.1.2. Ionically crosslinked hydrogel systems based on a single polymer
containing carboxyl groups that form ionic interactions between polymers
chains
The crosslink density of ionically crosslinked hydrogels depends
predominant on the number of carboxyl groups on the surface of the
polymer chains and the concentration of ionic crosslinking agent. The
modification of Eq. (9) for ionically crosslinked hydrogels is shown in
our previous study (Kopaˇc et al., 2021):
(8)
where G is shear modulus from Eq. (3), R is the universal gas con
stant, T is the temperature in K, φp0 and φp are polymer volume fraction
in the crosslinked conditions (reference conditions) and rheological
measurement conditions (the gel could undergo swelling or shrink
before the analysis) while NA is the Avogadro number. The last term (φp/
φp0) in Eq. (7) should in most cases be equal to 1. However, it sometimes
happens (especially in the case of hydrogels with a high crosslink density
- e.g., Ca2+ ions concentration over 1%) that due to sample compression
before measurement on the rheometer the hydrogel loses some water,
which changes the crosslink density in the crosslinked conditions.
ρx,ion =
3.1. Models to describe crosslink density of hydrogels
To simplify somewhat the characterization of the hydrogel network,
we have developed a mathematical model to predict the crosslink den
sity (ρx) in complex hydrogel systems (mixtures of different polymers
with the addition of crosslinking agents). The model is based on the
amount of substituent groups of the polymers that can form hydrogen,
ionic, electrostatic, and other covalent interactions between polymer
chains, and thus create crosslinking points:
number of moles of crosslinks N mp
=
volume of hydrogel
2
aion
x
(11)
where Nion is the amount of carboxyl content on the surface per gram of
dry polymer [mmol/g] that participate in the crosslinking process (e.g.
in ALG, only α-L-guluronic acid (70% content) is able to efficiently bind
the Ca2+ crosslinker) and can usually be taken from the manufacturer's
specification or determined experimentally by conductometric titration
(Kopaˇc et al., 2021), and x is the crosslinker concentration [wt%]. The
aion is the functionality affinity [wt%] of the ionic crosslinking agent
which refers to the tendency of a crosslinking agent ion (Ca2+ in our
case) to create a connection (i.e., crosslink point) between two polymer
chains (via carboxyl groups in our case). The characteristic ion-binding
properties with the affinity for divalent ions increasing in the order of
Mg2+ ≪ Ca2+ ≪ Sr2+ ≪ Ba2+ which means the aion hypothetically de
creases in the same way. The development of Eq. (11) with the detailed
discussion on the determination of aion is presented in our previous
studies (Kopaˇc et al., 2020; Kopaˇc et al., 2021). The aion value of calcium
ions as crosslinking agents was determined to be 0.55 wt%.
3. Results and discussion
ρx,max =
Nion mp −
e
2
(9)
3.1.3. Complex (ionically crosslinked) hydrogel systems based on a mixture
of different polymers (simultaneous effect of hydrogen bonds and ionic
interactions on crosslink density determination)
Eqs. (10) and (11) apply to hydrogel systems based on single poly
mer. A mathematical model for predicting the crosslink density of
complex ionically crosslinked hydrogel systems based on a mixture of
different polymers was developed using Eqs. (10) and (11) simulta
neously. Therefore, Eq. (12) is a general mathematical model for
determining the crosslink density of all hydrogel systems as a function of
the type and concentration of polymers and crosslinking agents:
(
)
n
n
∑
∑
Nhyd,i mp,i − mp0,i Xhyd,i
Nion,i mp,i Xion,i − aion
ρx =
(12)
e x +
ahyd
2
2
i=0
i=0
where N is substituent groups content (OH, COOH, NH2, etc.) defined
per gram of dry polymer [mmol/g] (two substituent groups can form one
crosslink point) and mp is the mass concentration of dry polymer in the
solvent [g/m3]. Eq. (9) represents the (theoretical) maximum value of
crosslink density that can be achieved in particular hydrogel system.
3.1.1. Single polymer systems giving origin to hydrogels relaying on interchains hydrogen bonds
Considering a single-polymer hydrogel system crosslinked by
hydrogen interactions between polymer chains (via OH groups), Eq. (9)
is modified accordingly:
(
)
Nhyd mp − mp0
ahyd
ρx,hyd =
(10)
2
4
T. Kopaˇc et al.
Carbohydrate Polymers 277 (2022) 118895
where i and n are particular polymer and the number of all polymers in
the hydrogel system, respectively, and Xion,i is the mass fraction of
polymer i in the hydrogel system. All other terms in the model are the
same as described under Eqs. (10) and (11) for a particular polymer i in
the hydrogel system. In the end, ahyd is constant for all systems with
hydrogen interactions, and aion is a property of the ionic crosslinking
agent in the hydrogel.
3.2. Rheological characterization of hydrogels and verification of
developed mathematical model based on polymer-polymer interactions in
hydrogel network
The mechanical spectra are concentrated on the frequency depen
dence of the storage (G') and loss (G") moduli on the angular frequency,
with the lines showing the Maxwell-Wiechert model predictions (Eqs.
(1) and (2)). The shear moduli G (Table S2) were determined by the sum
of Maxwell's elastic elements Ge and Gk (Eq. (3)) (in the same way as in
(Kopaˇc et al., 2020)). Moreover, these data are used to determine the
crosslink density (Eq. (7)) and the average mesh size (Eq. (8)) of the
hydrogel network. In parallel with the model verification, the influence
of the polymer-polymer interaction effect on the viscoelastic behavior,
the crosslink density and the mesh size of the hydrogel network is
investigated in detail.
The various hydrogel systems were prepared at different concen
tration (1–3 wt%) of the single polymer. This is the range where the most
significant changes in the structure of the hydrogel network occur, while
at polymer concentration up to 1 wt%, the hydrogels are weaker or do
ˇ
not even express the typical 3D structure (Lapasin et al., 2017; Sebenik
Fig. 1. Mechanical spectra of single polymer hydrogel. The triangles, circles
and squares represent the 2 wt% of TOCNF, SCLG and LAP hydrogel, respec
tively. Storage modulus G' (filled symbols) and loss modulus G" (empty sym
bols) are presented.
intermolecular hydrogen bonds (Lin & Dufresne, 2014) that play a
pivotal role in the physical and chemical properties of cellulose fibers
(Lundahl et al., 2018). Secondly, SCLG is used as a thickening and sus
pending agent and is suitable for the formulation of hydrogel matrices
for the sustained release of bioactive molecules (Lapasin et al., 2017;
Paolicelli et al., 2017). The structure consists of β-D-glucopyranosyl units
(1,3) linked in the main chain, with three triplex chains holding
hydrogen bonds to each other in the center of the triplex, reflecting in
the higher mechanical properties values as in the case of TOCNF. A
single β-D-glucopyranosyl unit (1,6) linked to the main chain prevents
intermolecular aggregation and polymer precipitation (Tommasina
Coviello et al., 2005; Lapasin et al., 2017). The triplex conformation is
characterized by a high rigidity which is responsible for the peculiar
properties of aqueous SCLG solutions in a wide pH range and also at
relatively high temperatures (Lapasin et al., 2017). The intra- and
intermolecular hydrogen bonds between the main chains of SCLG lead to
the formation of stable rigid triple helices in aqueous solutions (Naz
mabadi et al., 2020). On the other hand, the mechanical properties of
LAP are even higher than of TOCNF and SCLG. The synthetic hectorite
LAP single layer nanoparticles in the form of a rigid, disk-shaped crystals
are usually used as a rheological modifier. LAP disks dispersed and
swollen in aqueous media possess a permanent negative charge on the
faces as a result of dissociation of Na+ ions and diffusion from the stacks.
Due to the protonation of hydroxyl groups, the edge of the particles is
ˇ
slightly positively charged instead (Park et al., 2020; Sebenik
et al.,
2020). The mechanism of formation of the extended thixotropic LAP gel
structure involves the reaction of LAP particles with hydroxide ions in
water, which causes the dissolution of phosphate ions. It is followed by
forming interactions between LAP particles while the sodium ions
diffuse towards the surfaces within the galleries, allowing the formation
of gel structure (Afghah et al., 2020). The addition of Laponite to
biopolymer weak gel could contribute to faster development of final gel
properties (aging), better control of release kinetics and also improve the
ˇ
mechanical properties of the matrix (Sebenik
et al., 2020). According to
literature (Lapasin et al., 2017), the LAP dispersion of less than 0.75 wt%
has the properties of a Newtonian fluid or shows no viscoelastic char
acter, therefore the blending would have only a dilution effect and no
synergistic interaction between LAP nanoparticles and biopolymer
network. Furthermore, the storage time has an even greater effect on
ˇ
sharp sol-gel transition than clay concentration (Sebenik
et al., 2020).
To obtain stable rheological properties, 2 wt% LAP hydrogels were
ˇ
prepared and stored at 4.2 ◦ C for 15 days (as reported in (Sebenik
et al.,
2020)), since aging of SCLG and TOCNF hydrogels affects the rheolog
ical properties. Although aging is essential to reach final hydrogel
properties, a more significant contribution to the hydrogel properties
et al., 2020). Ionic crosslinked hydrogels were further investigated by
adding a calcium ion solution at a maximum concentration of 2 wt%.
Under this condition, it was found that almost all carboxyl groups of
TOCNF are involved in the crosslinking process, so that a higher con
centration of crosslinking agent solution would not (noticeably) affect
the rheological properties of the hydrogels (Kopaˇc et al., 2020; Kopaˇc
et al., 2021).
In order to comprehensively verify the proposed model, complex
hydrogel systems were prepared, which can be usefully classified into
four groups: (i) equivalent blends of the constituent biopolymers with
different concentrations (1–3 wt%) without the addition of crosslinking
agent are shown in Fig. 2 (concentration dependence), (ii) blends of 2 wt
% constituent biopolymers in different weight ratios (from 90 to 10 wt%
of each biopolymer - presented in different colors) are illustrated in
Fig. 3 (fraction dependence), (iii) the blends from (ii) were crosslinked
by spraying a 2 wt% solution of calcium ions in the same volume ratio to
the mixtures, where Fig. 4 shows the results of a constant crosslinker,
and (iv) equivalent blends of constituent biopolymers crosslinked by
spraying a solution of calcium ions (colors represent different concen
trations of calcium ion solution ranging from 0.17 to 2 wt%) in the same
volume ratio to the mixtures are shown in Fig. 5 (different crosslinker).
In addition to the complex hydrogel mixtures, the results of the con
stituent biopolymers are also shown in Fig. 1. The detailed rheological
characterization of the single constituent biopolymer dispersions
(TOCNF, SCLG and LAP) can be found in the literature (Lapasin et al.,
ˇ
2017; Sebenik
et al., 2019, 2020).
3.2.1. Single polymer hydrogel
Single polymer hydrogels based on the constituent biopolymers
(TOCNF, ALG and SCLG) and LAP (clay) exhibit a pronounced visco
elastic behavior. For reference, 2 wt% of TOCNF, SCLG and LAP without
the addition of crosslinking agent (ALG is reasonably not included) are
presented showing increased viscoelastic behavior (G' and G") from
TOCNF, over SCLG to LAP hydrogel samples (Fig. 1). Accordingly, the
TOCNF forms the hydrogel structure due to the presence of three hy
droxyl groups on each β-(1–4)-glucopyranosyl unit (Klemm et al., 2011;
L. Liang et al., 2020), which contributes to the formation of intra- and
5
T. Kopaˇc et al.
Carbohydrate Polymers 277 (2022) 118895
has biopolymer concentration. At a concentration of 1–3 wt% SCLG and
TOCNF, the prepared hydrogels (without crosslinker) exhibit a stable
network structure when stored for 15 days (already reported in (Lapasin
ˇ
et al., 2017; Sebenik
et al., 2019)). On the opposite, ALG, a water-soluble
linear copolymer composed of (1 → 4)-linked α-L-guluronic (G) and β-Dmannuronic (M) residues of varying sequence, only forms a hydrogel
structure (high mechanical properties) in the presence of divalent cat
ions (e.g. Ca2+) (Hecht & Srebnik, 2016).
polymer hydrogel properties from Section 3.1. as reference). The mix
tures were prepared in mass fractions of both biopolymers from 0.9 to
0.1 (Fig. 3). Accordingly, 2 wt% SCLG/TOCNF (Fig. 3A) and SCLG/ALG
(Fig. 3C) blends implies the G' and G" increase, whereas the addition of
SCLG mainly affects the elastic properties of the hydrogel due to the high
concentration of hydroxyl groups on the surface (4.2 mmol/g) forming
hydrogen interactions. That is confirmed by changing the SCLG with
LAP (Fig. 3B), when, at the low LAP concentration, the hydrogel struc
ture is not developed (green circles) (LAP establishes electrostatic in
teractions, but ALG does not participate in crosslinking due to high
water solubility). The mechanical spectrum reports an increase in G' and
G" moduli at a higher mass fraction of SCLG. The mechanical properties
of the SCLG/TOCNF are more similar to the properties of the single SCLG
hydrogel, but at the same time, the G' and G" increase with the angular
frequency and along these lines express weakness of the mechanical
structures of the hydrogels, which is more a characteristic of the single
TOCNF hydrogel (see Fig. 1). On the other hand, the effect of ALG in
hydrogel systems without crosslinking agent addition is reflected in
weaker mechanical structures, since the presence of ALG in the mixture
does not lead to additional interactions between polymers due to its high
water solubility.
3.2.2. Concentration dependence hydrogel systems
SCLG/TOCNF hydrogel systems were prepared to investigate the
importance and influence of the concentration of the biopolymer on the
final mechanical properties of the hydrogels. The samples were prepared
without the crosslinking agent by blending various (1–3 wt%) concen
trations of SCLG and TOCNF in equal weight ratios (Fig. 2) and subjected
to aging until the final properties were obtained. Both the elastic (G') and
the viscous (G") moduli increase with increasing biopolymer concen
tration, indicating the existence of invisibly small clusters with signifi
cant swelling ability in water. The clusters are formed during the storage
process (aging) of the prepared hydrogels when predominantly
hydrogen, van der Waals and electrostatic repulsive forces begin to
intertwine in the SCLG and TOCNF network structure. During the aging
process, the clusters increase in size, reducing their distance from each
other and further enhancing the noncovalent interactions among them.
After a certain time, the growth of the clusters slows down reaching the
ˇ
final properties of the hydrogel structure (approx. 2 weeks (Sebenik
3.2.4. Fraction dependence of biopolymer blends on complex equally
crosslinked hydrogel systems
Biopolymer blends from Section 3.3 were additionally crosslinked
with 2 wt% calcium ions solution to establish crosslinked hydrogel
systems. The mechanical properties of such systems are shown in Fig. 4.
and depend on the crosslink density resulting from a number of ionic,
hydrogen and other van der Waals interactions. Therefore, G' and G",
and, consequently, the shear moduli G, increase with the increasing
mass fraction of TOCNF or ALG in hydrogel systems (higher carboxylate
level, more ionic interactions during crosslinking and higher crosslink
density). Anionic carboxyl groups give the hydrogel pH responsivity
(Way et al., 2012) (alkaline release trigger) and also allow the control of
˜ o-Maso
´ et al., 2019)
crosslink density (Lin et al., 2012), mesh size (Patin
and flow properties (Kopaˇc et al., 2020) by crosslinking via divalent ions
(Curvello & Garnier, 2020; Xu et al., 2019). The mechanical spectrum
reports a nearly independent influence of angular frequency on G' and G"
for all systems, which confirms the very stable hydrogel network
structure of ionically crosslinked hydrogel systems (the presence of
strong ionic interactions (compared to hydrogen interactions) signifi
cantly increases the shear moduli of crosslinked SCLG/TOCNF
hydrogels).
The rheological properties of non-crosslinked LAP/TOCNF are pre
ˇ
sented in the literature (Sebenik
et al., 2020), although, in this study, the
focus is on the more complex hydrogel structure of ionically crosslinked
TOCNF biopolymer chains. The effects of hydrogen and ionic in
teractions are predominating and fraction dependent on crosslinked
SCLG/TOCNF systems (Fig. 4A). Differently, in the case of crosslinked
LAP/TOCNF systems (Fig. 4B), the effect of hydrogen bonds is lower in
exchange for electrostatic interactions between LAP nanodisks (posi
tively charged edges of particles) and TOCNF fibrils (anionic side
groups). The clay particles of LAP and its aggregated forms are deposited
between the polymer chains of TOCNF, which additionally connect the
polymer nanofibers and strengthens the mechanical properties of
ˇ
hydrogel systems (Lapasin et al., 2017; Sebenik
et al., 2020). The effect
of electrostatic interaction between LAP and TOCNF is evident as the G'
and G" values are significantly higher (Fig. 4B) than in SCLG (nonionic
polymer)/TOCNF based system (Fig. 4A). At higher TOCNF content, the
increase in shear modulus is slowed down due to the high crosslink
density of TOCNF chains, preventing LAP nanoparticles to develop an
extended aggregation structure comparable to the structure of a single
LAP system (Lapasin et al., 2017). Similar conclusions can be reached in
the case of hydrogel systems where TOCNF is replaced with ALG (Fig. 4C
and D). In this case, even more pronounced mechanical properties are
evident due to the higher concentration of carboxyl groups on the ALG
et al., 2019)). TOCNF polymers with modified carboxyl groups on the
surface are an exception, where clusters are also formed during the ionic
or covalent crosslinking process. As it can be seen in Fig. 2, TOCNF
concentration has a less important influence on the mechanical spec
trum. Furthermore, the reduction of both G' and G" clearly displays a
weaker hydrogel structure at low biopolymer concentration. This is also
confirmed by the lower shear moduli G (see Table S2) at lower
biopolymer concentration. As shear modulus is directly proportional to
the crosslink density in the hydrogel network (Fanesi et al., 2018; Kopaˇc
et al., 2020), this is an additional confirmation of the hydrogel network
weakening.
3.2.3. Fraction dependence hydrogel systems
Next, the effect of the mass fraction of different biopolymers on the
mechanical properties of hydrogel mixtures was studied in the case of
blending 2 wt% hydrogels of TOCNF, SCLG, LAP and ALG (see single
Fig. 2. Mechanical spectra of SCLG/TOCNF hydrogel blends without cross
linking agent in equal weight ratio. The different shape of symbols represents
the various concentrations of biopolymer in single polymer hydrogel prepara
tion. Storage modulus G' (filled symbols) and loss modulus G" (empty symbols)
are presented with the addition of model fit Eq. (1) and (2), respectively.
6
T. Kopaˇc et al.
Carbohydrate Polymers 277 (2022) 118895
Fig. 3. Mechanical spectra of 2 wt% SCLG, TOCNF, ALG and LAP hydrogel blends in different weight ratio without crosslinking agent. The colors of the circles
represent the weight ratios of the constituent 2 wt% single polymer hydrogels. Storage modulus G' (filled symbols) and loss modulus G" (empty symbols) are pre
sented. The G' and G" are not reported for samples where x/ALG = 0/100 or 10/90 due to blend solution behavior.
Fig. 4. Mechanical spectra of crosslinked (constant – 2 wt% addition of crosslinking agent solution) 2 wt% SCLG, TOCNF, ALG and LAP hydrogel blends. The colors
of the circles represent the weight ratios of the constituent 2 wt% single polymer hydrogels. Storage modulus G' (filled symbols) and loss modulus G" (empty symbols)
are presented.
surface (2.6 mmol/g) than on TOCNF (1.2 mmol/g). On the other hand,
as evident from Fig. 3B, ALG does not form hydrogen or electrostatic
(with LAP particles) interactions inside polymer network unlike TOCNF
(2.8 mmol/g of hydroxyl groups). By comparing Fig. 4C and D, LAP and
SCLG have almost no effect on the storage modulus when blended with
ALG (the reduction of G' and G" is a consequence of the lower ALG
content–lower carboxylate level). The predominant effect of stronger
ionic interactions is presented in ALG containing hydrogels (the highest
G' and G" values in Fig. 4). At a lower fraction of ALG (below 0.25), the
effect of electrostatic interaction between LAP and calcium alginate
(Fig. 4C) can be detected which was not present in non–crosslinked LAP/
ALG samples (Fig. 3B).
3.2.5. Effect of crosslinking agent concentration on complex hydrogel
systems
To study the effect of crosslinking agent concentration on the me
chanical properties of hydrogel systems, biopolymers were blended in
the 0.5/0.5 weight ratio (see Section 3.2) and additionally crosslinked
with different concentrations of calcium ion solution (0.17–2 wt%) in
the same way as explained in Section 3.2.4. Also, the ionic bonds be
tween the TOCNF or ALG polymer chains formed during the crosslinking
process with calcium ions (Curvello & Garnier, 2020) are predominant
over other interactions. For that reason, there are no major differences in
trend of mechanical properties between the SCLG/TOCNF and LAP/
TOCNF or SCLG/ALG and LAP/ALG hydrogel systems (Fig. 5). However,
the major effect of the crosslinking agent on the mechanical properties
of prepared hydrogel samples is evident. The higher the crosslinking
agent concentration, the more ionic interactions are formed between
7
T. Kopaˇc et al.
Carbohydrate Polymers 277 (2022) 118895
Fig. 5. Mechanical spectra of crosslinked 2 wt% SCLG, TOCNF, ALG and LAP hydrogel blend systems in equivalent weight ratio. The symbols represent the con
centration of the added crosslinking agent solution. Storage modulus G' (filled symbols) and loss modulus G" (empty symbols) are presented.
ALG or TOCNF polymer chains and, consequently, the higher G' and G".
Overall, the G' and G" values of differently crosslinked hydrogels (Fig. 5)
are close to those in Section 3.2.4. (constant crosslinker) (Fig. 4) (pre
dominant effect of ionic interactions). The SCLG/TOCNF system
(Fig. 5A) differs a little bit from the other mixtures as the effect of
crosslinker increase is less evident, at least up to the maximum con
centration explored (2%). As it will be detailed in Section 3.3, this could
be due to a competition between hydrogen bonds, forming between
SCLG and TOCNF, and ionic bonds, mediated by Ca+2, forming between
TOCNF chains. Only when Ca+2 concentration exceeds 1%, we can see
the clear effect of ionic TOCNF-TOCNF interactions that reflects in a
clear increase of G'.
density of gels when mechanical properties are stable and are not
time–dependent (after the aging in the case of non-crosslinked samples).
The fraction dependence on hydrogel systems based on mixing single
polymer hydrogels is presented in Fig. 6B. In this case, the crosslink
density can be calculated in the same way as before taking into account
the mass fraction of polymer in the mixture. As is evident in Fig. 6A, the
ALG does not form hydrogen interactions due to good solubility in water
(discussed in detail in Sections 3.2.1 and 3.2.3). Furthermore, the
crosslink density of ionically crosslinked hydrogels with different mass
fractions of consistent polymers is presented in Fig. 6C and D. The
combined effect of hydrogen and ionic interactions on crosslink density
was calculated by using Eq. (12). However, as previously reported, the
ionic interactions are much stronger than hydrogen interactions, hence
in this case also the approximation in the form Eq. (11) can be used. Not
surprisingly, as also noted in the previous section (Section 3.2.5), the
SCLG-TOCNF system displays an anomalous behavior, at least with
respect to model prediction. Again, the reason for this evidence should
be attributed to the competition between TOCNF-TOCNF Ca+2 mediated
ionic interactions and TOCNF-SCLG hydrogen bonds. Indeed, Fig. 6B
makes clear that in SCLG/TOCNF system, the effect of hydrogen bonding
is considerable, at least with respect to LAP/ALG and SCLG/ALG mix
tures that are characterized by lower crosslink densities. This is, prob
ably, the reason why our model underestimates (see the line over
symbols not under) the experimental data of Fig. 6C and D. The LF-NMR
characterization presented in Section 3.3 also will confirms this
interpretation.
Hydrogel networks are characterized by the interweaving of hydro
philic chains of constituent polymers, which are interconnected by
various interactions (ionic, hydrogen, other electrostatic forces and co
valent bonds) that increase the crosslink density and thus form a char
acteristic three-dimensional structure of hydrogels (Mahinroosta et al.,
2018). The predominant role is played by the type and number of
3.2.6. Verification of developed Eq. (12) for crosslink density calculation of
(complex) hydrogels
After the rheological characterization of different hydrogel systems,
the experimental data of rheological measurements were compared to
theoretically predicted crosslinking densities of the hydrogels with
respect to polymer-polymer interactions (Fig. 6). The agreement be
tween the experimental and calculated values is presented by the parity
plot added in the Supplementary material (Figs. S1–S4). The experi
mentally determined crosslink density was resolved using the shear
modulus in Eq. (7) and used as a verification for proposed Eq. (12). In
addition, please find models for aion and ahyd determination in supple
mentary material (Eqs. C.1–C.3). In Fig. 6A, an excellent match between
model prediction and experimental data can be observed. TOCNF, SCLG
and LAP hydrogels are formed in water due to hydrogen interactions
established between polymer-polymer chains creating a network, which
enables water to diffuse (due to hydrophilicity) in the internal structure.
In this case, where the effect of hydrogen interaction on crosslink den
sity is predominant, the approximation (Eq. (10)) of Eq. (12) can be
used. Additionally, the proposed model predicts the final crosslink
8
T. Kopaˇc et al.
Carbohydrate Polymers 277 (2022) 118895
Fig. 6. Crosslink density of single polymer hydrogel without crosslinking agent (A) (refers to the data shown in Fig. 2), fraction dependence on hydrogel systems
without crosslinking agent (B) (refers to the data shown in Fig. 3), fraction dependence on equally crosslinked hydrogel systems (C) (refers to the data shown in
Fig. 4) and effect of crosslinking agent concentration on complex hydrogel systems (D) (refers to the data shown in Fig. 5). The circles represent the experimental
values (please find Table S2 in Supporting material) adopted by rheological measurements (Figs. 2–5) and lines represent the theoretical values calculated by new
developed Eq. (12) (see also parity plot (Figs. S1–S4) supplemented in Supplementary material).
polymer-polymer interactions that significantly affect hydrogel network
characteristics, rheological (mechanical) properties, crosslink density,
and also the release rate in the case of drug delivery systems. Following
that, the linear dependence of polymer concentration and polymer
fraction of polymers in hydrogel blends on crosslink density is evident in
Figs. 6A–C due to the various concentration of substituent groups
(carboxyl and hydroxyl groups) with a good model prediction.
Hydrogen bonds predominate in SCLG and TOCNF systems without the
addition of a crosslinker (Fig. 6A and B). In such systems, the contri
bution of hydrogen interactions to the hydrogel network depends on the
concentration of the polymer or the mass fractions between the poly
mers in the hydrogel blends (Fig. 6B). On the other hand, the distance
between polymer chains in the hydrogel is spaced apart from each other
so that a hydrogen interaction cannot be created between all the hy
droxyl groups available. According to the literature, the typical length of
a hydrogen bond in water are ≈200–350 pm (Sheu et al., 2003). Polymer
chains are closest to each other at crosslink points, where these links
may take the form of ionic bonds (or covalent bonds in the case of
chemical crosslinking). Obviously, longer distances between the poly
mer chains do not allow the formation of hydrogen bonds. Hydroxyl
groups that do not form hydrogen bonds, due to their hydrophilicity
allow water to diffuse into the hydrogel network (swelling) (Hoare &
Kohane, 2008). Even more, in the case of low carboxylate level, the
hydrogen bonds can be predominated over few ionic interactions
(Fig. 6D). Finally, the shape of particles is not negligible in the formation
of hydrogen bonds, as SCLG has a larger surface area than TOCNF fibers.
The exponential effect of crosslinking agent concentration on cross
link density of hydrogels is illustrated in Fig. 6D. In the low crosslinking
agent concentration range (up to 0.51 wt%), the effect on crosslink
density is linear due to the high concentration of free carboxyl groups in
comparison with calcium ion concentration. At exalted crosslinking
concentrations (above 1 wt%), the number of free carboxyl groups de
creases reaching the limit for each calcium ion to generate crosslink
points. The comparison of the results between systems with and without
crosslinker proves the predominance of ionic bonds over other in
teractions (Section 3.2.5), regardless of the amount of the ionic in
teractions. For example, on the surface of TOCNF the carboxylate level is
1.2 mmol/g (Kopaˇc et al., 2021) and the available quantity of hydroxyl
groups is 2.8 mmol/g (Ho et al., 2011). Theoretically, it is possible that
more than two times more hydrogen bonds are formed between TOCNF
polymer chains than ionic ones. On the other hand, SCLG/TOCNF sys
tems contain even more hydroxyl groups due to the addition of SCLG
(4.2 mmol/g hydroxyl groups on the surface). However, ionic bonds (up
to 2000 kJ/mol (Mehandzhiyski et al., 2015)) formed are stronger than
hydrogen (≈20 kJ/mol (Sheu et al., 2003)), which is why they have a
predominant effect despite the numerical domination of hydrogen
bonds. Therefore, the concentration of the crosslinker and the polymer
containing functional groups susceptible to ionic crosslinking is crucial
for the controlled design of ionically crosslinked hydrogels with the
desired properties.
Not to mention only ionic and hydrogen interactions, other electro
static interactions are formed between LAP particles having negative
ˇ
and positive charges on the surface (Ruzicka & Zaccarelli, 2011; Sebenik
et al., 2020) and carboxyl groups (negative charge) on TOCNF or ALG
chains that do not participate in ionic crosslinking (higher crosslinking
agent concentration, lower content of free carboxyl groups and conse
quently reducing the number of electrostatic interactions). The content
of electrostatic interactions is consequently controlled by the concen
tration of polymers with ionic functional groups or the concentration of
particles with different charges (e.q. LAP), as well as by the concentra
tion of the crosslinker. Therefore, electrostatic interactions have a sig
nificant effect on the mechanical properties and crosslink density of
9
T. Kopaˇc et al.
Carbohydrate Polymers 277 (2022) 118895
hydrogels with a low concentration of ionic crosslinker (up to 0.34 wt%)
as well discussed in Section 3.2.5. At higher crosslinking agent con
centrations, less free ionic functional groups are present on the surface of
the hydrogel, so the effect of electrostatic interactions is less obvious
(but still not insignificant) (see Fig. 4).
To conclude, the developed Eq. (12) based on polymer-polymer
interaction in hydrogel network enables to satisfactorily calculate the
crosslink density of gels. The model was verified based on complex
hydrogel systems which are formed due to the predominant effect of
ionic and hydrogen interaction. The presented study is based on
biopolymer in absence of toxic chemical crosslinking agents having a
great potential to be used for hydrogel design in different biomedical
and biopharmaceutical applications. Furthermore, the principle of
crosslink density calculation based on chemically crosslinked hydrogel
should be the same, with the determination of crosslinking agent func
tionality affinity (achem) in the same way as presented in our previous
article (Kopaˇc et al., 2020).
a crosslinker or, simply, the spontaneous formation of physical in
teractions (such as hydrogen bonds), obliges chains to modify their
relative position in the gel volume so that, for example, original chains
bundles can be disrupted to give rise to a different three-dimensional
organization (Abrami et al., 2018; Fanesi et al., 2018). This is the
reason why, typically, the sol-gel transition implies the reduction of T2m
(Abrami et al., 2019).
From Table S2 it immediately appears that the 2% ALG system is
characterized by a high relaxation time ≈1800 ms (free water at 25 ◦ C
T2 = 2500 ms) and only one component of the relaxation spectrum (T21),
this witnessing that we are dealing with a homogeneous solution. On the
contrary, 2% TOCNF and 2% SCLG systems are characterized by lower
T2m and this supports the idea that hydrogen bonds play an important
role in the nano-structure organization of TOCNF-SCLG system that,
indeed, is a gel as witnessed by Fig. 3A. While TOCNF presents almost
one T2 (homogeneous solution), 2% SCLG presents two T2i, indicating
the presence of an inhomogeneous system where rich polymer clusters
are embedded in a continuous phase characterized by a lower polymer
concentration. A clear difference existing among single polymer samples
underlines that 2% SCLG is not a homogeneous solution and sampling
can affect the measurement due to sample heterogeneity.
Fig. 7 reports the average relaxation times (black columns) of water
protons, while the relaxation time distribution for each sample as a nonhomogeneity indicator is given in Supplementary material (Figs.
S5–S19). For reference, the theoretically calculated mesh size, calcu
lated from Eq. (8), based on newly developed Eq. (12), and experi
mentally determined mesh size of hydrogels based on mechanical
spectra results (the shear modulus from Eq. (3) were incorporated in Eq.
(7) and (8)) are illustrated in Fig. 7 as green and red, respectively.
Additionally, average relaxation times were fitted by Eq. (6) to deter
mine M as the fitting parameter for the particular hydrogel system.
3.3. LF-NMR characterization of hydrogel networks
LF-NMR measurements were performed as an interpretation and
validity supplement to the developed model equation Eq. (12), which
predicts the crosslink density of hydrogels based on polymer-polymer
interactions. LF-NMR characterization of gels relies on the effect of
solid surfaces (polymer chains, etc.) on the magnetic relaxation process
of water hydrogens subjected to a sudden variation of an external
magnetic field (Abrami et al., 2018). Indeed, different spatial organi
zations of polymeric chains imply different values of the ratio between
the solid surface (S) in contact with water molecules present in the
system (hydrogel) volume (V). This, in turn, reflects in a variation of the
mean relaxation time T2m of water protons. In particular, the addition of
Fig. 7. LF-NMR characterization of hydrogel network. Columns represent the average relaxation time of water protons in different hydrogels, symbols represent the
average mesh size of hydrogel determined by rheological measurements (red circles) and the new developed model in Eq. (12) (green circles). M is Eq. (6) fitting
parameter known as relaxivity. Due to the display clarity, 2% Ca2+ is not shown in figures, but could be found in a numerical form in SI, Table S2.
10
T. Kopaˇc et al.
Carbohydrate Polymers 277 (2022) 118895
Fitting parameter M is characteristic for each system allowing to
determine the mesh size on the basis of relaxation times from LF-NMR
analysis (Kirchhof et al., 2015; Maestri et al., 2017). Interestingly the
M values found in this paper are similar to those found by Coviello and
co-workers who dealt with similar hydrogels (Coviello et al., 2013).
The LAP-contained systems (Fig. 7A–C) appeared fragile and
discontinuous. The LAP decreases enhanced sample heterogeneity as the
number of T2i increased (see LF-NMR distribution times–supplement to
Fig. 7 and Fig. 8 in supplementary material). Moreover, in systems
without the addition of Ca2+ (Fig. 7A and D), the increase of ALG
fraction implied an increase of T2m. Upon ALG fraction increase, samples
moved from soft gel to viscous solution. Indeed, as shown in Fig. 7D, T2m
grew with SCLG fraction reduction from 90:10 to 25:75. However, it is
worth to underline that all blends appeared very inhomogeneous.
Additionally, from Fig. 7C, F and G it is obvious that divalent ions
provoked the well-known crosslinks among ALG chains (egg-box junc
tions) even at the lower Ca2+ addition. Ca2+ concentration increase
(from 0.17% to 2%) implies improving the strength of interactions, gel
homogeneity (only one T2i was necessary to describe hydrogens relax
ation) and T2m reduction. It is important to remind that, in all systems
involving the ionotropic gelation of alginate, the evaluation of T2m has
been performed without considering the first relaxation time (T21) if its
value was >1300 ms. Indeed, a so high relaxation time can be only
associated to water that is out of the polymeric network. The presence of
external water is due to well-known syneresis effect implying a slow,
time dependent, hydrogel de-swelling resulting in an exudation of liq
uids. Both alginate molecular weight and elastic segment flexibility play
an important role in determining the entity of this phenomenon (Dra
geta et al., 2001).
As the negatively charged ALG chains are prone to rapidly interact
with divalent cations, it is not surprising that T2m decreased with the
increment of ALG fraction (Fig. 7B and E). This also means that the
polymeric network is characterized by gradually smaller meshes (T22
reduces). For Ca2+ of 0.17%, the sample looks like a viscous solution and
only one T2 is necessary to describe system magnetic relaxation. From
Ca2+ ≥ 0.26%, samples look like rigid disks. T2m is characterized by an
initial decrease followed by a plateau (Fig. 7C, F and G–I). This is
probably due to the shielding action exerted by LAP or SCLG towards the
ALG or TOCNF Ca2+ interaction. In conclusion, we can presume that the
addition of Ca2+ implies not only an increase of the shear modulus G (as
proved by rheology) but also an appreciable increase of the S/V ratio
implying a reduction of T2m. Thus, in contrast to what happens in the
case of SCLG/TOCNF, the increase in matrix stiffness with Ca2+ results
from an increase in crosslink density (Fig. 8).
While a good trend for the prediction of the crosslink density could
be observed for most samples (Fig. 6), SCLG/TOCNF hydrogel systems
clearly deviate from the crosslink density prediction of the developed
model, as already discussed in Section 3.2.6. An appropriate explanation
for the apparent incongruity can be explained by LF-NMR spectroscopy,
which enabled us to gain an insight into the nanostructure of complex
hydrogel systems constituted by (ionically crosslinked) mixture of
different polymers (Fanesi et al., 2018). Fig. 8A shows that the increase
of TOCNF concentration entailed in an increase of T2m and a blend ho
mogenization, as at a 10:90 ratio (in favour of TOCNF) only one relax
ation time appears, which resembles the situation occurring at pure 2%
TOCNF (Table S2). This evolution could suggest that TOCNF nano-fibrils
presence hinders the formation of the complex and heterogeneous SCLG
network via the establishment of hydrogen bonds between TOCNF nanofibrils and SCLG triple helices. Thus, TOCNF would sequester part of the
SCLG triples helices that, ultimately, would be no longer available for
network building up, this resulting in a weaker and more homogeneous
network. An inspection of Fig. 6B supports this interpretation as it re
veals that the TOCNF-SCLG system gives rise to higher crosslink density
with respect to LAP-ALG and SCLG-ALG mixture. Furthermore, these
considerations are also corroborated by Fig. 8C showing that the addi
tion of Ca2+ has little effect on the blend structure (system without
addition of Ca2+ (0%)) as, regardless of Ca+2 concentration, T2m is
almost constant. In addition, the relative relaxation spectra are similar
each other being characterized by a prevalent T22 (300–500 ms) with A2
ranging from 80 to 100%, i.e., a spectrum not far from sample 0% dis
tribution (see Table S2). The scarce effect of Ca2+ should be due to the
hydrogen bonding interaction arising among SCLG triple helices and
TOCNF nano-fibrils that are no longer so prone to establish Ca+2
mediated ionic bonds. In this light it is worth mentioning that, theo
retically, it is possible that more than two times hydrogen bonds are
formed between TOCNF polymer chains than ionic ones as above dis
cussed. The same argumentations can explain the results of Fig. 8C
where a good comparison between model predictions (Eq. (12)) and
experimental data occurs only for pure systems (SCLG fraction equal to 1
or zero). The fact that the rheological analysis records a variation of the
shear modulus (G) of Fig. 8B and C systems while LF-NMR returns
almost similar magnetic relaxation spectra, could be explained by
supposing that matrix stiffness should not be due to the increase of
crosslink density (moles of crosslinking points per unit volume) but to
the augmentation of polymeric chains stiffness due to their grouping
revealed by LF-NMR (hydrogen bonds among SCLG and TOCNF). Ulti
mately, these considerations underline that rheology and LF-NMR can
see different aspects of a polymeric network: rheology – crosslink den
sity, LF-NMR – chains disposition.
Thus, the combined use of rheology and LF-NMR indicates two
different mechanisms at the basis of the ALG and TOCNF based systems
crosslinking upon Ca2+ addition. The increase of matrix stiffness due to
Ca2+ addition should be due to the increase of crosslink density in the
case of ALG based systems. On the contrary, the formation of stiffer
braided polymeric chains should be the reason for the G increase in
TOCNF based systems.
The inspection of Figs. 7 and 8 reveals that, sometimes, there is not a
very good correlation between ε (determined by means of rheological
measurements – Eq. (7) and (8)) and T2m. The reason for this relies on
the physical principles on which rheology and LF-NMR are based on.
Indeed, while rheology is affected only by elastically active chains (i.e.
those involved in crosslinks), LF-NMR (i.e. T2m) is affected by the
conformation assumed by chains regardless of their enrollment in
crosslinks. Indeed, T2m is proportional to ratio between solvent volume
Fig. 8. LF-NMR characterization of hydrogel network. Columns represent average relaxation time of water protons in particular hydrogel network, symbols represent
an average mesh size of hydrogel network determined by rheological measurements (red circles) and new developed model in Eq. (12) (green circles).
11
T. Kopaˇc et al.
Carbohydrate Polymers 277 (2022) 118895
V (proportional to the number of solvent hydrogen) and the polymer
chains surface S in contact with solvent molecules, proportional to the
fraction of solvent hydrogen in strict contact with polymeric chains (the
so-called bound solvent). This aspect can be clearly seen looking at Eq.
(6) written in a less advanced form (Chui et al., 1995):
√̅̅̅̅̅̅̅̅̅̅̅̅̅̅̅̅̅̅̅̅̅̅
√̅̅̅̅̅̅̅̅̅̅̅̅̅̅̅̅̅̅̅̅̅̅̅̅̅̅̅̅
( )
1 − 0.58φp
1 − 0.58φp
1
1
S V
=ε
+ 2M
ε = rf 3π
m=
T2
T2,H2 O
V S
3πφp
φp
time (T2s) (Chui et al., 1995). Thus, it is reasonable that different system
compositions correspond to different M values as it happens in our
systems (see the red values in Figs. 7 and 8). This is the reason why
different T2m values can be connected to the same mesh size or viceversa.
It is also interesting to observe that despite the low polymer con
centration of our systems, ε turns out to be quite small. This result can be
explained on the basis of the Scherer theory (Scherer, 1994), approxi
mated by Abrami and co-workers (Abrami et al., 2018), that establishes
the relation between ε, φp and the polymeric chain radius rf (each chain
is assumed to be a long cylinder of radius rf) as reported by the last
equation of Eq. (13). In the case of alginate, for example, rf ≈ 0.6 nm
(Amsden, 1998). Setting polymer concentration at 2%, this corre
sponding to φ ≈ 0.012, the last equation of Eq. (13) provides ε ≈ 17 nm,
a value that is not far from what found in this paper. As polymer chains
are very thin, it is possible getting small mesh size also in presence of a
low polymer volume fraction. In addition, similar results were found by
Wisniewska and coworkers (Wisniewska et al., 2018) who studied the
structure of poly(N-isopropylacrylamide-co-acrylic acid) hydrogels.
They found ε = 7–10 nm when polymer mass fraction ranges between
0.6 and 0.8%.
(13)
An example of the different potentiality of rheology and T2m in the
characterization of hydrogels is reported by Marizza and co-workers
(Marizza et al., 2016), who dealt with poly(N-vinyl-2-pyrrolidone)
based hydrogels. Indeed, they noticed that the rheological and LF-NMR
approach provided similar mesh size estimation only when the hydrogel
shear modulus G was sufficiently large (140 Pa). On the contrary, for
smaller G, rheology gave a larger estimation of the average mesh size.
The explanation for this evidence consisted in the presence of dangling
chains (or chains not directly involved in crosslinks) that, being bound
to one end of the network, were elastically inactive and, thus, irrelevant
for the determination of G and ε. Conversely, for LF-NMR (T2m), both
elastically active and inactive chains matter as both of them can affect
the key parameter V/S. As the number of dangling chains can be roughly
connected to the viscous properties of the gel (alias the loss or viscous
modulus G"), Marizza concluded that dangling chains exert a smaller
and smaller effect when G and G' (elastic or storage modulus) increase
with respect to G". In this condition, indeed, the rheological and LF-NMR
approach provided similar ε estimation. A further support to this inter
pretation can be retrieved in the recent work of Descallar and coworkers (Descallar & Shingo Matsukawa, 2020) who studied the
change of network structure in agarose gels by aging. In the last figure of
the paper (Fig. 9), they provide a very interesting representation of the
modification that the agarose network undergoes upon aging. As time
goes on, polymeric chains get together to form a network characterized
by the same crosslink density (or mesh size) but with thicker (and
stronger) fibers. Although authors did not perform a rheological and T2m
characterization of their hydrogels, it is very probable that, upon aging,
T2m increases as S reduces due to chains grouping. At the same time, the
shear modulus G should increase as the fibers section increases, despite
the same crosslink density. These considerations suggest a possible
strategy to get information on the gels network recurring to the com
bined use of rheology and LF-NMR. Indeed, when T2m and ε show the
same trend, we can conclude that a mesh size reduction/increase
occurred as chains unbundle/bundle increased/reduced the number of
chains available to establish crosslinks. On the contrary, when, for
example, ε decreases and T2m is almost constant, we can conclude that
matrix stiffness increase is not really due to the crosslink density in
crease, but due to fibers stiffness increase (due to their bundling) as
depicted in Fig. 9 of Wisniewska and coworkers (Wisniewska et al.,
2018).
Another important consideration descending from Eq. (6) and (13) is
represented by Eq. (14):
√̅̅̅̅̅̅̅̅̅̅̅̅̅
1− 0.58φp
ε
3π φp
1
T2m ∝( ) ∝
(14)
2M
1
T2
4. Conclusions
The new equation (Eq. 12) is proposed for theoretical determination
of the crosslink density of hydrogels according to the concentration of
polymer and crosslinking agents, the mass fraction between polymers
and the concentration of substituent groups on the surface of polymers.
The influence of different chemical bonds and their content on the final
properties of the hydrogel was studied. The polymer-polymer in
teractions in hydrogel network which form the crosslink points was
studied in detail by rheological (mechanical properties) and LF-NMR
characterization (inhomogeneity of hydrogel network). In addition, to
developed Eq. (12), the model to predict the average mesh size of
hydrogel network based on LF-NMR measurements is enriched with the
calculation of relaxivity M for particular hydrogel samples. Finally, the
design of complex hydrogel systems according to the desired properties
is possible, which can be further improved in future research by
considering the contribution of covalent, van der Waals, heterotypic,
hydrophobic, and other electrostatic interactions. The presented study
could significantly shorten the research time and reduce the research
cost in the future design of hydrogels with the desired properties.
CRediT authorship contribution statement
Tilen Kopaˇ
c: Conceptualization, Methodology, Software, Valida
tion, Formal analysis, Investigation, Writing – original draft, Visualiza
tion. Michela Abrami: Validation, Investigation. Mario Grassi:
Software, Validation, Writing – review & editing, Supervision. Aleˇs
Rucˇigaj: Software, Formal analysis, Data curation, Writing – review &
editing, Visualization. Matjaˇ
z Krajnc: Resources, Supervision, Project
administration, Funding acquisition.
Declaration of competing interest
m
The authors declared no conflicts of interest.
Eq. (14) clearly shows that the relation between T2m and ε depends
on the polymer volume fraction φp and on relaxivity M . Thus, even for
constant φp, different M values reflect in different T2m value at fixed ε. M
represents the ratio between the thickness of the bound solvent (i.e., the
thin solvent layer close to the polymeric chain surface that affects the
magnetic relaxation of the bound solvent molecules) and its relaxation
Acknowledgment
The authors acknowledge the financial support from the Slovenian
Research Agency (research core funding no. P2-0191).
12
T. Kopaˇc et al.
Carbohydrate Polymers 277 (2022) 118895
Appendix A. Flory-Rehner and Peppas-Merrill equation
Flory-Rehner equation:
−
[
(
)(
)
1
]
V1
2Mc
ν
ln(1 − ν2 ) + ν2 + χ 1 ν22 =
1−
ν32 − 2
νMc
M
2
(A.1)
where ν2 is the polymer volume fraction, χ 1 is the Flory solvent-polymer interaction parameter, V1 is the molar volume of the solvent, ν is the specific
volume of the polymer, M is the primary molecular mass and Mc is the average molecular mass between crosslinks (Bruck, 1961).
Peppas-Merrill equation:
( )[
]
(
)
ν
ln 1 − ν2,s + ν2,s + χ 1 ν22,s
V1
1
2
[( )
]
=
−
(A.2)
1
Mc Mn
ν2,s
2,s
3 −
ν2,r νν2,r
2ν2,r
where Mn is the number average molecular weight of a linear polymer (one formed without a crosslinking agent), ν2,s and ν2,r are polymer volume
fraction in the swollen and relaxed state, respectively (Carr & Peppas, 2009).
The Mc determine the crosslink density ρx:
ρx =
ρ
(A.3)
Mc
where the ρ is density of hydrogel.
Appendix B. Theoretical mathematical background of Eq. (6)
The origin of Eq. (6) derives from the “magnetization diffusion equation” proposed by Brownstein and Tarr (1979):
∂ρ(r)
= ∇∙(D∙∇ρ(r) ) − θρ(r)
∂t
(B.1)
where t is time, ρ is the magnetic moment density in the xy plane, r is the position vector, D is the water molecules self-diffusion coefficient (m2/s), and
θ is the volume sink strength density (s− 1). Due to the presence of paramagnetic impurities on surface (polymer chains) or hindrance in molecular
tumbling close to surface (Chui et al., 1995), surface behaves as an absorber of magnetization so that relaxation is faster than in the bulk, i.e. far from
solid surface. Consequently, the following boundary condition has to be accomplished:
(B.2)
(Dn∙∇ρ + μρ)S = 0
where n is the unit outward normal vector at the bounding surface S and μ is the surface sink strength density (m/s). The physical quantities μ and θ are
connected to their respective, average, macroscopic, counterparts M (relaxivity) and Θ by:
∫
∫
θ(r)dV ⏞⏟⏟⏞ Chui et al.,1995 1
μ(r)dS
M=
Θ=
=
(B.3)
S
V
T2,H2 O
where V is the volume of the water filling the polymeric network and T2H2O is the spin-spin relaxation time of free (or bulk) water. Interestingly, M (m/
s) is interpreted as the ratio between the thickness of the thin water layer surrounding the polymeric chain (the so-called surface or bound water) and
the relaxation time of bound water (Chui et al., 1995).
The relation between the xy component of the magnetization (Mxy) and ρ is given by:
Mxy(t) =
∫
(B.4)
ρ(r, t)dV Mxy(t = 0) = ρ0V
Eq. (B.1) integration on V, taking advantage of the divergence theorem, leads to (Chui et al., 1995):
∫∫
1
ρdS −
T2,H2 O
dM
=− M
dt
(B.5)
As Eq. (B.1) analytical solution reads (Chui et al., 1995):
( )
∞
∑
M(t) =
−
Ii e
t
T2i
(B.6)
i=1
It is easy to verify that:
∞
∑
dM(t = 0)
Ii
= −
dt
T
i=1 2i
(B.7)
Remembering that ρ(0) = M(0)/V, for t = 0, Eq. (B.5) can be written as:
13
Carbohydrate Polymers 277 (2022) 118895
T. Kopaˇc et al.
−
∞
dM(t = 0)/dt ∑
Ii
=
=
M(t = 0)
T
i=1 2i
( )
1
S
1
= M +
T2 m V
T2,H2 O
(B.8)
Eq. (B.8) is nothing more than our Eq. (6).
Due to unavoidable magnetic field inhomogeneity, an additional term has to be considered on the right hand side of Eq. (B.8) when referring to the
spin-spin relaxation time T2 (this term disappears when dealing with the spin-lattice relaxation time T1 (Coates et al., 1999)):
1
D
= (γΔGτ)2
T2D 12
(B.9)
where γ (=4.26 × 10⁷ Hz/T) is the gyromagnetic ratio for 1H and t (=0.25 ms) is the echo time, i.e. the time between two 180◦ pulses in the CarrPurcell-Meiboom-Gill (CPMG) pulse sequence we used in all our experiments. As at 25 ◦ C (the temperature chosen for samples characterization) D =
2.5 × 10− 9 m2/s and, according to the information coming from the LF-NMR supplier (Bruker), we have ΔG < 10− 2 T/m, it turns out that 1/T2D is
about 0.003% of 1/T2,H2O, i.e., it is negligible.
According to Brownstein and Tarr (1979), who dealt with spherical or cylindrical pores, and Chui et al. (1995), who extended the Brownstein and
Tarr (1979) approach to fibrous systems such as gels (they defined the concept of “fiber cell”, a cylindrical water volume surrounding each polymeric
fiber), in Eq. (B.6) only the first addendum matters when fast diffusion conditions are attained. Fast diffusion occurs when water self-diffusion co
efficient (D) is high, i.e. when the rate of diffusion (D) is high in comparison to the rate of magnetization loss M R at solid surface (pore wall or
polymeric fiber surface. R represents pore radius or fiber cell radius). Indeed, in this situation there will be a rapid exchange between water molecules
near the solid surface (pore wall or polymeric fiber surface), the so-called bound water, and the bulk or free water, i.e. water molecules far from the
solid surface. Thus, when M R/D ≪ 1 (the typical situation met in hydrogels (Chui et al., 1995)), water relaxation inside the fiber cell is mono
exponential and only one relaxation time is needed to describe Mxy(t) decay. As in real hydrogels there will surely exist fiber cells characterized by
different S/V ratios, the value of (1/T2)m will be the averaged value competing to all the different kinds of fiber cells (each one characterized by only
one spin-spin relaxation time). The implementation of the Chui model by Scherer (Scherer, 1994) allowed to consider a more realistic arrangement of
the three-dimensional fibrous network of hydrogels. Indeed, he considered cubical, tetrahedral or octahedral arrangements. The simplification of this
approach (Abrami et al., 2018), finally allowed to provide a simple, although powerful, expression of the S/V in term as function of the (cubical) mesh
size (ε) and the polymer volume fraction in the gel (see Eq. (6)).
Appendix C. Supplementary data
The following is the supplementary data related to this article. The Eq. (12) parameters are presented. Hydrogels samples and experimental values
of shear modulus G, their crosslink density ρx values and average relaxation time T2m are shown. Parity plots for different hydrogel systems (com
parison of experimental and calculated crosslink density of hydrogel samples) are illustrated. The spectrum of relaxation times distribution are
demonstrated. Supplementary data to this article can be found online at doi: />
References
Coates, G. R., Xiao, L. L., & Prammer, M. G. (1999). NMR logging principles and application.
Houston: Halliburton Energy Services Publication.
Coviello, T., Palleschi, A., Grassi, M., Matricardi, P., Bocchinfuso, G., & Alhaique, F.
(2005). Scleroglucan: A versatile polysaccharide for modified drug delivery.
Molecules, 10(1), 6–33. />Coviello, T., Matricardi, P., Alhaique, F., Farra, R., Tesei, G., Fiorentino, S., Asaro, F.,
Milcovich, G., & Grassi, M. (2013). Guar gum/borax hydrogel: Rheological, low field
NMR and release characterizations. Express Polymer Letters, 7(9), 733–746. https://
doi.org/10.3144/expresspolymlett.2013.71
Curvello, R., & Garnier, G. (2020). Cationic cross-linked nanocellulose-based matrices for
the growth and recovery of intestinal organoids. Biomacromolecules, 22(2), 701–709.
/>Das, D., & Pal, S. (2015). Modified biopolymer-dextrin based crosslinked hydrogels:
Application in controlled drug delivery. RSC Advances, 5(32), 25014–25050. https://
doi.org/10.1039/c4ra16103c
Descallar, F. B. A., & Shingo Matsukawa, S. (2020). Change of network structure in
agarose gels by aging during storage studied by NMR and electrophoresis.
Carbohydrate Polymers, 245, Article 116497. />carbpol.2020.116497
Drageta, K. I., GåserØd, O., Aunea, I., Andersen, P. O., Storbakken, B., Stokke, B. T., &
SmidsrØd, O. (2001). Effects of molecular weight and elastic segment flexibility on
syneresis in Ca-alginate gels. Food Hydrocolloids, 15(4–6), 485–490. />10.1016/S0268-005X(01)00046-7
Drury, J. L., & Mooney, D. J. (2003). Hydrogels for tissue engineering: Scaffold design
variables and applications. Biomaterials, 24(24), 4337–4351. />10.1016/S0142-9612(03)00340-5
Fanesi, G., Abrami, M., Zecchin, F., Giassi, I., Ferro, E. D., Boisen, A., Grassi, G.,
Bertoncin, P., Grassi, M., & Marizza, P. (2018). Combined used of rheology and LFNMR for the characterization of PVP-alginates gels containing liposomes.
Pharmaceutical Research, 35(9). 171/
1-171/11.
French, A. D. (2017). Glucose, not cellobiose, is the repeating unit of cellulose and why
that is important. Cellulose, 24(11), 4605–4609. />Goy, C. B., Chaile, R. E., & Madrid, R. E. (2019). Microfluidics and hydrogel: A powerful
combination. Reactive and Functional Polymers, 145, Article 104314. />10.1016/j.reactfunctpolym.2019.104314
Abrami, M., D’Agostino, I., Milcovich, G., Fiorentino, S., Farra, R., Asaro, F., Lapasin, R.,
Grassi, G., & Grassi, M. (2014). Physical characterization of alginate–Pluronic F127
gel for endoluminal NABDs delivery. Soft Matter, 10, 729–737. />10.1039/c3sm51873f
Abrami, M., Chiarappa, G., Farra, R., Grassi, G., Marizza, P., & Grassi, M. (2018). Use of
low-field NMR for the characterization of gels and biological tissues. ADMET and
DMPK, 6(1), 34. />Abrami, M., Siviello, C., Grassi, G., Larobina, D., Grassi, M., & M.. (2019). Investigation
on the thermal gelation of Chitosan/β-glycerophosphate solutions. Carbohydrate
Polymers, 214, 110–116. />Afghah, F., Altunbek, M., Dikyol, C., & Koc, B. (2020). Preparation and characterization
of nanoclay-hydrogel composite support-bath for bioprinting of complex structures.
Scientific Reports, 10(1), 1–13. />Ahmed, E. M. (2015). Hydrogel: Preparation, characterization, and applications: A
review. Journal of Advanced Research, 6(2), 105–121. />jare.2013.07.006. Elsevier B.V.
Amsden, B. (1998). Solute diffusion within hydrogels. Mechanisms and Models
Macromolecules, 31, 8382–8395. />Andrade Batista, R., Perez Espitia, P. J., De Souza, J., Quintans, S., Machado Freitas, M.,
ˆ Teixeira, J. A., & Cardoso, J. C. (2018). Hydrogel as an alternative
Cerqueira, M.A.,
structure for food packaging systems. Carbohydrate Polymers, 205, 106–116. https://
doi.org/10.1016/j.carbpol.2018.10.006
Brownstein, K. R., & Tarr, C. E. (1979). Importance of classical diffusion in NMR studies
of water in biological cells. Physical Review A, 19, 2446–2453. PhysRevA.19.2446.
Bruck, S. D. (1961). Extension of the flory-rehner theory of swelling to an anisotropic
polymer system. Journal of Research of the National Bureau of Standards Section A:
Physics and Chemistry, 65A(6), 485. />Carr, D. A., & Peppas, N. A. (2009). Molecular structure of physiologically-responsive
hydrogels controls diffusive behavior. Macromolecular Bioscience, 9(5), 497–505.
/>Chen, G., Tang, W., Wang, X., Zhao, X., Chen, C., & Zhu, Z. (2019). Applications of
hydrogels with special physical properties in biomedicine. Polymers, 11(9). https://
doi.org/10.3390/polym11091420
Chui, M. M., Phillips, R. J., & McCarthy, M. J. (1995). Measurement of the porous
microstructure of hydrogels by nuclear magnetic resonance. Journal of Colloid and
Interface Science, 174, 336–344. />
14
T. Kopaˇc et al.
Carbohydrate Polymers 277 (2022) 118895
Marizza, P., Abrami, M., Keller, S. S., Posocco, P., Laurini, E., Goswami, K., Skov, A. L.,
Boisen, A., Larobina, D., Grassi, G., & Grassi, M. (2016). Synthesis and
characterization of UV photocrosslinkable hydrogels with poly(N-vinyl-2pyrrolidone): Determination of the network mesh size distribution. International
Journal of Polymeric Materials and Polymeric Biomaterials, 65, 516–525. https://doi.
org/10.1080/00914037.2015.1129964
Mehandzhiyski, A. Y., Riccardi, E., Van Erp, T. S., Koch, H., Åstrand, P. O., Trinh, T. T., &
Grimes, B. A. (2015). Density functional theory study on the interactions of metal
ions with long chain deprotonated carboxylic acids. Journal of Physical Chemistry A,
119(40), 10195–10203. />Meiboom, S., & Gill, D. (1958). Modified spin-echo method for measuring nuclear
relaxation times. The Review of Scientific Instruments, 29, 688–691. />10.1063/1.1716296
Nazmabadi, M., Shirdast, A., Sharif, A., & Aalaie, J. (2020). Aqueous/brine solutions
viscosity and surface properties of hydrophobically modified scleroglucans: Role of
grafted chain length. Carbohydrate Polymers, 229, Article 115519. />10.1016/j.carbpol.2019.115519
Paolicelli, P., Varani, G., Pacelli, S., Ogliani, E., Nardoni, M., Petralito, S., Adrover, A., &
Casadei, M. A. (2017). Design and characterization of a biocompatible physical
hydrogel based on scleroglucan for topical drug delivery. Carbohydrate Polymers,
174, 960–969. />Park, K., Dawson, J. I., Oreffo, R. O. C., Kim, Y. H., & Hong, J. (2020). Nanoclaypolyamine composite hydrogel for topical delivery of nitric oxide gas via innate
gelation characteristics of laponite. Biomacromolecules, 21(6), 2096–2103. https://
doi.org/10.1021/acs.biomac.0c00086
Pati˜
no-Mas´
o, J., Serra-Parareda, F., Tarr´
es, Q., Mutj´
e, P., Espinach, F. X., & DelgadoAguilar, M. (2019). TEMPO-oxidized cellulose nanofibers: A potential bio-based
superabsorbent for diaper production. Nanomaterials, 9(9). />nano9091271
Peppas, N. A., Bures, P., Leobandung, W., & Ichikawa, H. (2000). Hydrogels in
pharmaceutical formulations. European Journal of Pharmaceutics and
Biopharmaceutics, 50(1), 27–46. />Rosiak, J. M., & Yoshii, F. (1999). Hydrogels and their medical applications. Nuclear
Instruments and Methods in Physics Research, Section B: Beam Interactions with Materials
and Atoms, 151(1–4), 56–64. />Ruzicka, B., & Zaccarelli, E. (2011). A fresh look at the laponite phase diagram. Soft
Matter, 7(4), 1268–1286. />Saalwachter, K. (2003). Detection of heterogeneities in dry and swollen polymer
networks by proton low-field NMR spectroscopy. JACS, 125, 14684–14685. https://
doi.org/10.1021/ja038278p
Saalwachter, K. (2007). Proton multiple-quantum NMR for the study of chain dynamics
and structural constraints in polymeric soft materials. Progress in NMR Spectroscopy,
51, 1–35. />Saalwachter, K., Chasse, W., & Sommer, J. U. (2013). Structure and swelling of polymer
networks: Insights from NMR. Soft Matter, 29, 6587–6593. />c3sm50194a
Scherer, G. W. (1994). Hydraulic radius and mesh size of gels. Journal of Sol-Gel Science
and Technology, 1, 285–291. />ˇ
Sebenik,
U., Krajnc, M., Aliˇc, B., & Lapasin, R. (2019). Ageing of aqueous TEMPOoxidized nanofibrillated cellulose dispersions: A rheological study. Cellulose, 26(2),
917–931. />ˇ
Sebenik,
U., Lapasin, R., & Krajnc, M. (2020). Rheology of aqueous dispersions of
laponite and TEMPO-oxidized nanofibrillated cellulose. Carbohydrate Polymers, 240,
Article 116330. />Sheu, S. Y., Yang, D. Y., Selzle, H. L., & Schlag, E. W. (2003). Energetics of hydrogen
bonds in peptides. Proceedings of the National Academy of Sciences of the United States
of America, 100(22), 12683–12687. />Valentın, J. L., Lopez, D., Hernandez, R., Mijangos, C., & Saalwachter, K. (2009).
Structure of Poly(vinyl alcohol) cryo-hydrogels as studied by proton low-field NMR
spectroscopy. Macromolecules, 42, 263–272. />Wang, K. L., Burban, J. H., & Cussler, E. L. (1993). Hydrogels as separation agents.
Advances in Polymer Science, 110, 66–79. />Way, A. E., Hsu, L., Shanmuganathan, K., Weder, C., & Rowan, S. J. (2012). pHresponsive cellulose nanocrystal gels and nanocomposites. ACS Macro Letters, 1(8),
1001–1006. />Wisniewska, M. A., Seland, J. G., & Wang, W. (2018). Determining the scaling of gel
mesh size with changing crosslinker concentration using dynamic swelling,
rheometry, and PGSE NMR spectroscopy. Journal of Applied Polymer Science, 46695,
1–10. />Xu, H., Liu, Y., Xie, Y., Zhu, E., Shi, Z., Yang, Q., & Xiong, C. (2019). Doubly cross-linked
nanocellulose hydrogels with excellent mechanical properties. Cellulose, 26(16),
8645–8654. />Zinge, C., & Kandasubramanian, B. (2020). Nanocellulose based biodegradable polymers.
European Polymer Journal, 133, Article 109758. />eurpolymj.2020.109758
Hecht, H., & Srebnik, S. (2016). Structural characterization of sodium alginate and
calcium alginate. Biomacromolecules, 17(6), 2160–2167. />acs.biomac.6b00378
Ho, T. T. T., Zimmermann, T., Hauert, R., & Caseri, W. (2011). Preparation and
characterization of cationic nanofibrillated cellulose from etherification and highshear disintegration processes. Cellulose, 18(6), 1391–1406. />10.1007/s10570-011-9591-2
Hoare, T. R., & Kohane, D. S. (2008). Hydrogels in drug delivery: Progress and
challenges. Polymer, 49(8), 1993–2007. />polymer.2008.01.027. Elsevier BV.
Homayouni, A., Ehsani, M. R., Azizi, A., Saeid Yarmand, M., & Razavi, S. H. (2007).
Effect of lecithin and calcium chloride solution on the microencapsulation process
yield of calcium alginate beads (English) Iranian Polymer Journal, 16(9) http://
journal.ippi.ac.ir.
Isogai, A., Saito, T., & Fukuzumi, H. (2011). 3(1), 71–85. />c0nr00583e
Jaeger, F., Shchegolikhina, A., Van Asc, H., & Schaumann, G. E. (2010). Proton NMR
relaxometry as a useful tool to evaluate swelling processes in peat soils. Open
Magnetic Resonance Journal, 3, 27–45. />1874769801003010027
Kirchhof, S., Abrami, M., Messmann, V., Hammer, N., Goepferich, A. M., Grassi, M., &
Brandl, F. P. (2015). Diels-Alder hydrogels for controlled antibody release:
Correlation between mesh size and release rate. Molecular Pharmaceutics, 12(9),
33583368. />Klemm, D., Kramer, F., Moritz, S., Lindstră
om, T., Ankerfors, M., Gray, D., & Dorris, A.
(2011). Nanocelluloses: A new family of nature-based materials. Angewandte Chemie,
International Edition, 50(24), 5438–5466. />Kopaˇc, T., Ruˇcigaj, A., & Krajnc, M. (2020). The mutual effect of the crosslinker and
biopolymer concentration on the desired hydrogel properties. International Journal of
Biological Macromolecules, 159, 557–569. />ijbiomac.2020.05.088
Kopaˇc, T., Krajnc, M., & Ruˇcigaj, A. (2021). A mathematical model for pH-responsive
ionically crosslinked TEMPO nanocellulose hydrogel design in drug delivery
systems. International Journal of Biological Macromolecules, 168, 695–707. https://
doi.org/10.1016/j.ijbiomac.2020.11.126
ˇ
Lapasin, R., Abrami, M., Grassi, M., & Sebenik,
U. (2017). Rheology of laponitescleroglucan hydrogels. Carbohydrate Polymers, 168, 290–300. />10.1016/j.carbpol.2017.03.068
Li, X., Li, Y., Chen, C., Zhao, D., Wang, X., Zhao, L., Shi, H., Ma, G., & Su, Z. (2015). Pore
size analysis from low field NMR spin–spin relaxation measurements of porous
microspheres. Journal of Porous Materials, 22, 11–20. />s10934-014-9864-x
Li, Y., Li, X., Chen, C., Zhao, D., Sub, Z., Mab, G., & Yu, R. (2016). A rapid, non-invasive
and non-destructive method for studyingswelling behavior and microstructure
variations of hydrogels. Carbohydrate Polymers, 151, 1251–1260. />10.1016/j.carbpol.2016.06.054
Liang, L., Bhagia, S., Li, M., Huang, C., & Ragauskas, A. J. (2020). Cross-linked
nanocellulosic materials and their applications. ChemSusChem, 13(1), 78–87.
/>Liang, Y., Xue, J., Du, B., & Nie, J. (2019). Ultrastiff, tough, and healable ionic-hydrogen
bond cross-linked hydrogels and their uses as building blocks to construct complex
hydrogel structures. ACS Applied Materials and Interfaces, 11(5), 5441–5454. https://
doi.org/10.1021/acsami.8b20520
Lin, N., & Dufresne, A. (2014). Nanocellulose in biomedicine: Current status and future
prospect. European Polymer Journal, 59, 302–325. />eurpolymj.2014.07.025
Lin, N., Bruzzese, C., & Dufresne, A. (2012). TEMPO-oxidized nanocellulose participating
as crosslinking aid for alginate-based sponges. ACS Applied Materials and Interfaces, 4
(9), 4948–4959. />Lundahl, M. J., Berta, M., Ago, M., Stading, M., & Rojas, O. J. (2018). Shear and
extensional rheology of aqueous suspensions of cellulose nanofibrils for biopolymerassisted filament spinning. European Polymer Journal, 109, 367–378. />10.1016/j.eurpolymj.2018.10.006
Maestri, C. A., Abrami, M., Hazan, S., Chist`e, E., Golan, Y., Rohrer, J., BernkopSchnürch, A., Grassi, M., Scarpa, M., & Bettotti, P. (2017). Role of sonication pretreatment and cation valence in the sol-gel transition of nano-cellulose suspensions.
Scientific Reports, 7(1), 1–10. />Mahinroosta, M., Jomeh Farsangi, Z., Allahverdi, A., & Shakoori, Z. (2018). Hydrogels as
intelligent materials: A brief review of synthesis, properties and applications.
Materials Today Chemistry, 8, 42–55. />mtchem.2018.02.004
Manga, R. D., & Jha, P. K. (2017). Mathematical models for controlled drug release
through pH-responsive polymeric hydrogels. Journal of Pharmaceutical Sciences, 106
(2), 629–638. />
15