Screening of hydrogen bonds in modified cellulose acetates with alkyl chain substitutions
Bạn đang xem bản rút gọn của tài liệu. Xem và tải ngay bản đầy đủ của tài liệu tại đây (850.6 KB, 11 trang )
Carbohydrate Polymers 285 (2022) 119188
Contents lists available at ScienceDirect
Carbohydrate Polymers
journal homepage: www.elsevier.com/locate/carbpol
Screening of hydrogen bonds in modified cellulose acetates with alkyl
chain substitutions
Robin Nilsson a, b, Martina Olsson c, Gunnar Westman b, d, Aleksandar Matic b, c,
Anette Larsson a, b, *
a
Applied Chemistry, Department of Chemistry and Chemical Engineering, Chalmers University of Technology, SE-412 96 Gothenburg, Sweden
FibRe-Centre for Lignocellulose-based Thermoplastics, Department of Chemistry and Chemical Engineering, Chalmers University of Technology, SE-412 96 Gothenburg,
Sweden
c
Materials Physics, Department of Physics, Chalmers University of Technology, SE-412 96 Gothenburg, Sweden
d
Chemistry and Biochemistry, Department of Chemistry and Chemical Engineering, Chalmers University of Technology, SE-41296 Gothenburg, Sweden
b
A R T I C L E I N F O
A B S T R A C T
Keywords:
Water interactions
Glass transition temperature
Screening
Hydrogen bonding
Cellulose acetate
Hansen solubility parameters
This study aimed to elucidate how the glass transition temperature and water interactions in cellulose esters are
affected by the structures of their side chains. Cellulose acetate, cellulose acetate propionate and cellulose acetate
butyrate with three fractions of butyrates, all having the same total degree of substitution, were selected, and
hot-melt pressed. The degree of substitution, structural properties, and water interactions were determined. The
Hansen solubility parameters were calculated and showed that the dispersive energy dominates the total
cohesive energy, followed by hydrogen bonding and polar energy. The glass transition temperature (Tg)
decreased, counter-intuitively, with an increased total cohesive energy, which can be explained by the shortrange hydrogen bonds being screened by the increased length of the substituents. The solubility and penetra
tion of water in the cellulose esters decreased with increased side chain length, although the hydrogen bonding
energies for all the esters were approximately constant.
1. Introduction
Modifying cellulose adds value to the most abundant biopolymer
found on the planet, where the starting material for substitution can be
derived from plants, wood or other sources such as recycled newspapers
(Filho et al., 2008), waste blended fabrics (Sun et al., 2013) or sorghum
straw (Andrade Alves et al., 2019). The type and degree of substitution
(DS) per anhydroglucose units (AGUs) create enormous opportunities to
tune the hydrophobicity, mechanical and thermal properties of the
cellulose derivatives. The influence of the substituent can be demon
strated by comparing methylcellulose and ethyl cellulose, where a
similar degree of substitution allows the former to dissolve in water but
the latter not (Hjă
artstam & Hjertberg, 1999a; Kono & Numata, 2020). A
large variety of cellulose derivatives are currently available commer
cially: a few substituted cellulose ethers that may be mentioned in this
context are methyl cellulose, ethyl cellulose (EC), hydroxyethyl cellu
lose, hydroxypropyl cellulose (HPC), hydroxypropyl methylcellulose
(HPMC), ethyl hydroxyethyl cellulose, methyl ethyl hydroxyethyl cel
lulose, and a few substituted cellulose esters are cellulose acetate (CA),
cellulose acetate propionate (CAP), cellulose acetate butyrate (CAB) and
cellulose acetate phthalate. Cellulose derivatives are commercially
attractive because they are made from renewable sources and easily
tuned to provide desirable properties. This ability makes them useful in
a large variety of applications, such as coatings, laminates, additives in
building materials, pharmaceuticals, cosmetics, optical films and food
(Klemm et al., 2005). In many of these products, cellulose derivatives
are the component that provides the product with its critical function:
one example is the cellulose ether HPMC, which is used as a releasecontrolling agent for drug delivery from hydrophilic matrix tablets
(Viriden et al., 2010). Other examples are HPC and EC: their phase
separation in coatings is used to control the drug delivery (Andersson,
2015). Cellulose esters, like cellulose acetate, are known to have good
barrier properties in food packaging and are also used in coatings, lac
quers, sealants and pharmaceutical applications (Gabor & Tita, 2012;
* Corresponding author at: Applied Chemistry, Department of Chemistry and Chemical Engineering, Chalmers University of Technology, SE-412 96 Gothenburg,
Sweden.
E-mail addresses: (R. Nilsson), (M. Olsson), (G. Westman),
(A. Matic), (A. Larsson).
/>Received 12 November 2021; Received in revised form 23 January 2022; Accepted 24 January 2022
Available online 29 January 2022
0144-8617/© 2022 The Author(s). Published by Elsevier Ltd. This is an open access article under the CC BY license ( />
R. Nilsson et al.
Carbohydrate Polymers 285 (2022) 119188
Schuetzenberger et al., 2016). Moreover, cellulose ester films exhibit
good mechanical properties and are used as membranes in separation
techniques (Klemm et al., 2005). CA in particular, along with CAP and
CAB, has attracted interest in the field of water purification by reversed
osmosis, as well as the newer technology of forward osmosis, due to their
ability to tune water fluxes and salt retention (Ong et al., 2012; Ong &
Chung, 2012; Qiao et al., 2012; Zhang et al., 2012). Fully substituted CA,
commonly referred to as cellulose triacetate, has high salt retention but
low water flux, whereas less substituted CA has higher water flux and
lower salt retention. CAP and CAB have a lower salt and water perme
ability than CA: properties that are shown to depend on the substitution
degree (Ong et al., 2012).
The transport of permeants in polymer films, which is determined by
several factors such as the solubility of the permeant and the diffusion
coefficient for the permeant in the film, has been discussed in the review
paper by Gårdebjer et al. (Gårdebjer et al., 2018). Crystallinity affects
the diffusion rate in at least two ways: firstly, the crystalline regions are
almost impermeant, resulting in longer diffusion pathways and conse
quently a decrease in total solubility. Secondly, the tie chains between
the crystalline regions decrease the chain mobility, resulting in a lower
diffusion rate (Ashley, 1985). These effects on permeability have been
confirmed by increased crystallinity found at interphases between
laminar structures (polyethylene and modified polyethylene) by Går
debjer et al. and poly(lactic acid) with nanofillers by Trifol et al. (Går
debjer, Andersson, et al., 2016; Gồrdebjer, Gebă
ack, et al., 2016; Trifol
et al., 2020). The mobility of the chain is also affected by the tempera
ture relative to the glass transition temperature (Tg) and thus relates
directly to the barrier properties (Ashley, 1985). The Tg is known to
depend on several factors, including the intermolecular forces between
the polymer chains, the space occupied by the main chain and side
chains, the movement of the side chains and density (Kreibch & Batzer,
1979).
Water is recognized as absorbing into many biopolymers and having
a plasticizing effect (Reid & Levine, 1991). The amount of water
absorbed depends on the environment, e.g. the relative humidity and
temperature, and thereby affects the properties of the material. The
tailoring of new bio-based materials can be improved by increasing
knowledge of how water interacts with the polymers, so that its effect on
the properties of the material can be predicted more skilfully. The
amount of -OH groups present in bio-based polymers has been used to
make such predictions in the literature, since these groups have been
proven to be of importance to both interactions with water (Akim, 2005;
Ong et al., 2013) and thermal properties such as the Tg (Asai et al., 2001;
ărtstam & Hjertberg, 1999b). A common concept used to predict in
Hja
teractions between polymers and solvents was launched by Hansen and
is often referred to as Hansen solubility parameters (HSP). These have
been applied to several areas, including polymer solubility, swelling in
solvents, surfaces-solvent interaction and, in particular, barrier proper
ties (Hansen, 2007). HSP are based on three different types of in
teractions: dispersion cohesive energy (ED), polar cohesive energy (Ep)
and hydrogen bonding energy (EH). The parameters can either be
determined experimentally via the degree of swelling or solubility in
several well-defined solvents, or calculated bottom-up using group
contribution methods. Interactions between solvents and polymers
calculated by the HSP concept have been shown to correlate to solubility
and permeability, making it a suitable tool for analysing polymers and
permeant interactions (Lindblad et al., 2008).
This study aims at evaluating how the molecular structures of the
various substituents in the cellulose acetate derivatives CA, CAP, and
CAB affect interactions with water and the Tg. The hypothesis in this
study is that an increasing side chain length decreases the effect of the
hydrogen bonding and thus screens attractive interactions that affect
thermal properties and the polymers’ interaction with water. Therefore,
cellulose derivatives with a similar total number of substituents were
chosen but with different side chain lengths and ratios between shorter
and longer side chains. The film-forming process employed here is
solvent-free hot-melt pressed films, which is in contrast to the majority
of permeation studies that use solvent-cast films (Lee et al., 2018;
Lonsdale et al., 1965). When solvent interacts strongly with the polymer
chains, there is a risk that small amounts of solvents remain in the film
after film casting and may thereby influence its properties. The cellulose
derivatives were hot-melt pressed into films and characterized by FTIR,
NMR, TGA, DSC and WAXS before studying the water absorption and
water permeation. The NMR data was used to calculate the degree of
substitution; based on these, the HSP were calculated and correlated to
Tg, water absorption and water permeation.
2. Experimental
2.1. Materials
Cellulose acetate (CA, number average molecular weight, Mn = 50
kDa), cellulose acetate propionate (CAP, Mn = 75 kDa), cellulose acetate
butyrate of three different degree of substitutions and referred to as
CABI (Mn = 65 kDa), CABII (Mn = 30 kDa) and CABIII (Mn = 30 kDa),
were all purchased from Sigma Aldrich, Sweden. Ethyl cellulose (EC)
(CR grade 14 cPs) was kindly provided by DowWolff Cellulosics GmbH,
Germany. All polymers were used as received. Intervals of the number of
substituents on each cellulose derivative were provided by the suppliers,
and these are presented in Table S1, in Supporting information (SI).
Potassium bromide FT-IR grade, ≥99% from Merck, DMSO-D6
sourced from VWR, and Chloroform‑d 99.8 atom % D were purchased
from Sigma Aldrich Sweden. In the diffusion measurements, 5 mCi (185
MBq) tritium-labeled water and Ultima Gold from Perkin–Elmer, USA,
were used.
2.2. Sample preparation
Hot-melt pressing was used to prepare thin films of 100 μm for the
water self-diffusion experiments and 500 μm thick films for the water
absorption experiments. The materials, approx. 0.2 g for thin films and
0.5 g for thick films, were pressed between two flat metal plates for 5–7
min under 15 ± 0.5 t pressure at a temperature of 10–30 ◦ C above the
melting temperature of each material but below their degradation
temperature. The films were pressed at: 260, 210, 250, 190, 170 and
180 ◦ C for CA, CAP, CABI, CABII, CABIII and EC, respectively. There
after, the flat plates with sample film conditioned for more than 30 min
at room temperature at a pressure of 8.9 ± 0.1 kg until the temperature
was below 60 ◦ C, before samples were shaped into suitable dimensions
for the respective analysis method.
2.3. FTIR
The cellulose derivatives were mixed to 1 wt% with KBr, ground into
powder using a mortar and pestle and then pressed into tablets. The
Fourier transform infrared (FTIR) spectra were obtained on a Perki
nElmer Spectrum One FTIR Spectrometer (PerkinElmer instruments,
Massachusetts, USA), with 28 scans per sample, a resolution of 4 cm− 1 at
400–4000 cm− 1, for samples stored in a desiccator and measured
directly.
2.4. NMR
CA was dissolved in DMSO-D6 (40 mg mL− 1) and characterized with
H NMR on an Agilent 400 MHz spectrometer with eight scans and
acquisition time of 2.5559 s. 1H-1H gCOSY (gradient correlation spec
troscopy) experiment was performed with the standard gCOSY Varian
sequence using one scan and 128 increments. Spectral widths of 8 ppm
in both directions with a 3.3 kHz spectral width, 0.15 s acquisition time,
1 s relaxation delay and 9.6 μs 90◦ pulse width were used. The other
cellulose derivatives were dissolved in CDCl3 and analysed in the same
way. The degree of substitutions (DS) for the acetates were calculated
1
2
R. Nilsson et al.
Carbohydrate Polymers 285 (2022) 119188
according to Huang et al. (2011), using Eqs. (1), (2) and (3):
Iacetyl x7
DSA =
IAGU x3
(1)
DSB =
Ibutyryl x7
IAGU x3
(2)
DSP =
Ipropionyl x7
IAGU x3
(3)
determined by NMR. This method is used due to its direct relation to the
chemical structure and thus can be calculated from any structure. The
experimentally determined values for CA, CAP and CAB are for discrete
values of HSP and studies show a strong correlation between the degree
of substitution and HSP (Bochek & Apetropavlovsky, 1992; Ramanaiah
et al., 2011; Ramanaiah et al., 2012).
The HSP can be represented in a 3-dimensional space, where the
distance Ra between the coordinates of two materials provides infor
mation of how similar they are with respect to solubility (Elidrissi et al.,
ăck, et al.,
2012; Gồrdebjer, Andersson, et al., 2016; Gårdebjer, Geba
2016; Hansen, 2007), and can be calculated as:
)2
(
(8)
(Ra)2 = 4(δd2 − δd1 )2 + δp2 − δp1 + (δh2 − δh1 )2
where DSA, DSB and DSP stand for the degree of substitution for acetyl,
butyryl and propionyl, respectively. IAGU stands for the intensity of the
anhydroglucose units and Iacetyl/propionyl/butyryl for the intensities of the
methyl group in the respective side chain. The number 7 in the equations
refers to the number of protons on the backbone and the number 3 refers
to the available sites for substitution per anhydroglucose unit (Hadi
et al., 2020). For peak assessments, see SI Table S2 and Figs. S1 to S12.
where 1 and 2 refer to the cellulose derivative and water, respectively.
2.6. Water absorption and permeation
The amount of water absorbed by the cellulose derivatives was
determined via the increase in mass of 500 μm films kept in water for 72
h. The amount of water absorbed was calculated according to:
2.5. Hansen solubility parameters
The Hansen solubility parameters (HSP) include three different types
of molecular interactions: the nonpolar interactions dispersive forces,
the polar interactions caused by the molecules permanent dipole and
hydrogen bonding (Hansen, 2007). The squared total HSP, δtot2, is
defined as the ratio between the total cohesive energy (Etot) and the
molar volume (Vmolar). It can be expressed as the sum of the squares of
dispersion (δD), polar (δP) and hydrogen bonding interactions (δH) ac
cording to Eq. (4):
δ2tot =
Etot
ED + EP + EH
=
= δD 2 + δP 2 + δH 2
Vmolar
Vmolar
Percent water absorption =
(4)
√∑
̅̅̅̅̅̅̅̅̅̅̅̅̅̅̅̅̅̅ √∑
̅̅̅̅̅̅̅̅̅̅̅̅̅̅̅̅̅̅
ni F 2 pi
ni F 2 pi
= ∑
Vmolar
ni VFi
(6)
J = Ac
√̅̅̅̅̅̅̅̅̅̅̅̅̅̅̅
̅ √̅̅̅̅̅̅̅̅̅̅̅̅̅̅̅
̅
∑
∑
ni Ehi
ni Ehi
δh =
= ∑
ni VFi
Vmolar
(7)
Table 1
The dispersion components (Fd), polar components (Fp), hydrogen bond energy
components (Eh) and Fedor’s molar volumes (VF) of different groups (van Kre
velen, 1990).
Fd
[J1/2 cm3/2
mol− 1]
Fp2
[J cm3 mol− 2]
Eh
[J mol− 1]
Molar volumes, VF
[cm3 mol− 1]
-COO-CH3
-CH2>CH-OH
-ORing ≥5
390
420
270
80
210
100
190
240,100
0
0
0
250,000
160,000
0
7000
0
0
0
20,000
3000
0
18
33.5
16.1
− 1
10
3.8
16
D δμ
RT δz
(10)
where the mass transfer rate, J (mol s− 1), depends on the cross-section of
the film, A (m2), concentration, c (mol m− 3), diffusion coefficient, D (m2
s− 1), universal gas constant, R (J K− 1 mol− 1), absolute temperature, T
(K), chemical potential, μ (J mol− 1) and distance through the film, z (m).
From this expression, several assumptions are made: (i) the system is
ideal and assumes that chemical potential depends on concentration, (ii)
the concentration profile within the film is not time-dependent, (iii)
stagnant layers at the film’s surfaces have a negligent impact on
permeation and, finally, (iv) there are equal volumes of media on both
sides of the film. These assumptions result in the following equation:
)
(
2PA
Cd,0 − 2Ca (t)
t = − ln
(11)
hV
Cd,0
where the contribution from each group is weighted against an average
degree of substitution (ni) of each group in a monomer unit, which is
Group
(9)
where mw is the wet weight of a film after excess water on the surface
has been removed, and md is the dry weight of the film once it has been
dried overnight in a Memmert Model 600 oven at 60 ◦ C.
The water diffusion was determined by using custom made diffusion
cells with two 20 mL chambers containing 15 mL deionized water each
and separated by the film of interest with 8 mm diameter diffusion area,
and the set-up is described elsewhere (Maciejewski et al., 2018; Larsson
ărtstam & Hjertberg, 1999b; van den van den Mooter
et al., 2010; Hja
et al., 1994). 10 μL of radio-labeled water (Tritium T2O, 1 mCi g− 1) was
added to the donor side, followed by the collection of 0.5 mL at pre
defined times from the acceptor side, while simultaneously replacing the
same amount of dissolution medium. The experiments were carried out
at room temperature and on a shaker. A quantity of 3 mL Ultima Gold
was added to each sample before the amount of T2O was measured using
a PerkinElmer Tri-Carb 2810 TR liquid scintillation analyser. Five rep
licates were made for each material. The mass transfer of water was
calculated using the method proposed by van den Mooter et al. (van den
Mooter et al., 1994) and commonly used by others to determine water
transport (Gårdebjer et al., 2018). It is derived from a macroscopical
diffusion (Fick’s law):
The individual solubility parameters for each material were calcu
lated via the method suggested by Hoftyzer and van Krevelen (VKH)
(van Krevelen & Nijenhuis, 2009). The calculations are based on the list
of the components for dispersive (Fd) and polar (FP) forces, along with
the hydrogen bond energy (Eh) and Fedor’s molar volumes (VF) of the
different groups (Table 1).
The VKH equations for the different solubility parameters are
calculated as follows:
∑
∑
ni Fdi
ni Fdi
δd =
=∑
(5)
ni VFi
Vmolar
δp =
mw − md
× 100
md
where P is the permeability (m2 s− 1), h (m) is the thickness of the film, V
(m3) is the volume of the donor and acceptor chamber, t (s) is the time,
Cd,0 (mol m− 3) is the concentration on the donor side at time 0 and Ca(t)
(mol m− 3) is the concentration on the acceptor side at time t. The
expression on the right-hand side of the Eq. (11) is plotted against time,
3
R. Nilsson et al.
Carbohydrate Polymers 285 (2022) 119188
and the slope is used to calculate the permeability.
applying wide-angle x-ray scattering (WAXS) using a Mat: Nordic X-Ray
scattering instrument (SAXSLAB) equipped with a high brilliance Rigaku
003 X-Ray micro-focus, Cu-Kα radiation source (λ = 1.5406 Å) and a
Pilatus 300 K detector. The unconditioned films were taped onto a
sample holder to retain them in a fixed position, while powder and wet
films were sandwiched between two Kapton windows to allow for
measurements to be made in vacuum. The measurements were per
formed at a distance of 134 mm between sample and detector, with an
exposure time of 300 s. The 2D scattering patterns collected were inte
grated radially to generate the scattering curve, and the Kapton signal
was subtracted from each curve.
2.7. TGA and DSC
The degradation temperature was determined by subjecting 5–10 mg
samples to thermogravimetric analysis (TGA) using a TGA/DSC 3+ Star
System (Mettler Toledo, Switzerland). These samples were heated from
30 to 500 ◦ C with a nitrogen flow of 60 mL min− 1 and at a heating rate of
10 ◦ C min− 1. The degradation temperature (Td) was measured using
STARe Evaluation Software (Mettler Toledo), which takes the point of
intersection of the tangent to the TGA curve at the point of maximum
gradient and the starting-mass baseline.
Differential scanning calorimetry (DSC) was used to investigate the
Tg and the melt temperature (Tm). Samples (approx. 4 mg) were ana
lysed with a DSC 2 STARe system instrument (Mettler Toledo,
Switzerland) using a nitrogen flow of 60 mL min− 1. The heating rate was
10 ◦ C min− 1, with the material being heated up from 25 ◦ C to 250 ◦ C
followed by a cooling step with a cooling rate of 10 ◦ C min− 1. Tg was
calculated using STARe software midpoint tool, and Tm at the melting
peak on the first heating cycle. The software was also used to obtain the
enthalpy of fusion by integrating over the melting peak at the first
heating cycle, if it could be found. This can then be used to calculate the
crystallinity according to the following equation:
%Cryst =
ΔHf
× 100
ΔHfo
3. Results and discussion
3.1. Chemical structure
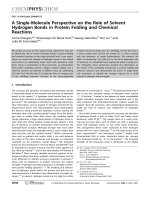
FTIR measurements (Fig. 1) confirm the structure of the cellulose
acetates with the OH stretch at 3479 cm− 1, C-H stretching vibrations of
the side chains at 2969–2879 cm− 1, CH3 stretching at 2975–2880 cm− 1,
stretching of the carbonyl C=O of the acyl at 1753 cm− 1, water hydra
tion peak at 1632 cm− 1 and C-H bending in the -O(C=O)-CH3 at 1384
cm− 1. The signal at 1236 cm− 1 decreases from CA to CABIII, which in
dicates a relation to the acetyl group and has in the literature been
related to the C-O-C asymmetric stretching of the acetyl group (Cao
et al., 2007; Hu et al., 2015; Lindblad et al., 2008). The signal at 1170
cm− 1 increases with increased contents of propionyl and butyryl, which
correlates within the literature to the assigned asymmetric stretching of
C-O-C where one of the carbon atoms belongs to the butyryl group. The
signal at 1048 cm− 1 has been assigned to the C1-O-C4 stretch, which
agrees with similar intensity for all derivatives as they all have glyco
sidic links. Fig. 1 also shows that the ethyl group in ethyl cellulose share
most peaks with the cellulose acetate derivatives, except for the signals
of the ester and acetyl groups.
Several of the IR signals change with an increase in chain length of
the substituents, i.e. going from acetyl to propionyl or butyryl, respec
tively, the intensity of the C-Hn signals at 2969–2879 cm− 1 increases
(12)
where ΔHf is the enthalpy of fusion in J g− 1 (the area of the melting
peak) and ΔHfo (J g− 1) is the enthalpy of fusion of a perfect crystal of
cellulose acetate, which was proposed by Cerqueira et al. (Cerqueira
et al., 2006) to be 58.8 J g− 1. However, no enthalpy of fusion for either a
perfect crystal of cellulose acetate propionate/butyrate or ethyl cellulose
was found in the literature, thereby making the comparison mute.
2.8. WAXS
The nanostructure of the different materials was investigated by
Fig. 1. FT-IR spectra of the different esters: CA, CAP, CABI, CABII, CABIII and EC, in ascending order.
4
R. Nilsson et al.
Carbohydrate Polymers 285 (2022) 119188
compared to the OH signal, which is expected for the addition of further
-CH2 groups.
The DS of the various cellulose derivatives was extracted from NMR
data, found in Figs. S1-S12 in the SI together with the calculation pro
cedures. The NMR spectrum of cellulose acetate shows signals in two
regions, where the protons of the anhydroglucose unit can be found
between 3.2 and 5.5 ppm and the three methyl protons related to the
acetyl group have signals at 2.05, 1.92 and 1.85 ppm. For CAP’s acetyl
methyl protons, a small shift to 1.97 and 1.89 was observed. Similar
shifts of the acetate protons were seen for the CABs, with signals at
2.11–2.04, 1.99–1.97 and 1.92–1.89 ppm. The methylene groups of CAP
give proton signals at 2.37 and 3.24 and those of CAB give 2.33, 2.2,
1.66 and 1.55 ppm. The methyl groups of CAP and CAB give proton
signals at 1.17, 1.05 and 0.97, 0.89 ppm, respectively. This concurs with
previous studies (Hikichi et al., 1995; Huang et al., 2011). EC has similar
signals from the anhydroglucose unit and a methyl proton signal at 1.14
ppm.
The DS of the various side groups (Table 2) was determined and the
total substitution, DStot, is defined as the sum of the DS of acetyl and
propionyl/butyryl. The degree of hydroxyl group (DOH) was calculated
as three minus DStot. The degree of substitution of the different esters
confirms the observations seen in the FTIR data, where CABI to CABIII
have an increasing number of butyryl substituents. The total degree of
substitution is similar for all the derivatives, i.e. the variation is in the
amount of the different substituents. Interestingly, the manufacturers
provided ranges of DS, and these and the experimental obtained DS are
very close to each other (see Table S1 in SI). The DSs were used to
calculate the HSP of each material, and the solubility radius between
water and the corresponding material.
Table 3
Thermal properties of each film material, with corresponding data for powder in
parentheses. Water absorption and water permeability of each material are also
shown. TGA and DSC curves can be found in Figs. S13 to S15 in the SI.
Material
Td
[0C]
CA
355
CAP
356
CABI
365
CABII
356
CABIII
353
EC
338
Tg
[0C]
Tm [0C]
193
(191)
143
(140)
154
(155)
136
(137)
109
(100)
126
(121)
230
(233)
–
(201)
238
(241)
–
(168)
–
(143)
177
(174)
ΔHf
[J g− 1]
Water
abs
[wt%]
Water
permeation
[10− 12 m2 s− 1]
1.00
(7.74)
–
(4.14)
6
(10.64)
–
(11.17)
–
(12.30)
4.35
(6.40)
12.0 ±
2.0
5.0 ± 0.6
3.8 ± 0.2
1.2 ± 0.2
4.4 ± 0.2
1.9 ± 0.5
3.3 ± 0.1
0.8 ± 0.1
1.8 ± 0.5
1.5 ± 0.2
4.9 ± 0.2
2.1 ± 0.8
films, since their Tm are larger than for the other polymers. The observed
Tm for CA is in the lower range compared to the literature (230–260 ◦ C)
whereas for CABI is in the upper range (130–240 ◦ C) (Schuetzenberger,
Dreyfus, & Dreyfus, 2016; Wypych, 2016). These deviations in Tm be
tween the values for CA and CABI in this study and the literature can be
caused by different molecular weights and DSs, which can influence Tm.
No melt peaks were observed for the other acetate films, whereas the
starting powder material (in parenthesis) all show melt signals. The
disappearance of a melting peak might be due to the film-forming pro
cess like cooling rate and/or the materials´ high melt viscosity, which
may affect the thermal properties of the resulting material significantly
(Boy & Schulken, 1967). The area under the melting peaks represents
the melting enthalpy. A decrease and disappearance of the melting peaks
are related to a decrease in crystallinity, defined as the ration between
the melting enthalpy and the enthalpy of fusion of a perfect crystal. For a
CA crystal is this value 58.8 J g− 1, giving a crystallinity of 1.7% for CA
film: this is lower than that is found in the literature, where Schuet
zenberger et al. reported 12% (Schuetzenberger et al., 2016). In sum
mary, the film-forming process has an enormous impact on thermal
properties and for the hot-melt pressing used here, the crystallinity of
the materials seems to decrease.
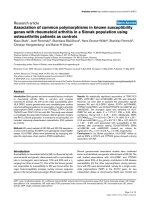
The effect of the hot-melt pressing process can also be observed with
WAXS. In Fig. 2, black curves represent the powder used as received and
red curves the hot-melt pressed films (for WAXS data plotted against 2θ,
see SI Fig. S16) The crystallinity can be calculated from WAXS data for
CA, according to An et al. (2019), but we have chosen not to include this
approach in this study due to the difficulties verifying the used WAXS
peaks for the different cellulose derivatives. However, one could observe
significantly sharper peaks in the WAXS pattern for CAP and CABIII
powder compared to the films: this can be explained by that the powders
have been manufactured in such a way that they have achieved a more
ordered structure and that, upon hot-melt pressing, the structure is be
comes amorphous to a larger extent. CA and CABI show less significant
change between powder and film, which might be due to their larger
3.2. Solid state characterization of films and processing
The degradation temperature (Td), glass transition temperature (Tg)
and melt temperature (Tm) are reported in Table 3. The Td was deter
mined to establish that the processing temperatures to be well below the
degradation temperature, see Fig. S13 for TGA curves and Figs. S14 to
S15 for DSC heating curves in SI.
The Tg of hot-melt pressed films decreases from a CA of 193 ◦ C down
to 109 ◦ C for CABIII, indicating a clear impact of the DSB. The DSP of CAP
is like the DSB of CABIII, but the Tg of CAP is closer to CABII, which
implies that adding a CH2 group to the side chain decreases the Tg
further. A decrease in Tg is observed when the number of carbon atoms
increases on the side chain in the order CA-CAP-CAB, meaning that Tg
decreases with increased side chain length and DS. This is in agreement
with Teramoto, who observed a decrease in Tg with an increase in the
number of carbon atoms on the side chains for up to eight carbons
(Teramoto, 2015). This trend could be because of an increased length of
the side chain and DS, decreasing the possibilities for interactions be
tween groups that can form hydrogen bonds in the cellulose derivatives,
which will be further discussed below.
Table 3 shows that only CA and CABI films have a melting peak: CA
at 230 ◦ C and CABI 238 ◦ C. The absence of melting peaks for the other
films can be due to larger driving force to crystallize for CA and CABI
Table 2
Degree of substitution calculated from NMR and calculations of the HSP (J cm− 3)1/2 using Table 1 and Eqs. (5) to (7). The HSP values of water are taken from Hansen
(2007). Ra is the HSP distance between water and the different polymers.
Material
DStot
DSA
DSP/DSB
DOH
δd
(J cm− 3)1/2
δp
(J cm− 3)1/2
δH
(J cm− 3)1/2
δtot
(J cm− 3)1/2
Ra
(J cm− 3)1/2
CA
CAP
CABI
CABII
CABIII
EC
Water
2.41
2.85
2.85
2.80
2.71
2.56
–
2.41
0.21
2.14
1.12
0.14
–
–
–
2.64
0.71
1.68
2.57
–
–
0.59
0.15
0.15
0.20
0.29
0.45
–
19.0
18.2
18.4
18.2
18.1
18.1
15.5
6.2
4.5
5.0
4.3
3.9
5.2
16
14.5
11.3
11.9
11.2
10.9
11.3
42.3
24.7
21.9
22.4
21.8
21.5
22.0
47.8
30.3
33.5
32.9
33.6
34.1
33.2
–
5
R. Nilsson et al.
Carbohydrate Polymers 285 (2022) 119188
a
0.013
CA
0.011
CAP
0.026
0.009
I [a.u.]
I [a.u.]
b
0.031
0.007
0.021
0.016
0.005
0.011
0.003
0.006
0.001
0.001
0
0.5
1
1.5
2
0
2.5
0.5
1
c
0.016
2
2.5
d
0.026
CABI
CABII
0.021
I [a.u.]
0.013
I [a.u.]
1.5
q [A-1]
q [A-1]
0.01
0.007
0.016
0.011
0.006
0.004
0.001
0.001
0
0.5
1
1.5
q [A-1]
2
0
2.5
e
0.066
1
1.5
q [A-1]
2
2.5
f
0.021
CABIII
0.053
0.5
EC
I [a.u.]
I [a.u.]
0.016
0.04
0.027
0.011
0.006
0.014
0.001
0.001
0
0.5
1
1.5
2
0
2.5
0.5
1
1.5
2
2.5
q [A-1]
q [A-1]
Fig. 2. WAXS curves for CA, CAP, CABI, CABII, CABIII and EC as powder (black), unconditioned films (red) and wet conditioned films (blue). For the 2θ curves, the
reader is referred to SI, Fig. S16.
inter- and intramolecular interactions, shown as their larger Tm and Tg
values relative to the other polymers and thus give rise to similar driving
forces for the formation of the powders and films. To exclude differences
in the manufacturing process of the powders, WAXS was also performed
on precipitated materials, see SI Fig. S17. The WAXS for the precipitated
and original powders were overall similar, with a small tendency that
the precipitated samples appeared more crystalline than the original
samples, probably because the precipitated samples being purified and
crystallized easier. The difference between the precipitated and original
powder was largest for CABI, and this polymer also shows small, sharp
peaks arise in the melt pressed film and thereby increased crystallinity
for both melt pressing and precipitation, indicating that the original
powder being processed, so a less ordered structure was achieved.
Although EC has an entirely different side chain to the esters, it shows a
similar structure with two main peaks; it has a high intensity at 0.55 ±
0.1 Å− 1, like CAP and CAB, which could indicate that this peak is related
to the carbohydrate chain. Similarly, for another system, Gu et al.
assigned the signal at 0.5 Å− 1 to correlate to the distance between
adjacent main chains (Gu et al., 2012).
red curves represent films conditioned at room temperature and the blue
curves those submerged in water for one day. The largest difference was
observed for CA, where the intensities of water-exposed films show a
decrease at q = 1.3 Å− 1 and an increase at higher q (1.6–2 Å− 1) caused
by water absorption. Similar behaviour has been observed in regener
ated cellulose when the water content was increased (Li et al., 2020). A
slight shift of the peak at 1.45–1.5 Å− 1 can be observed for EC, CABI,
CABII, CABIII and CAP, being most prominent for EC and CABI. The shift
to higher q can be interpreted as a decrease in the plane distance in the
structure. This could be related to a water-induced plasticizing of the
polymer, which could enable closer packing of the chains or a contri
bution of water itself. CA, EC and CABI absorb more water than the other
polymers: this concurs with their findings of a larger water-induced
change in structure. In addition to the shift from water, it appears that
the water induces more prominent peaks for CA and CABI, which can be
correlated to an increase in structural order. Thus, absorbed water
softens the structure to a degree where local packing patterns increase
and slightly increase the crystallinity. CAP, CABII and CABIII appear less
affected, which agrees with their lower overall water absorption, which
probably can be related to their increased hydrophobicity.
3.3. Cellulose derivative films and water
3.3.2. Influence of hydroxyl groups
The ability of water to dissolve in the different materials, here
characterized as the materials´ ability to absorb water, is presented in
Table 3. It was highest for the CA film (12 ± 2 wt%), in alignment with
3.3.1. Structural change from water studied by WAXS
The WAXS graphs (Fig. 2) clearly show that when the hot-melt
pressed films are submerged in water their structure is affected: the
6
R. Nilsson et al.
Carbohydrate Polymers 285 (2022) 119188
the 10–14% observation found in the literature (Zhang et al., 2012),
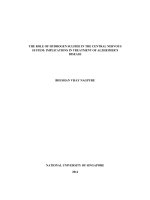
followed by EC, CABI, CAP, CABII and CABIII in declining order. Fig. 3a
and b shows a non-linear behaviour in DOH for both the Tg and water
absorption. The initial decrease in DOH between 0.15 and 0.29 (where
DOH = 0.29 corresponds to CABIII), gave decreased glass transition
temperatures and water absorption, after which both properties
increased instead. The water permeability was determined for the films,
and it is known that crystallinity is an essential parameter for deter
mining the diffusion rate (Gårdebjer et al., Trifol et al., 2020). However,
for these hot-melt pressed films, the degree of crystallinity is low
(≪10%), and therefore, no further discussion of the correlation of
crystallinity to permeability will be performed. Interestingly, water
permeation follows a similar trend as the Tg and water absorption
relative DOH, but with CABII as the turning point. However, the major
difference is that CABIII does not have the lowest permeation, despite
having the lowest absorption of water. This can be due to the existence
of microcracks that may be formed during the cooling step then the films
are manufactured. The brittleness of CABIII’s films and their propensity
to break further supports the existence of microcracks, and it can also be
emphasized that shaping CABIII’s films large enough for use in perme
ability measurements was challenging.
In the literature, it has been suggested that an increase in the amount
of hydroxyl groups correlates to an increase in both the Tg and water
absorption (Hjă
artstam & Hjertberg, 1999a; Ong et al., 2013). Further
more, Ong et al. have shown that solvent-cast CAP and CAB films in
crease water absorption with increasing DOH, for DOH values between
0.8 and 1.29. The reason why the present study does not show the same
linear relation as Ong et al. may be explained by the difference in the
method employed to prepare the film, or the different and smaller var
iations in the DOH, which was beneficial in our case for studying the
effects of the molar structures of the substituents. The non-linear re
lationships observed between DOH and the Tg, water absorption and
water permeation indicate that factors other than the number of OH
groups seem to influence these properties. The effects of the molecular
structures were investigated further by correlating the polymer prop
erties to the HSP.
properties and water interactions.
3.4.1. Glass transition temperature related to HSP
The different HSP are translated into cohesive energy per unit for
each type of interaction (dispersive, polar and hydrogen bonding forces)
by Ei = δi2 Vmolar and plotted against Vmolar, Fig. 4. As Vmolar increases,
the energy for the dispersive force increases while the polar energy
decreases slightly; the hydrogen bonding energy is basically constant.
This is explained by that the dispersive forces increase as the methylene
groups are added to the side chain, whereas only small changes in polar
and hydrogen bonding groups occur. It is interesting to note that the
dispersion energy Ed contributes most to the total cohesive energy
density (>59%), followed by the hydrogen bonding energy (between 25
and 35%) and the very small fraction from the polar interaction (be
tween 3 and 6%).
One hypothesis is that the Tg increases as the total cohesive energy
per unit increases, thereby increasing the Vmolar (Figs. 4 and 5). How
ever, the opposite was in fact found: Tg decreases as Vmolar increases.
Comparing the Tg to the calculated Vmolar (Fig. 5) shows a solid corre
lation for the esters, indicating that the Vmolar impacts the Tg strongly.
Fig. 6 was drawn to investigate whether the Tg could be related to the
total cohesive energy density and/or any of the cohesive energy den
sities of the various types of interactions. As can be seen, Tg increases
with increasing cohesive energy density for all three types of interaction
in the HSP, and thus with the total cohesive energy density, with some
deviations for EC. No single type of interaction appears to control the Tg.
This shows that Tg decreases with both an increase in the Vmolar and an
increase in the dispersive forces. The latter originates from the increase
in the van der Waal interactions when the length of the side chain in
creases. The reason for the reduced Tg is suggested to be due to the
increased side chain length screens, both short distance hydrogen bonds
as well as polar interactions within and between the polymer chains.
Thus, as the dispersive forces and Vmolar increase when methylene
groups are added, the distance between the polymer backbones also
increases, which in turn leads to a lesser likelihood of forming hydrogen
bonds. Interestingly, the addition of just a few methylene groups de
creases the Tg drastically between CA and CABI, which indicates a
critical average side chain length after which the effect of hydrogen
bonding decreases.
The different HSP parameters and the total HSP were compared to
the Tg in Fig. 6. The Tg appears to increase overall with each of the HSP,
with some deviations for EC. To explain this observation, the meaning of
HSP must be reminded. The δh and δp decrease due to an increase in the
Vmolar as the side chain grows, Eqs. (5)–(7) and Table 2, while there is no
addition of any polar and hydrogen bonding groups and thus no sig
nificant changes in these forces. In the case of δd, the dispersive force
increases when methylene groups are added to the side chain, but at the
same time, the Vmolar increases and even more than the addition of
dispersive forces, resulting in a net reduction of δd, Table 2. The increase
3.4. Hansen solubility parameters and material properties
The HSP divide the intermolecular interactions into dispersion (δD),
polar (δP) and hydrogen bonding interactions (δH) (Hansen, 2007). The
molar volumes are essential when calculating HSP, therefore the
calculated Vmolar were compared with experimentally determined ones.
A linear relationship was found even though the total values deviated
(see SI for the description of the experimental method, Fig. S18 and
Table S3). This deviation may be due to either the experimental method
or the calculation method, or indeed both. The linear relation never
theless supports the trend of how the molar volumes vary for the studied
cellulose derivatives. This section compares the HSP to the thermal
Water absorpion [wt.%]
CA
Tg [oC]
175
CABI
150
CAP
EC
CABII
125
b
16
CABIII
12
CA
8
CABI
4
CAP
0.0
0.1
0.2
0.3
0.4
0.5
0.6
0.7
EC
CABII
CABIII
0
100
Water permeation [x10-12 m2 s-1]
a
200
0.0
0.2
0.4
0.6
0.8
c
6
5
CA
4
3
CABI
2
EC
CABIII
CAP
1
CABII
0
0.0
0.2
DOH
DOH
Fig. 3. The relationship of DOH to a) Tg, b) water absorption and c) water permeation.
7
0.4
DOH
0.6
0.8
R. Nilsson et al.
Carbohydrate Polymers 285 (2022) 119188
100000
10000
CABIII
Energy for d and h
80000
8500
CABII
CAP
CA
7000
CABI
70000
EC
5500
60000
4000
50000
Energy for p
90000
2500
40000
1000
30000
-500
20000
150
170
190
210
230
250
270
Vmolar [cm3 mol-1]
Energy d
Energy h
Energy p
Fig. 4. The energy of dispersion and polar and hydrogen bonding vs. Vmolar. Note, the polar energy axis is on the right-hand side.
200
14.00
CA
175
10.00
Tg [oC]
CABI
8.00
150
CAP
EC
6.00
CABII
4.00
125
CABIII
100
Absorption [wt.%]
12.00
2.00
0.00
150
170
190
210
230
250
270
Vmolar [cm3 mol-1]
Fig. 5. Tg (circles) and water absorption (triangles) related to the Vmolar.
of dispersive force could be assumed to increase the Tg, as the side chain
length increases. In contrast, two factors should be noted in Fig. 6: first, a
steady increase of Tg for all δis are observed, independent of which δi that
is plotted, indicating that δd, has no exceptional position relative to other
δis even if this parameter accounts for an increase in the dispersion en
ergy, and, secondly, the Tg de facto decreases as the side chains become
longer and the dispersive energy increases. However, Fig. 5 shows that
as the lengths of the side chains increases, the Vmolar increases and the Tg
decreases, and therefore, Vmolar is the more dominating factor than the
addition of dispersion forces. The strong correlation for the esters in
Fig. 5 also indicates that an increased Vmolar causes an increased distance
between the hydrogen bonding sites, as well as a lowering the total
energy density (see δtot2 in Table 2), which likely increases the chain
mobility and thus decreases the Tg.
interacts via dipole-dipole interactions and hydrogen bond. These in
teractions are affected by the separation of water and the groups forming
hydrogen bonds, such as ester groups (-COO-), hydroxyl groups (-OH)
and ether groups (-O–). The decrease in water absorption with Vmolar
and the addition of methylene groups, which enhances the volume more
than the dispersion energy, explain why both water absorption and
permeation increase with all the HSP in Fig. 7.
Fig. S19 in the SI shows the water absorption plotted against the
differences in solubility parameters (Δδi) between the cellulose de
rivatives and water. There are two parts in this: (i) when Δδp and Δδh for
the materials increases, i.e. deviate more from the solubility parameters
of water and becomes less similar to water, the level of water absorption
decreases, which can be expected, and (ii), the opposite is observed for
the dispersive parameter Δδd. The behaviour for Δδd can be explained by
looking at CA. It has the largest value for Δδd and the largest water
absorption of the investigated cellulose derivatives due to the shortest
side chain causing the least screening of the hydrogen bonding between
the water and the hydrogen bonding domains in the polymer chains. As
previously discussed, this can be explained by that the dispersive forces
for cellulose derivatives increase the Vmolar more than dispersive in
teractions, see Eq. (5), resulting in a decrease in δd, and thus an increase
3.4.2. Water interactions related to HSP
The previous statement regarding the crucial distance between
hydrogen bonding groups is even more pertinent for water interactions
than for factors controlling the Tg. The water absorption was compared
to the Vmolar, Fig. 5, which shows, similar to Tg, that water absorption
decreases with increasing Vmolar. This can be explained by how water
8
R. Nilsson et al.
Carbohydrate Polymers 285 (2022) 119188
a
200
b
200
CA
175
CA
Tg [oC]
Tg [oC]
175
CABI
150
CAP
EC
CABII
125
CABI
150
CABII
CAP
125
CABIII
100
18.0
EC
CABIII
100
18.2
18.4
18.6
18.8
19.0
19.2
3.5
4.0
4.5
5.0
δd
c
200
5.5
6.0
6.5
δp
d
200
CA
CA
175
175
150
Tg [oC]
Tg [oC]
CABI
CAP
CABI
150
CAP
CABII
CABII
125
CABIII
100
10.0
125
EC
EC
CABIII
11.0
12.0
13.0
14.0
100
21.0
15.0
21.5
22.0
22.5
23.0
23.5
24.0
24.5
25.0
δtot
δh
Fig. 6. Tg for the cellulose derivatives and how it relates to a) δd, b) δp, c) δH and d) δtot.
14
4
EC
CA
CABI
2
6
CAP
4
1
18.2
18.4
18.6
18.8
3
CABIII
2
c
2
4.0
4.5
5.0
8
CABIII
CAP
CABII
Water permeation
[x10-12 m2 s-1]
10
6
6.5
13.0
14.0
16
14
12
4
0
15.0
2
CA
EC
8
6
CABIII
4
0
21.0
δh
10
CABI
3
1
2
12.0
6.0
5
Absorption [wt.%]
Water permeation
[x10-12 m2 s-1]
CA
CABI EC
11.0
5.5
d
6
14
4
0
10.0
4
0
3.5
16
4
1
6
CAP
0
12
2
8
δp
5
3
CA
CABI
δd
6
10
EC
CABII
0
19.2
19.0
12
4
1
2
CABIII CABII
0
18.0
8
14
CAP
CABII
21.8
Absorption [wt.%]
3
10
16
5
Water permeation
[x10-12 m2 s-1]
12
Absorption [wt.%]
Water permeation
[x10-12 m2 s-1]
5
b
6
16
Absorption [wt.%]
a
6
2
22.6
23.4
24.2
0
25.0
δtot
Fig. 7. Water absorption (blue squares) and water permeation (red circles) of the different cellulose derivatives related to a) δd, b) δp, c) δH and d) δtot.
in Δδd, and therefore is the water absorption increased when
Δδd increases.
Fig. 4 illustrates how the hydrogen binding energy is basically con
stant for the different cellulose derivatives. As water molecules interact
strongly via dipole-dipole interactions and hydrogen bonding, it may be
expected that the introduction of water into cellulose esters relates to the
two HSP that describe the interactions that originate from the perma
nent dipoles and their ability to form hydrogen bonds (δp and δh,
respectively). This is not the case here, however, indicating that the
hydrophobic side chains obstruct the water molecules from penetrating
the system and interacting with the hydrogen and polar groups located
closer to the backbone of the polymer.
As far as the Tg is concerned, the interactions involved between two
polymer chains have not been found to be dominated strongly by any
individual HSP. It seems that, instead, the increase in Vmolar, and thus
separation of the hydrogen and polar interacting groups, control both
the Tg and water absorption. The deviations seen in EC for Tg and water
absorption in the HSP and Vmolar plots suggest that making predictions
of properties within the same type of cellulose derivatives is more reli
able than making comparisons between different types of esters and
9
R. Nilsson et al.
Carbohydrate Polymers 285 (2022) 119188
ethers: this indicates that other tools, like molecular dynamic simula
tions, could be employed advantageously.
Acknowledgement
This project is financed partially by Formas, 2017-00648, and is
associated with Treesearch, BIOINNOVATION, VINNOVA, Sweden and
FibRe – Design for circularity – Lignocellulose-based thermoplastics, a
VINNOVA competence center.
4. Conclusions
This study shows that the total cohesive energy and the Vmolar of
cellulose esters increase upon the introduction of methylene groups,
while an increase in the calculated cohesive energy, based on the Hansen
model, is shown to decrease the Tg. The explanation suggested is that the
increase in Vmolar is greater than that of the cohesive energy, mainly
added by the dispersive interactions, resulting in lower energy densities
δtot2. The introduction of methylene groups to the cellulose acetates
creates a screening effect on the hydrogen bonding and polar in
teractions, which are short range interactions located close to the cel
lulose backbone. Thus, the change in the thermal properties can be
related to the HSP and explained further by focusing on its building
blocks, e.g. the Vmolar.
The contributions made by the hydrogen bonding and polar energies
to the cohesive energy are approximately constant for the cellulose de
rivatives in this study. This could have implied that the interactions with
water should have been similar, but CA absorbs more than six times
more water than CABIII. The addition of methylene groups decreases the
hydrogen bonding and polar forces through a screening effect caused by
the increase of the length of the side chains and thus increase in the
Vmolar, thereby explaining why water is hindered from penetrating into
cellulose esters with long carbon chains, like CABIII.
The HSP provide insight into the interactions between different
groups of cellulose esters and, to a certain degree, predict the effect of
the length of the carbon chain in the substituent. Based on ethyl cellu
lose, however, this model appears to lack the ability to predict, accu
rately and precisely, the properties of materials from their chemical
structure alone for all types of cellulose materials. This could be due to
the lack of structural considerations being taken, such as the position of
the groups relative to each other when calculating the HSP using the
group addition method, implying that further development of such
models is necessary.
This study shows that by choosing a number of methylene groups in
the side chain of cellulose derivatives, the thermal properties and water
interactions can be tailored. In summary, understanding how different
substituents in cellulose derivatives affect thermal properties and how
they interact and are affected by water can provide tools for tailoring
derivatives with specific properties and thus the possibility of trans
ferring from fossil-based to cellulose-based materials.
Appendix A. Supplementary data
Supplementary data to this article can be found online at https://doi.
org/10.1016/j.carbpol.2022.119188.
References
Akim, E. L. (2005). Interaction of cellulose and other polysaccharides with water
systems. Chemistry of Polysaccharides, 63(9), 221–293.
An, M., Zhang, Q., Ye, K., Lin, Y., Wang, D., Chen, W., … Li, L. (2019). Structural
evolution of cellulose triacetate film during stretching deformation: An in-situ
synchrotron radiation wide-angle x-ray scattering study. Polymer, 182(June).
/>Andersson, H., Hă
abel, H., Olsson, A., Sandhagen, S., von Corswant, C., Hjă
artstam, J.,
Persson, M., & Stading, Larsson (2016). The influence of the molecular weight of the
water-soluble polymer on phase-separated films for controlled release. International
Journal of Pharmaceutics. ISSN: 0378-5173, 511(1), 223–235. />10.1016/j.ijpharm.2016.06.058
Andrade Alves, J. A., Lisboa dos Santos, M. D., Morais, C. C., Ramirez Ascheri, J. L.,
Signini, R., dos Santos, D. M., … Ramirez Ascheri, D. P. (2019). Sorghum straw:
Pulping and bleaching process optimization and synthesis of cellulose acetate.
International Journal of Biological Macromolecules, 135, 877–886. />10.1016/j.ijbiomac.2019.05.014
Asai, T., Taniguchi, H., Kinoshita, E., & Nakamura, K. (2001). Thermal and mechanical
properties of cellulose acetates with various degrees of acetylation in dry and wet
states. Recent Advances in Environmentally Compatible Polymers, 275–80. https://doi.
org/10.1533/9781845693749.5.275
Ashley, R. J. (1985). Permeability and Plastics Packaging. in Polymer Permeability. In
J. Comyn (Ed.) (pp. 269–308). Springer Netherlands. />Bochek, A. M., & Petropavlovsky, G. A. (1993). Cellulose solubility parameters. Cellulose
Chemistry and Technology, 27, 587–596.
Boy, R. E., Schulken, R. M., & Tamblyn, J. W. (1967). Crystallinity in secondary esters.
Journal of Applied Polymer Science, 11, 2453–2465.
Cao, Y., Jin, W., Meng, T., Zhang, J., He, J., Li, H., & Zhang, Y. (2007). Acetone-soluble
cellulose acetates prepared by one-step homogeneous acetylation of cornhusk
cellulose in an ionic liquid 1-allyl-3-methylimidazolium chloride (AmimCl).
Carbohydrate Polymers, 69(4), 665–672. />carbpol.2007.02.001
Cerqueira, D. A., Filho, G. R., & Assunỗ
ao, R. M. N. (2006). A new value for the heat of
fusion of a perfect crystal of cellulose acetate. Polymer Bulletin, 56(4–5), 475–484.
/>Elidrissi, A., Barkany, S. E., Amhamdi, H., Maaroufi, A., & Hammouti, B. (2012). New
approach to predict the solubility of polymers application: Cellulose acetate at
various DS, prepared from Alfa ‘Stipa -tenassicima’ of Eastern Morocco. Journal of
Materials and Environmental Science, 3(2), 270–285.
Filho, R., Guimes, D. S. M., da Silva Meireles, C., de Assunỗ
ao, R. M. N., Cerqueira, D. A.,
Barud, H. S., … Messadeq, Y. (2008). Synthesis and characterization of cellulose
acetate produced from recycled newspaper. Carbohydrate Polymers, 73(1), 74–82.
/>Gabor, (. N.). D., & Tita, O. (2012). Biopolymers used in food packaging: A review. Acta
Universitatis Cibiniensis Series E: Food Technology, XVI(2), 319.
Gồrdebjer, S., Andersson, M., Engstră
om, J., Restorp, P., Persson, M., & Larsson, A. (2016).
Using Hansen solubility parameters to predict the dispersion of nano-particles in
polymeric films. Polymer Chemistry, 7(9), 1756–1764. />c5py01935d
Gårdebjer, S., Gebă
ack, T., Andersson, T., Fratini, E., Baglioni, P., Bordes, R., Virid´en, A.,
Nicholas, M., Lor´en, N., & Larsson, A. (2016). The impact of interfaces in laminated
packaging on transport of carboxylic acids. Journal of Membrane Science, 518,
305–312. />Gårdebjer, S., Larsson, M., Gebă
ack, T., Skepă
o, M., & Larsson, A. (2018). An overview of
the transport of liquid molecules through structured polymer films, barriers and
composites – Experiments correlated to structure-based simulations. Advances in
Colloid and Interface Science. />Gu, Y., Wang, C., & Russell, T. P. (2012). Multi-length-scale morphologies in PCPDTBT/
PCBM bulk-heterojunction solar cells. Advanced Energy Materials, 2(6), 683–690.
/>Hadi, N. A., Wiege, B., Stabenau, S., Marefati, A., & Rayner, M. (2020). Comparison of
three methods to determine the degree of substitution of quinoa and rice starch
acetates, propionates, and butyrates: Direct stoichiometry, FTIR, and 1H-NMR.
Foods, 9(1). />Hansen, C. M. (2007). Hansen Solubility Parameters: A User’s Handbook (2nd ed.). CRC
Press. />
CRediT authorship contribution statement
Robin Nilsson: Conceptualization, Methodology, Validation,
Formal analysis, Investigation, Resources, Data curation, Writing –
original draft, Writing – review & editing, Visualization. Martina Ols
son: Methodology, Validation, Formal analysis, Investigation, Writing –
review & editing, Visualization. Gunnar Westman: Methodology,
Formal analysis, Writing – review & editing, Visualization, Supervision.
Aleksandar Matic: Methodology, Formal analysis, Writing – review &
editing, Supervision, Funding acquisition. Anette Larsson: Conceptu
alization, Methodology, Formal analysis, Resources, Data curation,
Writing – original draft, Writing – review & editing, Supervision, Project
administration, Funding acquisition.
Declaration of competing interest
The authors declare that they have no known competing financial
interests or personal relationships that could have influenced the work
reported in this paper.
10
R. Nilsson et al.
Carbohydrate Polymers 285 (2022) 119188
Ong, R. C., Chung, T. S., Helmer, B. J., & De Wit, J. S. (2012). Novel cellulose esters for
forward osmosis membranes. Industrial and Engineering Chemistry Research, 51(49),
16135–16145. />Ong, R. C., Chung, T. S., Helmer, B. J., & De Wit, J. S. (2013). Characteristics of water
and salt transport, free volume and their relationship with the functional groups of
novel cellulose esters. Polymer, 54(17), 4560–4569. />polymer.2013.06.043
Qiao, Z., Wang, Z., Zhang, C., Yuan, S., Zhu, Y., & Wang, J. (2012). PVAm–PIP/PS
composite membrane with high performance for CO2/N2 separation. AIChE Journal,
59(4), 215–228. />Ramanaiah, S., Reddi Rani, P., & Reddy, K. S. (2012). Hansen solubility parameters for
the solid surface of cellulose acetate propionate by inverse gas chromatography.
Journal of Macromolecular Science, Part B: Physics, 51(11), 2191–2200. https://doi.
org/10.1080/00222348.2012.669681
Ramanaiah, S., Reddi Rani, P., Sreekanth, T. V. M., & Reddy, K. S. (2011). Determination
of Hansen solubility parameters for the solid surface of cellulose acetate butyrate by
inverse gas chromatography. Journal of Macromolecular Science, Part B, 50(3),
551–562. />Reid, D. S., & Levine, H. (1991). Beyond water activity: Recent advances based on an
alternative approach to the assessment of food quality and safety. Critical Reviews in
Food Science and Nutrition, 30(2–3), 115–360. />10408399109527543
Schuetzenberger, P., Dreyfus, C., & Dreyfus, H. (2016). CA cellulose acetate. In
George Wypych (Ed.), Handbook of Polymers (2nd, pp. 33–38). ChemTec. https://doi.
org/10.1016/B978-1-895198-92-8.50012-4.
Sun, X., Canhui, L., Zhang, W., Tian, D., & Zhang, X. (2013). Acetone-soluble cellulose
acetate extracted from waste blended fabrics via ionic liquid catalyzed acetylation.
Carbohydrate Polymers, 98(1), 405–411. />carbpol.2013.05.089
Teramoto, Y. (2015). Functional thermoplastic materials from derivatives of cellulose
and related structural polysaccharides. Molecules, 20(4), 5487–5527. https://doi.
org/10.3390/molecules20045487
Trifol, J., Plackett, D., Szabo, P., Daugaard, A. E., & Baschetti, M. G. (2020). Effect of
crystallinity on water vapor sorption, diffusion, and permeation of PLA-based
nanocomposites. ACS Omega, 5(25), 15362–15369. />acsomega.0c01468
van Krevelen, D. W., & Nijenhuis, K. T. (2009). Cohesive properties and solubility.
Properties of Polymers, i. />van den Mooter, G., Samyn, C., & Kinget, R. (1994). Characterization of colon-specific
azo polymers: A study of the swelling properties and the permeability of isolated
polymer films. International Journal of Pharmaceutics, 111(2), 127–136. https://doi.
org/10.1016/0378-5173(94)00102-2
van Krevelen, D. W. (1990). Properties of polymers: Their correlation with chemical structure;
their numerical estimation and prediction from additive group contributions. Elsevier. 10
.1016/B978-0-444-82877-4.50014-7.
Viriden, A., Larsson, A., Schagerloef, H., & Bengt, W. (2010). Model drug release from
matrix tablets composed of HPMC with different substituent heterogeneity.
International Journal of Pharmaceutics, 401(1–2), 60–67. />ijpharm.2010.09.017
Wypych, G. (2016). CAB cellulose acetate butyrate. In , 39–42. Handbook of polymers.
/>Zhang, S., Zhang, R., Jean, Y. C., Paul, D. R., & Chung, T. S. (2012). Cellulose esters for
forward osmosis: Characterization of water and salt transport properties and free
volume. Polymer, 53(13), 2664–2672. />polymer.2012.04.024
Hikichi, K., Kakuta, Y., & Katoh, T. (1995). 1H NMR study on substituent distribution of
cellulose diacetate. Polymer Journal, 27(7), 659663. />polymj.27.659
Hjă
artstam, J., & Hjertberg, T. (1999a). Effect of hydroxyl group content in ethyl cellulose
on permeability in free films and coated membranes. Journal of Applied Polymer
Science, 72(4), 529535. />4<529::aid-app9>3.3.co;2-w
Hjă
artstam, J., & Hjertberg, T. (1999b). Studies of the water permeability and mechanical
properties of a film made of an ethyl cellulose-ethanol-water ternary mixture.
Journal of Applied Polymer Science, 74(8), 2056–2062. />(SICI)1097-4628(19991121)74:8<2056::AID-APP21>3.0.CO;2-Y
Hu, H., Li, H., Zhang, Y., Chen, Y., Huang, Z., Huang, A., Zhu, Y., Qin, X., & Lin, B.
(2015). Green mechanical activation-assisted solid phase synthesis of cellulose esters
using a co-reactant: Effect of chain length of fatty acids on reaction efficiency and
structure properties of products. RSC Advances, 5(27), 20656–20662. https://doi.
org/10.1039/c5ra02393a
Huang, K., Wang, B., Cao, Y., Li, H., Wang, J., Lin, W., Chaoshi, M., & Liao, D. (2011).
Homogeneous preparation of cellulose acetate propionate (CAP) and cellulose
acetate butyrate (CAB) from sugarcane bagasse cellulose in ionic liquid. Journal of
Agricultural and Food Chemistry, 59(10), 5376–5381. />jf104881f
Klemm, D., Heublein, B., Fink, H. P., & Bohn, A. (2005). Cellulose: Fascinating
biopolymer and sustainable raw material. Angewandte Chemie - International Edition,
44(22), 3358–3393. />Kono, H., & Numata, J. (2020). Substituent distribution of propyl cellulose studied by
nuclear magnetic resonance. Carbohydrate Research, 495(May), Article 108067.
/>Kreibch, U. T., & Batzer, H. (1979). Einfluß Der Segmentstruktur Und Der Vernetzung Auf
Den Glasübergang Tg. Mă
oglichkeiten Der Vorausberechnung von Tg ĩber Die
Kohă
asionsenergie Ecoh. Die Angewandte Makromolekulare Chemie, 83(1), 57112.
/>Larsson, M., Hjă
artstam, J., Berndtsson, J., Stading, M., & Larsson, A. (2010). Effect of
ethanol on the water permeability of controlled release films composed of ethyl
cellulose and hydroxypropyl cellulose. European Journal of Pharmaceutics and
Biopharmaceutics, 76(3), 428–432. />Lee, W. G., Kim, D. Y., & Kang, S. W. (2018). Porous cellulose acetate by specific solvents
with water pressure treatment for applications to separator and membranes.
Macromolecular Research, 26(7), 630–633. />Li, H., Kruteva, M., Mystek, K., Dulle, M., Ji, W., Pettersson, T., & Wågberg, L. (2020).
Macro- and microstructural evolution during drying of regenerated cellulose beads.
ACS Nano, 14(6), 6774–6784. />Lindblad, M. S., Keyes, B. M., Gedvilas, L. M., Rials, T. G., & Kelley, S. S. (2008). FTIR
imaging coupled with multivariate analysis for study of initial diffusion of different
solvents in cellulose acetate butyrate films. Cellulose, 15(1), 23–33. />10.1007/s10570-007-9173-5
Lonsdale, H. K., Merten, U., & Riley, R. L. (1965). Transport properties of cellulose
acetate osmotic membranes. Journal of Applied Polymer Science, 9(4), 13411362.
/>Maciejewski, B., Stră
om, A., Larsson, A., & Sznitowska, M. (2018). Soft gelatin films
modified with cellulose acetate phthalate pseudolatex dispersion-structure and
permeability. Polymers, 10(9). />Ong, R. C., & Chung, T. S. (2012). Fabrication and positron annihilation spectroscopy
(PAS) characterization of cellulose triacetate membranes for forward osmosis.
Journal of Membrane Science, 394–395, 230–240. />memsci.2011.12.046
11