A structural study of Acacia nilotica and Acacia modesta gums
Bạn đang xem bản rút gọn của tài liệu. Xem và tải ngay bản đầy đủ của tài liệu tại đây (1.79 MB, 9 trang )
Carbohydrate Polymers 175 (2017) 207–215
Contents lists available at ScienceDirect
Carbohydrate Polymers
journal homepage: www.elsevier.com/locate/carbpol
A structural study of Acacia nilotica and Acacia modesta gums
Shazma Massey a , William MacNaughtan b,∗ , Huw E.L. Williams c , Bettina Wolf b ,
Mohammad S. Iqbal a,∗
a
b
c
Department of Chemistry, Forman Christian College, Lahore 54600, Pakistan
Division of Food Sciences, School of Biosciences, University of Nottingham, Sutton Bonington Campus, Loughborough LE12 5RD, UK
Centre for Biomolecular Sciences, School of Biosciences, University Park, University of Nottingham, NR7 2RD, UK
a r t i c l e
i n f o
Article history:
Received 28 February 2017
Received in revised form 20 July 2017
Accepted 21 July 2017
Available online 24 July 2017
Keywords:
Arabinans
Acacia modesta
Acacia nilotica
Polysaccharides
NMR spectroscopy
a b s t r a c t
Superficially similar carbohydrate polymers from similar sources can have dramatically different characteristics. This work seeks to examine the molecular properties responsible for these differences. Protons
responsible for cross-polarization in the anomeric region of Acacia nilotica (AN) were replaced easily by
deuterium, but not for Acacia modesta (AM). Time constants describing the mobility and cross-polarization
transfer were both found to be lower for AM. Variable contact time experiments showed poorer fits and
more heterogeneity for AN. Solution state HSQC experiments showed a lower number of environments
in the anomeric region for AM. The relaxation time T2 of AM solutions had a lower value consistent with
a higher viscosity. The Tg of solutions were −14.5 ◦ C AN and −18.5 ◦ C AM. These results form a largely
self-consistent picture of molecular differences between AN and AM, suggesting a more compact but
heterogeneous structure for AN and more branching in the case of AM.
© 2017 The Author(s). Published by Elsevier Ltd. This is an open access article under the CC BY license
( />
1. Introduction
Gum acacia, also known as gum Arabic (E number E 414), is an
edible polysaccharide used in the food, pharmaceutical, cosmetic
and textile industries, as an emulsifying, suspending and stabilizing
agent. Acacia modesta (AM) and Acacia nilotica (AN) are two common varieties of the gum obtained from two species of acacia plant.
AM gum, also known as gum Acacia senegal or gum phulai in South
Asia, is the main source of gum Arabic presently used in Industry.
This material has been extensively studied and attempts have been
made to determine its monosaccharide composition and macromolecular structure using monosaccharide analysis, FT-IR and NMR
spectroscopy after hydrolysis of the polymeric materials. Tischer,
Gorin, and Iacomini (2002) and Sanchez et al. (2008) reported that
acacia gum is a heavily branched polysaccharide containing mainly
arabinose and galactose with minimal quantities of rhamnose and
other monosaccharides and having a main chain consisting of
1,3 linked -d-galactopyranosyl units with lesser amounts of ␣l-arabinofuranose and other residues, together with a variety of
∗ Corresponding authors.
E-mail addresses: (S. Massey),
(W. MacNaughtan),
(H.E.L. Williams),
(B. Wolf), ,
(M.S. Iqbal).
linkages in the side chains including ␣-d-Galp-(1 → 3)-␣-l-Araf,
␣-l-Araf-(1 → 4)--d-Galp and -d-Galp-(1 → 6)-␣-d-Galp. It is
also defined as a heteropolysaccharide as it contains a significant
fraction (above 2%) of polypeptide. Grein et al. (2013) studied the
emulsifying properities of a commercial gum Arabic as well as Acacia mearnsii de Wild gum and concluded that these were dependent
on the structure of the polysaccharide, such as the degree of branching, as well as the protein content and molecular weight of the
carbohydrate/protein complexes. Interestingly these authors also
noticed a difference in the number of anomeric environments as
measured by 2D NMR between the two gums.
On the other hand, very little structural information is available
in the literature regarding AN gum. AN gum, also known as gum
kikar in the South Asia, has been reported to possess similar functional properties to AM. AN gum is available at less than half the
price of AM gum, and would, therefore, offer a significant saving to
industry if the properties were comparable.
AN gum is almost completely, but very slowly, soluble in water
and practically insoluble in alcohol. The solution is colorless or yellowish, dense, adhesive and translucent. It has been reported to be
a branched-chain polysaccharide containing mainly arabinose and
galactose with some uronic acid and trace amounts of rhamnose
(Kapoor & Farooqi, 1991). In this study the authors compared 1D 13 C
NMR spectral patterns of gums obtained from different habitats and
did not deal with the spectral assignments in detail. The molar mass
of AN gum has been reported to range from 0.8 × 10⁶ to 2.3 × 10⁶
/>0144-8617/© 2017 The Author(s). Published by Elsevier Ltd. This is an open access article under the CC BY license ( />
208
S. Massey et al. / Carbohydrate Polymers 175 (2017) 207–215
Daltons (Gómez-Díaz, Navaza, & Quintáns-Riveiro, 2008). Physical
appearance of the two gums is different; AN being of round crystalloid nature and AM having the form of L-shaped flexible rods. This
fact suggests variation in their secondary structure. Such structural
differences can be investigated through a standard set of multidimensional NMR experiments. However, these experiments are
difficult to apply to carbohydrates as the chemical environments
are so similar that there is often insufficient information to define
robust 3D structures. An NMR study as presented here in combination with other techniques, could enable important structural
features of the materials to be determined. The structural information may enable the further development of the use of these
gums in areas such as the food industry, targeted drug delivery,
nanomedicine and tissue engineering.
The hypothesis underpinning this research is that information from a series of techniques including NMR, when considered
together can provide useful information concerning structural differences between carbohydrate gums.
2. Experimental
2.1. Materials
AM and AN gums were sourced from herbal product shops in
local markets in Lahore, Pakistan and purified (procedure available in Supplementary Data). The chemicals and reagents used
were: deuterium oxide (PubChem CID: 24602), l-(+)-arabinose
(PubChem CID: 439195), d-(+)-galactose (PubChem CID: 6063) and
l-rhamnose monohydrate (PubChem CID: 25310) (Sigma-Aldrich,
USA); BCA protein assay reagent A and B (cat # 23228 and 23224
respectively, Thermo Scientific, Pierce, USA); and albumin standard
(cat # 23209, Thermo Scientific, Pierce, USA). All the chemicals
were used without further purification. Distilled water was used
throughout this study.
2.2. Analytical and viscosity methods
The monosaccharide analysis procedure and High Performance
Liquid Chromatography (HPLC) chromatograms are available in the
Supplementary Data. These were performed as reported previously
(Massey, Iqbal, Wolf, Mariam, & Rao, 2016). Gel permeation chromatography (GPC) chromatograms are similarly available. These
methods show the presence of low levels of other monosaccharides and higher molecular weight materials. The viscosity
determinations used a double-gap cylinder geometry (details in
Supplementary Data). Over a shear range from 10−2 to 104 s−1 both
polysaccharides showed Newtonian behavior. The viscosity values
are low demonstrating that the primary function of these polymers
would not be as viscosity enhancers.
2.3. NMR study
NMR spectra were obtained in the solid state (13 C cross
polarization magic angle spinning, CPMAS) and in solution (multidimensional 1 H and 13 C). 13 C NMR spectra of pure arabinose,
galactose, and rhamnose monohydrate, were also recorded in the
solid state as references. As the gums were soluble in water 1D and
2D NMR measurements were made in D2 O.
The original protonated material (2.0 g) was dissolved in D2 O
(20 mL), freeze-dried, redissolved in D2 O (20 mL), freeze-dried
again and finally dissolved in D2 O (20 mL). The original protonated
material and the dried deuterated sample after the second freezedrying stage were used for the solid state NMR measurements.
2.3.1. Solid state experiments
13 C CPMAS NMR spectra were recorded on a Bruker AVANCE III
600 NMR spectrometer with narrow bore magnet and 4-mm triple
resonance probe. The parameters and conditions used in CPMAS
experiments were: proton 90◦ pulse length 3 s, field strength of
the proton and spin locking fields during the contact period 83 kHz.
The samples were packed into 4-mm rotors and spun at 10 kHz.
Chemical shifts (ppm) scales were referenced to the upfield peak
of adamantane (29.5 ppm) run as an external standard.
Proton decoupling was provided by a Spinal-64 sequence and
the proton power levels during the contact time and decoupling
stage could be varied independently to provide optimum signalto-noise levels. The highest intensity signal for all types of bonded
carbons in these materials lies between a contact time of 1 and 2 ms.
For all CPMAS experiments a value of 2 ms was used. Recycle delay
was 2 s.
2.3.2. Variable contact time experiments
Cross-polarization involves the transfer of polarization from
proton to carbon for a set period known as the contact time. The
carbon signal increases with contact time up to a maximum with
the time constant of the increase reflecting the number of protons
in the immediate neighborhood of, and distance from the carbon
as well as the solidity of the sample. After the maximum signal the
decay constant is the proton T1 value which gives useful information on the mobility of the system as well as the degree of
cross-transfer between protons on various parts of the molecule.
By using approximately 15 values of logarithmically spaced contact time, the envelope of the rise and fall of the carbon intensity
can be measured and estimates of the decay constants obtained.
2.3.3. Solid state data processing
Approximately 5k of data points were normally recorded. On
data processing this data set was zero-filled by at least a factor
of 2. A Lorentzian line broadening (15 Hz) was then applied. The
data were Fourier-transformed and phased with zero and first order
corrections. Baseline fitting routines were applied to all spectra.
Mobility measurements were made by integrating defined regions
across a series of spectra corresponding to different contact times.
The resulting areas were used to obtain optimal decay constants by
®
fitting (Solver, Microsoft Excel ) the area data to the equation:
M = I 0 /(1- T IS /T 1 )[exp(–t/ T 1 ) − exp(–t/T IS )]
(1)
where, I0 = signal intensity, TIS = time constant of polarization transfer and T1 = proton time constant in the rotating frame, reflecting
proton mobility
2.3.4. High resolution NMR
All 1D and 2D NMR experiments were carried out on a Bruker
800 MHz Avance III spectrometer equipped with a QCI cryoprobe.
For each sample the 90◦ pulse and transmitter frequency were
calibrated. The number of scans collected in each dimension for
each experiment was determined by the sample concentration.
Data acquisition and processing were carried out using Topspin 3.1
software. The 1D experiments were apodized using an exponential window function with 2 Hz line broadening. For 2D datasets a
shifted squared sine bell was used with the offset being optimized
to achieve the best balance between resolution and signal-to-noise
ratio. All data were zero-filled by at least a factor of 2. For heteronuclear dimensions linear prediction was employed.
2.3.4.1. 1D experiments. The 1D 1 H NMR spectra were recorded
using a 1D NOESY sequence with a spectral width of 14 ppm
using on-resonance presaturation for water suppression. The pro-
S. Massey et al. / Carbohydrate Polymers 175 (2017) 207–215
ton transmitter frequency was set to 4.702 ppm and typically 64
scans were acquired.
2.3.4.2. 2D experiments. The 2D 13 C[H] HSQC spectra were acquired
over a spectral width of 14 ppm in the 1 H dimension and 200 ppm
in the 13 C dimension. The transmitter frequency for carbon was
centered at 100 ppm and between 16 and 64 scans were acquired,
with 128 complex points in f1 . Quadrature detection in the carbon
channel was achieved using the States-TPPI method.
2.3.5. Low resolution 1 H NMR relaxation
Low resolution 1 H NMR was carried out on Resonance Instruments Maran benchtop spectrometer (RI, Oxford UK) operating at
23 MHz. The 90◦ pulse lengths were approximately 3 s with recycle delay times of 4 s. T2 values were determined using a Carr Purcell
Gill Meiboom (CPMG) pulse sequence with a value of 64 s and
typically 2048 echoes. Data was fitted to single exponential decay
curves using Resonance Instruments software. T1 measurements
were made using an inversion recovery pulse sequence with appropriately chosen delay times and used to determine the optimal
recycle delay. Measurements were made at a series of dilutions
(approximately 40, 20 and 10% solids w/w) and at different temperatures (37, 20 and 4 ◦ C). The NMR measurements were also made
on samples dissolved in D2 O resulting in partial replacement of the
exchangeable proton fraction and used to estimate the relaxation
behavior of the non-exchangeable proton fraction.
2.3.5.1. Form of the relaxation model. A simple combined relaxation
and chemical exchange model for protons on the biopolymer and
water sites can be described by combining the Bloembergen, Pound
Purcell (BPP) (Bloembergen, Purcell, & Pound, 1948) theory with a
modified Swift Connick/Carver Richards two site exchange model
(Swift & Connick, 1962; Carver & Richards, 1972). Under the limiting conditions of short value and low sample concentration the
fundamental equation describing exchange reduces to (McConville
& Pope, 2001):
1/T 2measured = (1–P)/T 2water + P/(T 2gum +
exchange )
(2)
where, P is the gum concentration, 1/ exchange is the exchange rate
(k), and T2gum and T2water are the respective T2 values for the gum
and water. The T2 values can be predicted by BPP theory according
to:
1/T 2 = C/2[3
c
+5
c /1+ω0
2
c 2 + 2
c /1+4ω0
2
c 2 )
(3)
where, ω0 is the spectrometer frequency, c is the correlation time
and C is the magnetic dipolar interaction constant. Moreover the
dependence of the correlation time (or rate of exchange) on temperature can be assumed to be thermally activated and follow an
Arrhenius law as:
c
=
−(Ea/kT )
0e
(4)
Proton densities of water and the carbohydrate gum have been
assumed to be 0.111 and 0.062, respectively. It is interesting to
note that systems showing predominantly relaxation or exchange
behavior exhibit an opposite temperature dependency (Ibbett,
Schuster, & Fasching, 2008). T2 values for the polymer can be
crudely estimated from D2 O exchange experiments and from the
multi-exponential nature of the decay curve where the initial decay
is assumed to be close to non-exchangeable protons on the carbohydrate. An approximate correction has been applied for the
fraction of exchangeable protons in the carbohydrate (0.3).
2.4. Differential scanning calorimetry (DSC)
DSC analysis was carried out by heating 40% w/v solutions of
the materials at 1 and 5 ◦ C min−1 from −50 to +80 ◦ C. Initial cooling
209
from ambient temperature (20 ◦ C) to −50 ◦ C was carried out at a
nominal rate of 50 ◦ C min−1 . Thermal transitions were monitored
using a pre-calibrated heat flux Mettler Toledo DSC 823e (Leicester, UK) equipped with an autosampler and a liquid nitrogen cooling
attachment. Samples were hermetically sealed in standard Mettler
Toledo 40 uL aluminum pans. Glass transition temperature (Tg ) val®
ues were calculated using Mettler Toledo Star software. The Tg
value is the glass transition of the maximally freeze-concentrated
state and was assumed to occur at the same temperature as the step
observed before the major melting peak of ice. The term Tg refers
to a general glass transition.
3. Results and discussion
Yields of the purified gums were approximately 98%. The elemental analysis, FT-IR, monosaccharide analysis, protein analysis
and GPC data conformed to those of typical samples of AN and
AM (Massey et al., 2016). Additional chromatographic and viscosity data and methods are included in the Supplementary Data. The
molecular mass of the most abundant species measured using light
scattering was found to be 1.20 × 10⁶ for AM, similar to but slightly
greater than the 9.06 × 10⁵ value for AN.
3.1. NMR study
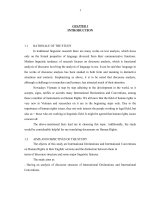
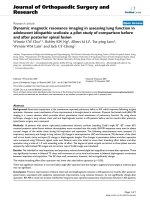
The solid state 13 C NMR spectra of monosaccharides are shown
in Fig. 1a, and the spectra of protonated (original) material and the
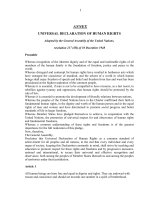
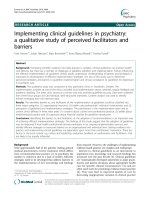
deuterium exchanged samples are presented in Fig. 1b. 1 H NMR
spectra of AM and AN in D2 O are shown in Fig. 2a. HSQC plots for
both gums are shown in Fig. 2b and c. A magnified trace shows the
superimposed anomeric regions with the complete spectra shown
as separate inserts.
3.1.1. Solid state NMR
The CPMAS spectra of the dominant monosaccharides present in
the gums exhibit sharp peaks, as all of the chemical environments
for each of the particular chemical class of carbons are uniform due
to the crystallinity of the materials. Fig. 1b shows that when these
sugars are linked in a carbohydrate structure in solid (powder)
form, there are many different environments due to different conformations adopted by the sugar units, which produce wider peaks.
Fig. 1b also shows that deuterium substitution had a larger effect
on AN compared with that on AM, and changed the peak intensities
in the spectrum. In the case of AN there are exchangeable protons
in close proximity to the corresponding carbons on the sugar units,
having chemical shifts at approximately 100 ppm (C1) and 65 ppm
(C6) and to a lesser extent in the region 80–90 ppm (C4). These protons are responsible for substantial magnetization transfer in the
CPMAS process and hence larger peaks were observed. These have
been largely replaced in the partial proton replacement and freezedrying experiment. This behavior is not seen with AM suggesting
that there are fairly major differences in the 3D structures of the
two materials in the solid state. Whether this structure is carried
through to the liquid state is impossible to say from the high resolution experiments presented here. There also appear to be two
different chemical shift environments for the carbon in the methyl
group of the rhamnose as shown by the double peak in the methyl
region. This was also observed in solution.
3.1.2. Mobility of gums in the solid state
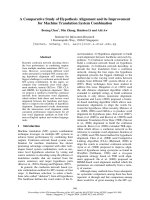
Variable contact time plots for the protonated materials are
shown in Fig. 3 and the series of decay constants are listed in Table 1.
The moisture and D2 O contents of all the four samples were similar.
The first observation concerns the poorer fits to Eq. (1) in case of
AN compared with AM. The fit to the early part of the curve is poor
210
S. Massey et al. / Carbohydrate Polymers 175 (2017) 207–215
Fig. 1. a) 13 C CPMAS spectra of crystalline monosaccharides; b) 13 C CPMAS spectra of protonated and D exchanged AN and AM. Abbreviations A: uronic acid, p: pyranose and
f: furanose. The intensities are relative.
Table 1
Upper: Solid state variable contact time decay constants TIS and T1 and overall intensity I0 of specified peaks. See also Fig. 3 for fits to most intense peaks. Lower: Parameters
used for the Relaxation fits in Fig. 4. Water parameters were determined independently using 0 = 1.4060 × 10⁻¹⁴ s and Ea = 18.2 kJmol-1 .
␦ range (ppm)
165–190
100–120
90–100
80–90
65–80
50–65
20–30
10–20
Material
AN
AM
AN untreated
AN D2 O-treated
AM untreated
AM D2 O-treated
I0
TIS (s)
T1 (ms)
I0
TIS (s)
T1 (ms)
I0
TIS (s)
T1 (ms)
I0
TIS (s)
T1 (ms)
0.035
0.138
0.162
1.057
3043
109
104
96
5.4
9.5
12
11.7
0.043
0.372
2408
109
5
9.1
0.041
0.287
1199
82
4.5
4.6
0.056
0.3
2510
77
2.5
4.4
1.114
71
4.8
1.116
69
4.6
0.148
0.034
0.02
62
3.7
195
5.2
195
4.8
0 exchange (s)
2.0 × 10⁻⁵
Low value
0.244
83
11.2
0.004
134
1.2
–
–
–
0 untreated polymer (s)
6.1 × 10⁻¹⁴
9.8 × 10⁻¹¹
0.364
88
8.6
1.058
89
10.5
0.275
67
9.8
0.012
246
4.1
–
–
–
Ea untreated polymer (kJmol-1 )
26.4
16.3
0.173
60
0.227
232
0.024
224
Ea exchange (kJmol-1 )
15.9
–
3.5
4.0
3.8
S. Massey et al. / Carbohydrate Polymers 175 (2017) 207–215
211
Fig. 2. a) 1 H spectra of AM (upper) and AN (lower) in D2 O. b) HSQC plots (all regions) of AN (red) and AM (blue). c) HSQC plots of AN (blue) and AM (red) showing the
superimposed anomeric region. (For interpretation of the references to colour in this figure legend, the reader is referred to the web version of this article.)
212
S. Massey et al. / Carbohydrate Polymers 175 (2017) 207–215
1.2
fit equation1
experiment
1
Intensity
0.8
0.6
0.4
0.2
0
b)
time in microseconds
1.2
fit equation1
experiment
1
Intensity
0.8
0.6
0.4
0.2
0
0
2000
4000
6000
8000
10000
12000
Fig. 3. Quality of fit to Eq. (1), for variable contact time experiments on protonated AN (a) and AM (b). The most intense peak, representing a combination of different ring
carbons, in the region 65–90 ppm, was selected to demonstrate the fitting procedure.
and any attempt to fit this part better causes a worse fit to the later
curve. The complete envelope is better fitted using two (or multi)component (short and long) TIS decay constants. This suggests that
in case of AN the structure in the solid state is either less regular in
the sense that the protons from other parts of the molecule in the
3D structure seem to be close enough to a carbon atom to transfer magnetization or there is simply much more variation in the
structure i.e. more irregularity in the carbohydrate sequence and
side groups of the main chain. This produces the multi-component
nature of the initial part of the curve. It must be borne in mind that
the integration region for the areas used in the fitting encompasses
contributions from several carbons which may have different properties and so cause an apparent multicomponent fit. Nevertheless
differences are still observed between the two gums and is evidence
for heterogeneity in the structure of AN.
The other obvious feature of interest is the HT 1 values. These are
uniformly less in case of AM as compared with those in AN (Fig. 3a
and b, Table 1). As these materials are essentially at the same moisture (D2 O or H2 O) content, this implies that there is more mobility
in the AM spin system. This is perhaps consistent with a more disorganized tangled structure with higher free volume and a polymer
having a more branched nature, despite the increased inhomogeneity of AN as detected by other properties. Interestingly the 2D NMR
also shows broader peaks in case of AM.
3.1.3. High resolution NMR
The monosaccharide analysis indicated that AM was composed
of 68.0% arabinose, 30.0% galactose, and 1.8% rhamnose, while AN
was composed of 75.0% arabinose and 25.0% galactose (details
available in the Supplementary Data). The starting point for the
high resolution NMR analysis was the comparison of the two
anomeric regions in the HSQC 2D plots for the two polysaccharides
together with the identification of any distinct resonances which
could be easily assigned to particular sugars such as the carbons
in the methyl groups in rhamnopyranose. Broadly speaking chemical shifts greater than 105 ppm indicate the presence of anomeric
C1 linked carbons in ␣-arabinose in the furanose form, whilst shifts
less than this primarily indicate the presence of anomeric C1 linked
S. Massey et al. / Carbohydrate Polymers 175 (2017) 207–215
213
Fig. 4. Fits to the relaxation data. CPMG data with a value of 64 s were used. Fits were optimized over each complete data set using the calculated water and polymer
proton concentrations of the dilutions (approximately 40, 20 and 10% polymer). An independent value for the T2 of water was measured for each temperature and used for
optimization.
carbons in ˇ-d-galactopyranose linked residues, as has been found
in other carbohydrates (Kang et al., 2011).
In the HSQC plots, each cross peak has carbon and proton coordinates corresponding to the chemical shifts of a 13 C and its directly
bonded proton. The high-field cross peaks at ␦ = 1.19 (CH3 ) and
at ␦ = 17.43 (CH3 ) are consistent with the presence of rhamnopyranose (Rhap) units in the polysaccharide (Capeka, Matulováa &
Kardoˇsováa, 1997). In the solid state, the 13 C signals with low intensities in the region of ␦ = 20 ppm are due to CH3 on Rhap and those
at 175 ppm in AM and 178 ppm in AN are consistent with a COOH
on a galactopyranose (GalA). The peaks at ␦ = 20 ppm are consistent
with the monosaccharide analysis, where Rhap is present in AM
(2%) and at very low levels in AN.
The appearance of 13 C signals due to C-1 and C-5 in arabinose
furanose (Araf) form at relatively higher ␦ values than expected
for the monosaccharide is consistent with an ␣-(1,5) linkage of larabinose in the main chain (Ochoa-Villarreal, Aispuro-Hernández,
Vargas-Arispuro, Martínez-Téllez, & Vargas-Arispuro, 2012). Similarly the appearance of peaks at ␦ = 100.5 (AN) and 103.5 (AM) due
to the C-1 of Galp and at 80.5 ppm for the C-3 of Galp are consistent
with a ˇ-(1,3) linkage of two D-galactose units in the side chain.
The carbon resonances in the anomeric regions are well separated,
there being approximately 16 in case of AM and greater than 32
in the case of AN, which gives at least 16 and 32 spin systems for
AM and AN respectively. Peak widths were around 40 Hz for AM but
sharper (∼30 Hz) for AN.
The molecular weights of these materials are similar and the viscosity of AM is approximately 6 times that of AN (0.2 and 0.035 Pa s
for AM and AN respectively), which is also backed up by the proton
relaxation T2 values (Fig. 4) for AM, which are substantially lower.
AM has broader peaks due to the increased viscosity. Since AM and
AN have similar molecular weights, the highly branched structure
of AM can in part contribute to the higher viscosity and the lower
T2 values observed in the relaxation experiments.
It might be expected that the apparent increased number of
anomeric environments for AN would be indicative of a more disordered molecule, possibly with increased branching. This has been
suggested previously by Grein et al. (2013), however, a lower viscosity was recorded for AN, suggesting a more compact structure.
The possible presence of lower molecular weight carbohydrates
may complicate the NMR interpretation. The presence of small
peaks in the HPLC traces (see Supplementary Data S1) indicates that
other monosaccharides are present, albeit at a significantly lower
concentration than was found in the case of AM for rhamnose. The
GPC data however suggest the presence of higher molecular-weight
materials once again at fairly low levels for both AN and AM. It is
felt that this chromatographic data does not significantly affect the
NMR interpretation. In particular the presence of other monosaccharides in the analysis does not account for the possible presence
of low molecular-weight material in the HSQC plots.
However there is a group of anomeric peaks in the
5.0–5.5/95–100 ppm1 H/13 C range in the HSQC spectrum which is
compatible with monosaccharide shifts (Fig. 2b insert). Hence the
number of distinct spin systems in the polymeric component of AN
could be considerably fewer than that of the initial proposed value
of greater than 32. An alternative explanation for the higher number of spin systems would be a more heterogeneous structure, i.e.,
more chemical environments, but nevertheless a maintenance of
a compact structure with little branching. Increased heterogeneity
and compact structure are not necessarily mutually exclusive.
The 1 H NMR spectra were complex and proton splitting patterns were not easy to distinguish. Broadly, assignments were made
by comparing the spectra with those reported for similar materials (Bubb, 2006; Fischer et al., 2004; Carek, Kardosova, & Lath,
1999; Capeka et al., 1997; Ochoa-Villarreal et al., 2012; Saghir,
Iqbal, Hussain, Koschella, & Heinze, 2008; Westphal et al., 2010).
The anomeric proton signals were well resolved and appeared at
␦ = 5.27 ppm due to H-1 of Rhap, ␦ = 5.16 ppm due to H-1 of Araf,
␦ = 5.05 ppm due to H-1 of Galp and ␦ = 4.40 ppm due to H-2 of Araf.
The CH3 (on C-6 of Rhap) signal was observed at ␦ = 1.19 ppm (Carek
et al., 1999).
3.1.4. Relaxation NMR
According to the model presented here the exchangeable protons on the polymers are in exchange with those in water. Arrhenius
parameters corresponding to Eq. (4) are shown in Table 1 and
the fits shown in Fig. 4. There being no major transitions in the
region 5–80 ◦ C and no unusual behavior of the gum solutions, a
simple interpretation of the data, unlike some analyses previously
reported (Williams et al., 2000; Zhang, Nishinari, Williams, Foster, &
214
S. Massey et al. / Carbohydrate Polymers 175 (2017) 207–215
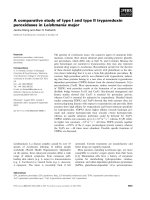
Fig. 5. DSC traces for 40% solutions of AN and AM heated at a rate of 1 ◦ C min−1 (lower 4 traces) and 5 ◦ C min−1 showing the complete transitions including the large peak
around 0 ◦ C due to ice melting. Samples were cooled initially from room temperature to −50 ◦ C at a rate of 50 ◦ C min−1 . An expanded trace is shown on the insert, of the Tg
and onset of ice melting region. Repeat runs are shown.
Norton, 2002) is possible. The rather poor agreement between theoretical fits and measured relaxations, particularly for AM, is due
to inadequacies of the model and probably not due to any error in
the estimation of proton concentration. It may be, for example, due
to inaccessibility of exchangeable protons and consequent effective
reduction of the proton concentration. The values for the Arrhenius
parameter (Table 1) are not robust, as for each polysaccharide, four
parameters were varied (parameters for the water being measured
independently).
It is possible to measure approximate independent T2 values
from initial rapid decays sometimes observed in a CPMG experiment at small values of . Alternatively the gum can be dissolved
in deuterium oxide and although not completely replacing all
the protons on exchangeable sites, a better estimate of rotational
mobility T2 of the polymer molecules themselves can be obtained.
By independently fixing the T2 value for the polymer, a more robust
estimate of the fitting parameters, albeit with a poorer overall fit,
can be obtained. The main result from these experiments is the
dramatically lower T2 value for AM compared with AN solutions,
which is primarily due to the approximately 6 × increased viscosity.
Bearing in mind the reciprocal relationship between the exchange
rate constant and the time constant for exchange, the low values
of exchange on Table 1 suggest that there is a high exchange rate
constant in the case of AM. The higher values for exchange in case
of AN could be due to a concentration effect, such as the lower
accessibility of the protons in the case of the closed structure of AN
compared with the branched and more open structure of AM. Alternatively there could simply be less effective exchange between the
protons of water and the polysaccharide in case of AN. In fact the
poor fit in the case of AM suggests there may have been an overestimate of the T2 value for the polymer. The conclusion from the
relaxation work is that changes in the mobility of the polymer AM,
possibly due to a more branched structure, is reflected in the overall
measured reduction in the value of T2 .
3.2. DSC analysis
The DSC curves for AN and AM are shown in Fig. 5. These curves
provide controversial information regarding the glass transition Tg
of the maximally freeze-concentrated state. It has been suggested
that smaller molecules should have lower Tg values, both in the dry
and maximally freeze-concentrated state, than larger molecules
(MacNaughtan & Farhat, 2008). The values obtained in the present
work, −14.5 ◦ C (AN) and −18.5 ◦ C (AM) both calculated from the
scans at 5 ◦ C min−1 , appear to contradict this as the other data presented here indicated that the molecular mass of AM was similar to
and perhaps greater than that of AN depending on the exact method
of measurement. In addition, there appears to be no indication of
non-equilibrium behavior which can distort the heating curves and
result in misleading values for the true value of Tg (Ablett, Izzard,
& Lillford, 1992). Although Tg and non-equilibrium transitions can
have very low temperatures for small carbohydrates such as glucose, transitions for larger molecules such as the polymers used
here have higher values and there is no indication on the traces of
any low temperature transition or indeed the high temperature end
of any transition which would indicate non-equilibrium behavior
occurring on the traces. The values of Tg are close although significantly different, however relatively small differences such as these
can have a large effects on processing and stability in the foods area.
With regard to the effect of molecular weight, larger differences
might be expected if the Tg values of dry non-hydrated materials
were considered due to the shape of the state diagram. Probably
neither the Tg nor the Tg give definitive structural information but
the Tg values merely suggest here that factors other than molecular
weight determine the value.
No evidence of thermal transitions in the higher temperature
region of 0–80 ◦ C was found, as is commonly observed in solutions of other biopolymers such as xanthan. There appear to be
factors other than molecular weight or thermal transitions in the
S. Massey et al. / Carbohydrate Polymers 175 (2017) 207–215
gum polymers themselves which contribute to these results. The
steps observed in the DSC traces (arrowed on Fig. 5) have been suggested to be the Tg of the maximally concentrated phase despite
the unreasonably large value of the step in heat capacity Cp (Slade
& Levine, 1991) — a step greater than that for the glass transition
of a typical carbohydrate. The larger than expected heat capacity
change has been proposed to be predominantly associated with
the onset of the melting of the ice fraction (Ablett, Clark, Izzard,
& Lillford, 1992). In some non-equilibrium situations the Tg (nonmaximally freeze concentrated) and the onset of ice melting may be
completely dissociated. Models have been constructed previously
in hydrogels and carbohydrate polymeric materials, which suggest
that the structure and in particular the effective pore size of the
gel/viscous solution, as well as the strength of the carbohydrate
main chains can affect the temperature of onset of the formation of
ice (Muhr, 1983) and by implication the lowest temperature of final
formation of the ice fraction. It is speculated that the more branched
structure of AM, presumably having reduced effective pore size due
to an entangled structure, will reduce the temperature of the onset
of ice formation and that the temperature of the step is, therefore,
not solely dependent on the molecular mass and indeed may not
reflect a true glass transition of the maximally concentrated phase
at all. This cryoprotectant property of the AM gum may be of use in
the formulation of low temperature structures in frozen foods.
4. Conclusions
This study has highlighted structural differences between water
soluble AM and AN gums. The differences in properties of the gums
observed in this work are attributed to differences in structure
rather than in molecular mass. AN was more heterogeneous at a
chemical level but had a more compact structure in contrast to the
more branched structure of AM. The following observations have
enabled these conclusions to be drawn. AM had a similar but slightly
higher molecular mass together with a higher viscosity and lower
T2 values in solution. CPMAS NMR measurements on dry powders
showed higher mobility for AM and more difficulty fitting variable
contact time experiments for AN suggesting more heterogeneity
for the latter. 2D NMR measurements in solution showed more
local environments for anomeric carbons of AN. DSC measurements
showed higher values for the glass transition temperature of the
maximally freeze-concentrated phase and the onset of ice melting
for AN. The apparent lowering of the temperature of the maximally
freeze-concentrated glass in the case of AM gives an additional perspective to the use of these materials in the formulation of foods and
drug delivery devices. Moreover the structural differences indicate
that the two varieties of the gum may not be used interchangeably
in various applications.
Acknowledgements
Shazma Massey acknowledges a research grant from HEC
Pakistan (No. 20-3775/NRPU/R&D/HEC/14/1220) and a study leave
by Forman Christian College Lahore, Pakistan for making the
research possible at University of Nottingham, UK. The authors
are thankful to Dr David Coles, School of Biosciences, University
of Nottingham, UK, for carrying out the monosaccharide analysis.
Appendix A. Supplementary data
Supplementary data associated with this article can be found, in
the online version, at />065.
215
References
Ablett, S., Clark, A. H., Izzard, M. J., & Lillford, P. J. (1992). Modelling of heat
capacity–temperature data for sucrose–water systems. Journal of the Chemical
Society, Faraday Transactions, 88, 795–802.
Ablett, S., Izzard, M. J., & Lillford, P. J. (1992). Differential scanning calorimetric
study of frozen sucrose and glycerol solutions. Journal of the Chemical Society,
Faraday Transactions, 88(6), 789–794.
Bloembergen, N., Purcell, E. M., & Pound, R. V. (1948). Relaxation effects in nuclear
magnetic resonance absorption. Physical Review, 73(7), 679.
Bubb, W. A. (2006). NMR Spectroscopy in the study of carbohydrates: Characterizing
the structural complexity. School of Molecular and Microbial Biosciences. New
South wales, Australia: University of Sydney.
Capeka, P., Matulováa, M., & Kardoˇsováa, A. (1997). An acidic heteropolysaccharide
from the flowers of malva mauritiana l. Journal of Carbohydrate Chemistry,
16(9), 1373–1391.
Carek, P., Kardosova, A., & Lath, D. (1999). A neutral heteropolysaccharide from the
flowers of Malva mauritiana L. Chemical Papers, 53(20), 131–136.
Carver, J. P., & Richards, R. E. (1972). A general two-site solution for the chemical
exchange produced dependence of T2 upon the carr-Purcell pulse separation.
Journal of Magnetic Resonance (1969), 6(1), 89–105.
Fischer, M. H., Yu, N., Gray, G. R., Ralph, J., Andersond, L., & Marletta, J. A. (2004).
The gel-forming polysaccharide of psyllium husk (Plantago ovata Forsk).
Carbohydrate Research, 339, 2009–2017.
Gómez-Díaz, D., Navaza, J. M., & Quintáns-Riveiro, L. C. (2008). Intrinsic viscosity
and flow behavior of Arabic gum aqueous solutions. International Journal of
Food Properties, 11, 773–780.
Grein, A., da Silva, B. C., Wendel, C. F., Tischer, C. A., Sierakowski, M. R., Moura, A. B.
D., et al. (2013). Structural characterization and emulsifying properties of
polysaccharides of Acacia mearnsii de Wild gum. Carbohydrate Polymers, 92,
312–320.
Ibbett, R. N., Schuster, K. C., & Fasching, M. (2008). The study of water behaviour in
regenerated cellulosic fibres by low-resolution proton NMR. Polymer, 49(23),
5013–5022.
Kang, J., Cui, S. W., Phillips, G. O., Chen, J., Guo, Q., & Wang, Q. (2011). New studies
on gum ghatti (Anogeissus latifolia) part II. Structure characterization of an
arabinogalactan from the gum by 1D, 2D NMR spectroscopy and methylation
analysis. Food Hydrocolloids, 25(8), 1991–1998.
Kapoor, V. P., & Farooqi, M. I. H. (1991). Studies on Acacia nilotica gum exudates.
structural variation due to different habitats. Carbohydrate Research, 222,
289–293.
MacNaughtan, W., & Farhat, I. A. (2008). Chapter 9 in Principles and applications of
thermal analysis. In P. Gabbott (Ed.),. John Wiley & Sons.
Massey, S., Iqbal, M. S., Wolf, B., Mariam, I., & Rao, S. (2016). Comparative drug
loading and release study on some carbohydrate polymers. Latin American
Journal of Pharmacy, 35(1), 146–155.
McConville, P., & Pope, J. (2001). H-1 NMR T-2 relaxation in contact lens hydrogels
as a probe of water mobility. Polymer, 42(8), 3559–3568.
Muhr, A. (1983). The influence of polysaccharides on ice formation in sucrose
solutions. Diss. University of Nottingham.
Ochoa-Villarreal, M., Aispuro-Hernández, E., Vargus-Arispuro, I., Martínez-Téllez,
M. Á. M., & Vargas-Arispuro, I. (2012). Plant cell wall polymers: Function,
structure and biological activity of their derivatives.
Saghir, S., Iqbal, M. S., Hussain, M. A., Koschella, A., & Heinze, T. (2008). Structure
characterization and carboxymethylation of arabinoxylan isolated from
Ispaghula (Plantago ovata) seed husk. Carbohydrate Polymers, 74, 309–317.
Sanchez, C., Schmitt, C., Kolodziejczyk, E., Lapp, A., Gaillard, C., & Renard, D. (2008).
The acacia gum arabinogalactan fraction is a thin oblate ellipsoid: A new
model based on small-angle neutron scattering and ab initio calculation.
Biophysical Journal, 94(2), 629–639.
Slade, L., & Levine, H. (1991). Beyond water activity: Recent advances based on an
alternative approach to the assessment of food quality and safety. Critical
Reviews in Food Science and Nutrition, 30, 115.
Swift, T. J., & Connick, R. E. (1962). NMR relaxation mechanisms of O17 in aqueous
solutions of paramagnetic cations and the lifetime of water molecules in the
first coordination sphere. The Journal of Chemical Physics, 37(2), 307–320.
Tischer, C. A., Gorin, P. A. J., & Iacomini, M. (2002). The free reducing
oligosaccharides of gum Arabic: Aids for structural assignments in the
polysaccharide. Carbohydrate Polymers, 47, 151–158.
Westphal, Y., Kühnel, S., Waard, P. D., Hinz, S. W. A., Schols, H. A., Voragen, A. G. J.,
et al. (2010). Branched arabino-oligosaccharides isolated from sugar beet
arabinan. Carbohydrate Research, 345(9), 1180–1189.
Williams, M. A. K., Foster, T. J., Martin, D. R., Norton, I. T., Yoshimura, M., &
Nishinari, K. (2000). A molecular description of the gelation mechanism of
konjac mannan. Biomacromolecules, 1(3), 440–450.
Zhang, H., Nishinari, K., Williams, M. A. K., Foster, T. J., & Norton, I. T. (2002). A
molecular description of the gelation mechanism of curdlan. International
Journal of Biological Macromolecules, 30(1), 7–16.