Single nucleotide polymorphisms
Bạn đang xem bản rút gọn của tài liệu. Xem và tải ngay bản đầy đủ của tài liệu tại đây (763.52 KB, 8 trang )
Carbohydrate Polymers 113 (2014) 336–343
Contents lists available at ScienceDirect
Carbohydrate Polymers
journal homepage: www.elsevier.com/locate/carbpol
Rheological characterization of acid pectin samples in the absence
and presence of monovalent ions
Anna Ström a,b,∗ , Erich Schuster c , Suk Meng Goh d
a
Applied Chemistry, Department of Chemical and Biological Engineering, Chalmers University of Technology, 412 96 Göteborg, Sweden
SuMo BIOMATERIALS, VINN Excellence Center, Chalmers University of Technology, 412 96 Göteborg, Sweden
Department of Structure and Material Design, The Swedish Institute for Food and Biotechnology, SIK, Göteborg, Sweden
d
Singapore Institute of Technology, 10 Dover Drive, Singapore 138683, Singapore
b
c
a r t i c l e
i n f o
Article history:
Received 21 November 2013
Received in revised form 26 June 2014
Accepted 27 June 2014
Available online 17 July 2014
Keywords:
Fine structure
Acid gelation
Blocky pectin
Random pectin
Weak gels
Entangled solution
a b s t r a c t
Pectins are traditionally divided into two groups, high methoxy and low methoxy. The groupings determine the charge of the pectin and the gelation mechanism. However, not as yet extensively studied is the
impact on gelation of the distribution of the charges as characterized by an absolute degree of blockiness
(DBabs ). The aim of this study was to characterize rheologically the acid gelation of a pectin with a high
DBabs and a degree of methyl esterification of ∼37%, in the absence and presence of monovalent ions.
The results obtained suggest that a pectin with a blocky charge distribution at pH conditions close to
or below the pKa exhibits weak gel-like properties at intermediate frequencies, despite the absence of
a permanent network structure. The addition of monovalent ions changed the rheological behavior to
resemble that of a strong gel whose properties depended on the type and concentration of the ions.
© 2014 The Authors. Published by Elsevier Ltd. This is an open access article under the CC BY-NC-ND
license ( />
1. Introduction
Pectin is a biopolymer used in both the food and pharmaceutical industries, mainly for its gelling and thickening abilities
(Thakur, Sing, Handa, & Rao, 1997; Rinaudo, 2008). Pectin describes
a family of oligosaccharides and polysaccharides that have common features but are diverse in their fine structures (Willats,
Knox, & Mikkelsen, 2006). Commercial pectin contains a high
degree of homogalacturonan and a minor amount of neutral sugars (Kravtchenko, Voragen, & Pilnik, 1992). The homogalacturonan
is a negatively charged polymer and consists of ␣-(1,4)-linked dgalacturonate units. The galacturonate units can carry a methyl
ester group on the C-6, and the degree of methylation (DM) of the
pectin influences its network formation capabilities. Pectins are
traditionally divided into two groups, high methoxy (HM) (>50%
methyl esters) and low methoxy (LM) (<50% methyl esters). The
former forms gels under acid conditions in combination with a
high sugar concentration, while the latter forms gels in the presence of most multivalent ions according to the egg-box model
∗ Corresponding author at: Department of Chemical and Biological Engineering,
Chalmers University of Technology, 412 96 Göteborg, Sweden. Tel.: +46317723406.
E-mail address: (A. Ström).
(Grant, Morris, Rees, Smith, & Thom, 1973), under acid conditions
(Grant et al., 1973; Gilsenan, Richardson, & Morris, 2000) and in
the presence of 0.2 M monovalent cations (Yoo, Fishman, Savary, &
Hotchkiss, 2003).
Pectins extracted from their sources typically have a high
degree of methyl esters in their natural form, and therefore deesterification is used to produce pectins with lower degrees of
methyl esters (May, 1997). De-esterification can be performed
using acids, alkalis or enzymes, where the ester groups on the
pectin are removed in a random manner. Through the use of
certain enzymes, pectin can be de-esterified in a “blockwise”
manner, resulting in a blockwise distribution of the galacturonate residues (Garnier, Axelos, & Thibault, 1993; Christensen,
Nielson, Kreiberg, Rasmussen, & Mikkelsen, 1998; Hotchkiss et al.,
2002).
The distribution pattern of the ester groups and galacturonate
residues has been shown to affect the calcium sensitivity of pectin
(Hotchkiss et al., 2002) and thus also its gelation behavior (Willats
et al., 2006; Ström et al., 2007). The distribution of the methyl esters
can be expressed as the degree of blockiness (DB) or the absolute
degree of blockiness (DBabs ). The DB is calculated from the amount
of monomer (10 ), dimer (20 ), and trimer (30 ) of galacturonate
residues produced when pectin is incubated with endopolygalacturonase, divided by the amount of free galacturonate residues
/>0144-8617/© 2014 The Authors. Published by Elsevier Ltd. This is an open access article under the CC BY-NC-ND license ( />
A. Ström et al. / Carbohydrate Polymers 113 (2014) 336–343
present in the pectin sample (Daas, Voragen, & Schols, 2000).
DB =
GalA
1 × 10 + 2 × 20 + 3 × 30 × Mw
1 − DM/100 × mpectin × (muronicacid /mpectin )
× 100
(1)
The DBabs is based on the same idea, but instead of the amount
of mono-, di- and trimer liberated by enzymatic digestion being
related to the total amount of free galacturonate residues in the
pectin, it is related to the total amount of galacturonate (including
methyl-esterified residues) as defined by Guillotin et al. (2005).
DBabs =
GalA
1 × 10 + 2 × 20 + 3 × 30 × Mw
mpectin × (muronicacid /mpectin )
× 100
(2)
Strưm et al. (2007) showed that the DB or the DBabs , has a large
impact on the capability of the pectin to form gels.
Polygalacturonate in dilute solutions is thought to change from
an extended two-fold (21 ) rotational symmetry to a more compact
three-fold (31 ) rotational symmetry in response to pH reduction
at a fixed temperature (Cesàro, Ciana, Delben, Manzini, & Paoletti,
1982; Gilsenan et al., 2000). The three-fold rotational symmetry
is stabilized by intramolecular hydrogen bonding (Walkinshaw &
Arnott, 1981). Intermolecular hydrogen bonds are formed between
protonated and unprotonated carboxyl groups and between carboxyl groups and O(3) on a neighboring anti-parallel pectin helix
(Walkinshaw & Arnott, 1981).
Acidification of more concentrated LM pectin with a random
charge distribution gives strong thermally reversible gels, and it
was suggested that the (31 ) rotational symmetry obtained due to
pH reduction will reform into a (21 ) rotational symmetry at higher
temperature for a fixed low pH (Gilsenan et al., 2000). However,
nuclear magnetic resonance and circular dichroism (CD) studies
suggest that both (21 ) and (31 ) helices are present in calcium pectate solids and gels (Jarvis & Apperley, 1995). Lootens et al. (2003)
reported on the acid gelation of amidated LM pectin and compared
it to random charge distribution pectin, and it was observed that
the amidated pectin formed a considerably stronger acid gel. It was
thought that for the amidated pectins the amide groups reinforce
the gel structure via hydrogen bonding (Lootens et al., 2003).
We intended, in this study, to investigate the rheological properties of blocky charge distribution pectin samples, as compared to
random charge distribution pectin samples, at pH conditions close
to the pKa, in the absence and presence of monovalent ions.
2. Material and methods
337
solutions. Both pectin and dilution solutions were heated to 45 ◦ C
prior to being mixed together. The solutions were then acidified
using hydrochloric acid (0.1 N or 1 N) at 45 ◦ C. To achieve higher
pH values, 1 M sodium hydroxide (NaOH) was used. Dilution and
addition of acid or base was done at elevated temperature (45 ◦ C),
as most samples behaved as solutions at this temperature. This
minimized the effect of shear or inhomogeneities forming upon
acidification or salt addition.
2.2.1. Rotational viscometry
The viscosity of the pectin was measured using an AR 1000
from TA Instruments (Eschborn, Germany). The geometry used
was a cone ( = 40 mm, truncation = 71 m, angle = 1.59◦ ) and plate.
The viscosity was recorded at T = 20 ◦ C and between shear rates of
0.03 s−1 and 1000 s−1 .
2.2.2. Oscillatory rheology
Tests of the viscoelastic properties of the samples were
performed using the same cone–plate geometry on the same
rheometer. The sample loading area was pre-heated to 50 ◦ C prior
to loading of the pectin sample, which itself had been preheated
to 45 ◦ C. After loading, the sample was quickly quenched to 5 ◦ C
and equilibrated at 5 ◦ C for 30 min before measurement started.
Oscillatory measurements were conducted at 5 ◦ C to measure the
storage and loss moduli (G and G ). In addition, the response to
temperature sweeps (5–40 ◦ C and 40–5 ◦ C) at a rate of 2 ◦ C/min
was measured, from which setting and melting temperatures were
established. The setting temperature was defined as the temperature at which G rose above G on cooling or dropped below G on
heating. In these measurements, a constant strain of 0.5% and a constant frequency of 6.28 rad/s were used. Samples were measured in
triplicate and variations of the moduli during time sweep and melting and setting temperature were within 10%. A further frequency
sweep at T = 5 ◦ C was conducted on selected samples. The pH meter
used was a Schott CG-825 and was calibrated between pH 7 and pH
4 before each experiment.
3. Results
3.1. Rheological characterization of pectin samples in the absence
of monovalent ions
The apparent viscosity as a function of pectin concentration and
pH of two pectins that are close in value of DM, ∼35%, but differ in
2.1. Materials
2.2. Methods
The determination of DB and DBabs was performed by incubating the pectin with endopolygalacturonase [EC3.1.2.15] (Bussink,
Kester, & Visser, 1990). The oligomers were analyzed using capillary
electrophoresis according to a method previously described (Ström
& Williams, 2004; Ström et al., 2007), giving a DB of ∼57% and DBabs
of ∼36%. The DB and DBabs of the conventional pectin were 40%
and 26%, respectively. The starting pectin solutions were prepared
at concentrations of 2–3 wt% and were diluted to the desired end
concentrations using either deionized water or salt (NaCl, KCl, LiCl)
Viscosity at 10 s-1 (Pas)
100
The pectin used in this study was kindly provided by CP Kelco
(Lille Skensved, Denmark) with the following analytical information: DM of ∼37% and a galacturonic acid content of ∼89%. The
pectin had been de-esterified at 45 ◦ C using a PME extracted from
papaya, at a pH of 4.5 and an NaCl concentration of 0.4 M. A conventional pectin (LM12 not standardized with sugar) of DM 35%
obtained from CP Kelco was also used.
10
1
0.1
0.01
1E-3
0.01
0.1
1
Polymer concentration (%)
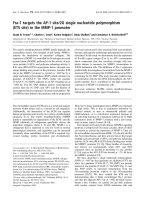
Fig. 1. Viscosity at a shear rate of 10 s−1 as a function of pectin concentration at pH
5 (triangles) and pH 3 (squares) for pectin with similar degree of methylation but
with random (solid symbols) and blocky (open symbols) charge distribution.
338
A. Ström et al. / Carbohydrate Polymers 113 (2014) 336–343
1000
1000
(a)
(c)
100
G' and G'' (Pa)
G' and G'' (Pa)
100
10
10
1
1
0.1
0
1
2
3
5
4
10
15
20
25
30
35
40
Temperature (°C)
Concentration /%
(b)
30
(d)
1000
Temperature (°C)
G' and G'' (Pa)
25
100
10
1
20
15
10
5
0.1
0.01
0.1
1
10
100
Frequency (rads -1)
1.0
1.5
2.0
2.5
3.0
Pectin concentration (%)
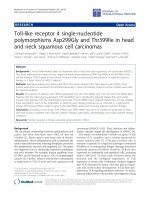
Fig. 2. Oscillatory rheology on blocky pectin gels, where G (triangles) and G (squares) of pectin samples at pH 3 and as a function of (a) pectin concentration at T = 5 ◦ C;
(b) frequency sweep where black symbols represent 3% pectin, gray 2% pectin and open 1% pectin at T = 5 ◦ C; (c) temperature reduction where black symbols represent 3%
pectin, gray 2% pectin and open 1% pectin; and (d) temperature at which G = G upon temperature reduction (filled symbols) and temperature increase (open symbols) of
pectin samples. All tests were performed at T = 5 ◦ C, f = 6.28 rad/s, pH = 3 and strain = 0.5%, unless otherwise indicated.
their absolute degree of blockiness (36% and 26%, respectively), is
shown in Fig. 1. It can be observed that the slope of the apparent
increase in viscosity is higher for the blocky pectin compared to the
less blocky pectin at pH 3. Similar behavior of the two pectins was
observed at pH 5, which indicates that the behavior at this pH was
independent of their absolute blockiness. The estimated overlap
concentration c* obtained for the blocky pectin at pH 5 is 0.4%, close
to the value obtained for the random charge density pectin at the
pH and temperature. At pH 3, however, the value of c* of the blocky
pectin was close to 0.25%.
Oscillatory measurements show that the moduli of the sample
prepared using the blocky pectin increased as the pectin concentration increased from 1.0% to 3.0% at a fixed pH value of 3.0 (Fig. 2a).
At the same time, tan ı (tan ı = G /G ) decreased from 0.63 to 0.35,
showing an increased importance of the elastic component with
increasing polymer concentration. On the other hand, loss moduli
were always higher than storage moduli for the non-blocky pectin
at the pH and temperature tested (data not shown).
The mechanical spectrum at the lowest pectin concentration
tested (1%) is typical of a gelling sample where the degree of
crosslinks is just sufficient to form a continuous network. Log G
and log G varied linearly with log ω over the frequency range studied and with the same slope (Fig. 2b). Upon increase in pectin
concentration, the value of G was higher than G at frequencies
between 0.02 and 80 rads−1 . It appears that the slopes of log G were
slightly higher than the slopes of log G . The mechanical spectra
further suggest a crossover of G and G at low frequency. Preshearing the samples at different shear rates prior to oscillatory
measurements showed a fast recovery independent of pre-shear
speed (1 s−1 , 10 s−1 , 100 s−1 ), and the moduli recovered to the
same absolute values regardless of the pre-shear rate (data not
shown).
A. Ström et al. / Carbohydrate Polymers 113 (2014) 336–343
3.2. Rheological characterization of acid pectin samples in the
presence of monovalent ions
G' and G'' (Pa)
1000
100
10
1
0.1
1E-3
0.01
0.1
1
10
100
Frequency (rads-1)
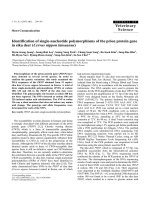
Fig. 3. Frequency sweep of G and G at a strain of 0.5%. T = 5 ◦ C, pH = 2.5 and pectin
concentration = 2%.
The data for the temperature sweep of the pectin samples
are presented in Fig. 2c. Reducing the temperature increased
the moduli of all samples, and increasing pectin concentration
increased the setting temperature of the pectin system at pH 3.
There was little hysteresis between the setting and melting temperatures at pH 3 (Fig. 2d).
A frequency sweep at pH 2.5 shows similar mechanical spectra
as at pH 3, where log G and log G varied linearly with log ω over
the frequency range studied, and with the same slope. One can
observe the tendency of a cross-over (G > G ) at low frequencies
(<0.001 rad/s) (Fig. 3).
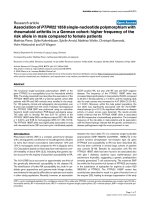
The acid pectin sample containing 3% pectin shows a power
law response as log Á* is plotted against log ω (Fig. 4). The slope
of the dynamic viscosity is −0.77, thus giving a power law relation
of Á* = aω−0.77 .
Visually, all samples were transparent and clear; no indication
of coarsening or large-scale heterogeneity was observed. This is in
contrast to what has been reported for random LM pectin (Lootens
et al., 2003).
10000
Dyn. and rot. viscosity (Pas)
339
1000
The addition of NaCl to the acid pectin gels at pH 3 increased
G , while tan ı(G /G ) was reduced from 0.65, 0.47 and 0.14 to
0.07 upon addition of 0, 0.05, 0.1 and 0.2 M NaCl, respectively
(Fig. 5a). The mechanical spectra of the pectin sample with increasing amount of salt (Fig. 5b) showed high absolute values of moduli,
and more importantly, a larger difference between G and G and a
lower frequency dependence. In addition to the increase in G and
G , the gelation and melting temperatures also increased (Fig. 5c),
as did the thermal hysteresis of the sample where NaCl was present.
In some cases, such as that corresponding to pH 2.45 with 0.05 M
NaCl, the melting temperature of the gel was above the preparation and testing temperature of 45 ◦ C. These gels could be visually
observed to be syneretic and inhomogeneous. Rheological tests
on these conditions were not done, since the high temperature
required to melt the gel could cause evaporation (cone and plate
geometry used) and lead to unreliable data. The use of concentric
cylinder geometry would reduce the effect of evaporation; however, this would have required quantities of pectin sample larger
than those available in this study.
The effect of the addition of 0.05 M of LiCl, NaCl and KCl on G as
a function of time is shown in Fig. 6. The sample is loaded on the
rheometer at a temperature above gel formation for the different
systems (40 ◦ C) and subsequently quenched to 5 ◦ C with a rate of
8 ◦ C/min. KCl is shown to be most effective in promoting network
formation where the strength of the network measured in G is
higher and the difference between G and G is larger (tan ı = 0.27)
than observed for the addition of NaCl and LiCl (tan ı = 0.40 and
tan ı = 0.44, respectively). LiCl had the least impact on the absolute
value of G and is also the system where G and G are the closest. Furthermore, there is a continuous increase in G over time in
the presence of KCl. Fig. 7 shows the effect of pH on the values of
G measured for 1% blocky pectin after holding for 2400 s at 5 ◦ C
in the presence of 0.05 M LiCl, NaCl or KCl. There is a progressive
increase in G with decreasing pH, which is particularly evident for
the mixtures of pectin with KCl. At all pH values studied, KCl gave
the highest moduli and LiCl the lowest (i.e. the same order as in the
time curves shown in Fig. 6 for a fixed pH of 3.0). With the exception of LiCl at pH 2.5, the mixtures had higher G than pectin alone
at the same values of pH (by a factor of ∼5 for KCl).
As pH was reduced from 3 to 2.5, tan ı varied from 0.26 to 0.22 for
the samples containing KCl, 0.45 to 0.47 for the samples containing
NaCl, 0.44 to 0.45 for the samples containing LiCl and 0.77 to 0.5 for
the pectin samples at 1% with no added salt. It is further worthwhile
to note that upon addition of urea, G was reduced from 16 to 3 Pa
and the tan ı was increased from 0.47 to 1 for the 1% pectin samples
containing 0.05 M NaCl (data not shown).
100
∗
η
10
4. Discussion
η
1
0.1
0.01
0.01
0.1
1
10
100
-1
Frequency (rad/s) and shear rate (s )
Fig. 4. Á* and Á as a function of frequency and shear rate. T = 5 ◦ C, pH = 3.0, pectin
concentration = 3% and strain of 0.5%.
The term “weak gel” was introduced (Ross-Murphy, 1984) to
describe systems that give a gel-like response to small deformations but show a solution-like response to higher stress. These gels
are distinguish from conventional (“true”) gels that are weak only
in the sense of having low moduli. Usually, weak gels give mechanical spectra with greater frequency-dependence of G and G and
smaller separation between the two moduli (i.e. higher tan ı) than
true gels. Additional distinction of true and weak gels is that true
gels fracture under stress, with little, if any, subsequent recovery of a continuous network, whereas weak gels yield and flow,
with rapid recovery of their gel-like character when the stress is
removed Another characteristic feature of weak gels is that, unlike
solutions of entangled polymer coils, they violate the Cox–Merz
340
A. Ström et al. / Carbohydrate Polymers 113 (2014) 336–343
1000
40
(a)
35
30
100
G' and G'' (Pa)
G' (Pa)
25
20
10
15
10
5
1
0.00
0.05
0.10
0.15
0
0.20
0
500
Salt concentration (M)
(b)
G' and G'' (Pa)
100
10
1
0.01
0.1
1
10
100
-1
Frequency (rads )
50
2000
(c)
rule (Cox & Merz, 1958), giving complex dynamic viscosity (Á*)
greater than steady-shear viscosity (Á*) at equivalent numerical
values of frequency (rad/s) and shear rate (1/s). By these criteria,
the blocky pectin studied in the present investigation show weak
gel like properties.
One interpretation of the properties of weak gels, proposed
initially for ordered xanthan, is that they have a network structure similar to that of true gels but that the junctions are weaker
and more dynamic (e.g. Ross-Murphy, 1984; Morris, Nishinari, &
Rinaudo, 2012). However, in an investigation of ordered kappa
carrageenan in the presence of NaI, which inhibits the helix-helix
aggregation required to give true gels, Ikeda and Nishinari (2001)
observed weak gel-type properties of the sample (that is violation of the Cox–Merz rule, frequency-dependence of G and G
and rapid recovery of the mechanical spectra even after shearing at 1000 s−1 for 30 s). They conclude that even nonaggregated
100
40
35
G' and G'' (Pa)
Temperature (°C)
45
1500
Fig. 6. Storage moduli as a function of time for 1% pectin samples at pH 3 with the
addition of 0 M salt (open symbol) and 0.05 M of LiCl (light gray), 0.05 M NaCl (dark
gray) and 0.05 M KCl (black). The temperature to the left of the vertical dotted line
in the symbol is decreasing from 40 ◦ C to 5 ◦ C over time, while the temperature is
kept constant at T = 5 ◦ C to the right of the dotted line. Measurements were done at
a strain = 0.5% and f = 6.28 rad/s.
1000
0.1
1000
Time (s)
30
25
20
15
10
10
2.4
2.5
2.6
2.7
2.8
2.9
3.0
pH
Fig. 5. Influence of NaCl concentration on acid pectin samples where the pectin
concentration is 1%. (a) G (triangles) and G (squares) at pH 3 at a strain of 0.5% and
f = 6.28 rad/s at T = 5 ◦ C. (b) Frequency dependency of samples containing different
amount of NaCl from 0 M (open symbols), 0.05 M (gray symbols) to 0.1 M (black
symbols) at T = 5 ◦ C. (c) Gelation (triangle) and melting (circle) temperatures in the
absence of NaCl (open symbols) and in the presence of 0.05 M NaCl (solid symbols)
at various pH.
2.4
2.5
2.6
2.7
2.8
2.9
3.0
pH
Fig. 7. The influence of type of ions added at a concentration of 0.05 M to a 1% pectin
sample as a function of pH and at t = 2400 s, where the line between the symbols is
added to aid the eye; addition of KCl (black), NaCl (dark gray), LiCl (light gray) and
no added salt (open symbol). Measurements were done at T = 5 ◦ C, strain = 0.5% and
f = 6.28 rad/s.
A. Ström et al. / Carbohydrate Polymers 113 (2014) 336–343
G' and G'' (Pa)
1000
100
G'
10
G''
1
10-4 10-3 10-2 10-1 100 101 102 103 104 105 106 107 108
Frequency (rads-1)
Fig. 8. The frequency-dependent storage modulus G and loss modulus G for a 1%
DM 42 blocky pectin gel at pH 2 reported by Vincent et al. (2013). The MSD of
the microrheological data (Vincent et al., 2013) was mapped onto G and G using
estimation method for the generalized Stokes–Einstein equation by Mason (2000).
helical conformers of carrageenan are rigid enough for their entanglements to exhibit gel-like visco-elasticity without the formation
of a permanent network structure (Ikeda & Nishinari, 2001). Similar behavior is indeed observed for the pectin sample at pH 3, albeit
at lower shear rates than the suggested 1000 s−1 . It cannot be concluded from this study alone whether the weak gel like rheological
properties of the current blocky pectin sample arise from weak
side-by-side associations arising from e.g. co-operative attraction,
or via entanglement of rigid structures as proposed in the case of
kappa carrageenan in the presence of NaI (Ikeda & Nishinari, 2001).
The common feature for the two proposals is that the polymer must
be conformationally ordered.
The analysis of microrheological data on acid gels at pH 2
reported by Vincent, Mansel, Kramer, Kroy, and Williams (2013)
indicate further the presence of transient structures or junctions
(although measured using a DM 42 blocky apple pectin. Microrheology enabled the authors to measure the mean square displacement
(MSD) of 500 nm—sized polystyrene beads over a time scale of more
than 8 orders of magnitude. The MSD data obtained were converted into the mechanical spectra G and G , using the generalized
Stokes–Einstein equation (Mason, 2000) (Fig. 8). The data show systems which were slightly weaker but still of an order of magnitude
similar to that found in the current work; furthermore, a cross-over
of G and G at low frequencies was observed. Finally, the slopes of
G and G were found to be similar to the pH 2.5 gels investigated
in this paper. In addition to measuring the mechanical spectrum,
the high frequency regime of the microrheological data yielded
information about the relaxation and dynamics of the constituent
polymer chains in the gel. Vincent et al. (2013) found that MSD for
pectin chains at pH 2 follows at short times a power law of 3/4,
which is characteristic for semiflexible polymers. In other words,
the observed pectin at pH 2 is in a stiff conformation, responding
faster than flexible chains, which would follow a power law close
to 1/2, as described by the Rouse model (Rubinstein & Colby, 2003).
The authors concluded that the networked strands of an acid gel are
not permanently cross-linked; rather, they described the observed
mechanical response by the sliding of crosslinks at intermediate
time scales.
341
The lower c* obtained for the blocky pectin at pH 3 and the
higher increase in viscosity as a function of polymer concentration once above c* (Fig. 1) would support the hypothesis of a stiffer
chain, that is a higher degree of conformational order, in the case of
the blocky pectin. However this is only true at low pH, as the two
pectins behave similarly at pH 5. It is further noteworthy that while
the DM of pectins influences its pKa, a random or blocky charge distribution appears to not influence pKa (Ralet, Dronnet, Buccholt, &
Thibault, 2001); thus, the protonation degree of the pectin cannot
explain the behavior observed in this study. Instead, the bulk rheology behavior of the pectin with blocky charge distribution could be
explained in similar terms, exhibiting transient or sliding crosslinks
at intermediate time scales, as observed using microrheology for an
acid apple pectin sample (Vincent et al., 2013).
HM pectin, in dilute solutions, is prone to forming aggregations of different kinds, for example, microparticles consisting of
microgels, rods and kinked rods. Such structures have been visualized using electron microscopy for pectins extracted from peaches
(Fishman, Cooke, Hotchkiss, & Damert, 1993) and later confirmed
via AFM studies for pectins extracted from oranges, which further gave evidence to the presence of lateral aggregations of pectin
chains (Fishman, Cooke, Chau, Coffin, & Hotchkiss, 2007). Fishman
and co-workers suggested that the various aggregations are governed by hydrophobic interactions and hydrogen bonding. While
LM pectin has a higher charge than the HM pectin at neutral pH,
which reduces the tendency of self-aggregation of pectin chains
at neutral pH, the self-aggregation may again be favored at pH
under pKa of the pectin where the overall charge is reduced due
to protonization of the carboxyl groups. Indeed, the formation
of lateral aggregations of pectin chains, as reported in the work
performed byFishman et al. (2007), could explain the proposed
stiffened structure, or the higher degree of conformational order,
of pectin with blocky charge distribution at low DM and low pH.
It would be interesting to further shed light on the potential difference in aggregation behavior between an LM pectin of a blocky
charge distribution with one of a random charge distribution at low
pH and dilute solutions, following the study performed by Fishman
and co-workers using AFM (Fishman et al., 2007).
It was shown, on calcium induced commercial LM pectin gels,
that a reduction in pH led to a reduction in CD ellipticity characteristic of formation of egg-box junctions decreased (Gidley, Morris,
Murray, Powell, & Rees 1980). The CD ellipticity characteristic of
formation of egg-box junctions was replaced progressively by the
increase in ellipticity seen for acid-induced gelation of HM pectin,
where junctions are formed by sequences in the three-fold conformation. At pH values around the pKa (e.g. pH 3.5) the gels were
weakened or abolished by incorporation of either (i) 8 M urea,
which inhibits acid-induced gelation but not cation-mediated (eggbox) association, or (ii) polygalacturonate blocks, which inhibit
cation-induced gelation by occupying binding sites on intact pectin
chains, but have no effect on the junctions induced by acidification.
The authors concluded that the dominant mechanism of intermolecular association shifts progressively from cation-mediated
association of two-fold chain sequences to acid-induced association with decreasing pH, and that contributions from both types of
association are necessary for gelation at pH values close to the pKa.
As illustrated in Fig. 5, true gels (those with low-frequency
dependence of G and G and increased temperature hysteresis)
were formed on incorporation of monovalent salt at pH 3. As the pH
was increased, gelation was suppressed, and at pH 5, neither of the
pectin samples studied formed a gel in the presence of monovalent
ions, indicating a requirement for some acid-induced association
in addition to cation-mediated junctions, in line with the results
outlined above.
At pH 3, the influence of the ions was found to increase in the
following order: Li+ < Na+ < K+ . This trend is also observed for the
342
A. Ström et al. / Carbohydrate Polymers 113 (2014) 336–343
effectiveness of the same ions in promoting gelation of carrageenan
(Morris, Rees, & Robinson, 1980) and gellan (Morris et al., 2012),
and in the magnitude of CD change observed (Seale, Morris, & Rees,
1982) on addition of monovalent cations to solutions of alginate
poly-l-guluronate sequences, which are closely similar in structure
to the poly-d-galacturonate sequences of pectin. In the investigation by Yoo et al., 2003), a similar trend was observed, but at pH
5, where KCl gave the strongest gels; those formed with NaCl were
substantially (∼3.3×) weaker, and LiCl gave negligible gel strength,
similarly as shown in this study at pH 3 (Figs. 6 and 7). Differences
in effectiveness of the monovalent ions to promote load bearing
junctions have been explained (Morris et al., 2012) by the efficiency
with which cations can occupy specific binding sites on the polymer chains, which will depend on ionic radius or by the alternative
explanation based on degree of hydration of the cations (Yoo et al.,
2003).
It is clear from this study and others that the mechanism behind
gelation of different pectins at slightly different conditions is still
not totally explained. The results presented in this particular study
show different rheological behavior for LM pectin with a blocky
charge distribution at pH below pKa compared to previously known
behavior of conventional LM pectin at pH below pKa (Gilsenan
et al., 2000; Lootens et al., 2003). Furthermore, the pectin studied
here did not form gel in the presence of monovalent ions at pH 5,
which has been reported for other blocky pectins of low DM (Yoo
et al., 2003, 2009). Instead, the presence of both hydrogen bonds
and monovalent ions is required to form a gel exhibiting strong gel
characteristics, that is, with no frequency dependence. The differences in rheological properties may originate from differences in
length and distribution patterns of free carboxyl groups (Yoo et al.,
2009; Kim et al., 2013) as well as variation in tertiary distribution
of de-esterified pectin blocks (Fishman et al., 2007).
5. Conclusions
The rheological behavior of a blocky low-methoxy pectin was
studied at low pH (2–4) and in the absence and presence of monovalent ions. This study suggests that the pectin at low pH (<3.5)
does not form strong gels in the sense that the gel consists of disordered flexible polymer chains linking in ordered junction zones.
Instead, the rheological characterization of the acid pectin samples
shows the characteristics of a weak gel (G > G coupled with frequency dependence) at intermediate frequencies. However, at low
frequencies, a shift in rheological properties appears to happen,
where G becomes larger than G , thus indicating a system without
a permanent network structure but with characteristics of a weak
gel at intermediate frequencies.
Upon addition of monovalent ions the pectin sample turned
into a typical true gel. Little influence of frequency on the moduli
and larger hysteresis during temperature sweeps suggests larger
aggregates are formed (also observed visually by the sample turning turbid instead of clear and the occurrence of syneresis as
the salt concentration increased). It is suggested that the presence of monovalent ions reduces the repulsive charges between
pectin chains but the monovalent ions do not induce sufficient salt
bridges as the presence of urea reduced the gel strength, indicating
that the presence of hydrogen bonds is still required for gelation to
occur.
Acknowledgments
The authors are grateful for financial support from the SuMo
Biomaterials, a VINN EXcellence center, and a Vinnmer grant to
A.S (2011-03525). The anonymous reviewer is acknowledged for
helpful comments.
References
Bussink, H. J. D., Kester, H. C. M., & Visser, J. (1990). Molecular cloning, nucleotide
sequence and expression of the gene encoding pre-pro-polygalacturonase II of
Aspergillus niger. FEBS Letters, 273, 127–130.
Cesàro, A., Ciana, A., Delben, F., Manzini, G., & Paoletti, S. (1982). Physicochemical
properties of pectic acid. I. Thermodynamic evidence of a pH-induced conformational transition in aqueous solutions. Biopolymers, 21, 431–449.
Christensen, T. M. I. E., Nielson, J. E., Kreiberg, J. D., Rasmussen, P., & Mikkelsen,
J. D. (1998). Pectin methyl esterase from orange fruit: Characterization and
localization by in-situ hybridization and immunohistochemistry. Planta, 206,
493–503.
Cox, W. P., & Merz, E. H. (1958). Correlation of dynamic and steady flow viscosities.
Journal of Polymer Science, 28, 619–622.
Daas, P. J., Voragen, A. G., & Schols, H. A. (2000). Characterization of non-esterified
galacturonic acid sequences in pectin with endopolygalacturonase. Carbohydrate Research, 326, 120–129.
Fishman, M. L., Cooke, P. H., Hotchkiss, A., & Damert, W. (1993). Progressive dissociation of pectin. Carbohydrate Research, 248, 303–316.
Fishman, M. L., Cooke, P. H., Chau, H. K., Coffin, D. R., & Hotchkiss, A. T. (2007). Global
structures of high methoxyl pectin from solution and in gels. Biomacromolecules,
8, 573–578.
Garnier, C., Axelos, M. A. V., & Thibault, J. F. (1993). Phase diagrams of pectin–calcium
systems: Influence of pH, ionic strength, and temperature on the gelation
of pectins with different degrees of methylation. Carbohydrate Research, 240,
219–232.
Gidley, M. J., Morris, E. R., Murray, E. J., Powell, D. A., & Rees, D. A. (1980). Evidence for
two mechanisms of interchain association in calcium pectate gels. International
Journal of Biological Macromolecules, 2, 332–334.
Gilsenan, P. M., Richardson, R. K., & Morris, E. R. (2000). Thermally reversible
acid-induced gelation of low-methoxy pectin. Carbohydrate Polymers, 41,
339–349.
Grant, G. T., Morris, E. R., Rees, D. A., Smith, P. J. C., & Thom, D. (1973). Biological
interactions between polysaccharides and divalent cations: The egg-box model.
FEBS Letters, 32, 195–198.
Guillotin, S. E., Bakx, E. J., Boulenguer, P., Mazoyer, J., Schols, H. A., & Voragen, A. G. J.
(2005). Populations having different GalA blocks characteristics are present in
commercial pectins which are chemically similar but have different functionalities. Carbohydrate Polymers, 60, 391–398.
Hotchkiss, A. T., Jr., Savary, B. J., Cameron, R. G., Chau, H. K., Brouillette, J., Luzio,
G. A., & Fishman, M. L. (2002). Enzymatic modification of pectin to increase its
calcium sensitivity while preserving its molecular weight. Journal of Agricultural
and Food Chemistry, 50, 2931–2937.
Ikeda, S., & Nishinari, K. (2001). Weak gel type rheological properties of aqueous
dispersions of nonaggregated -carrageenan helices. Journal of Agriculture and
Food Chemistry, 49, 4436–4441.
Jarvis, M. C., & Apperley, D. C. (1995). Chain conformation in concentrated pectic
gels: Evidence from 13 C NMR. Carbohydrate Research, 275, 131–145.
Kim, Y., Williams, M. A. K., Galant, A. L., Luzio, G. A., Savary, B. J., Vasu, P., &
Cameron, R. G. (2013). Nanostructural modification of a model homogalacturonan with a novel pectin methylesterase: Effects of pH on nanostructure,
enzyme mode of action and substrate functionality. Food Hydrocolloids, 33, 132–
141.
Kravtchenko, T. P., Voragen, A. G. J., & Pilnik, W. (1992). Analytical comparison of three industrial pectin preparations. Carbohydrate Polymers, 18,
17–25.
Lootens, D., Capel, F., Durand, D., Nicolai, T., Boulenguer, P., & Langendorff, V. (2003).
Influence of pH, Ca concentration, temperature and amidation on the gelation
of low methoxyl pectin. Food Hydrocolloids, 17, 237–244.
Mason, T. G. (2000). Estimating the viscoelastic moduli of complex fluids using the
generalized Stokes–Einstein equation. Rheologica Acta, 39, 371–378.
May, C. D. (1997). Pectins. In A. Imeson (Ed.), Thickening and gelling agents for food
(pp. 124–152). London: Blackie Academic and Professional.
Morris, E. R., Rees, D. A., & Robinson, G. (1980). Cation-specific aggregation of carrageenan helices: Domain model of polymer gel structure. Journal of Molecular
Biology, 138, 349–362.
Morris, E. R., Nishinari, K., & Rinaudo, M. (2012). Gelation of gellan—A review. Food
Hydrocolloids, 28, 373–411.
Ralet, M. C., Dronnet, V., Buccholt, H. C., & Thibault, J. F. (2001). Enzymatically and
chemically de-esterified pectins; characterisation, polyelectrolyte behavior and
calcium binding properties. Carbohydrate Research, 336, 117–125.
Rinaudo, M. (2008). Main properties and current applications of some polysaccharides as biomaterials [Review]. Polymer International, 57, 397–430.
Ross-Murphy, S. B. (1984). Rheological methods. In H. W.-S. Chan (Ed.), Biophysical methods in food research. Critical reports on applied chemistry (pp. 195–290).
London: SCI.
Rubinstein, M., & Colby, R. H. (2003). Polymer physics. Oxford: Oxford University
Press.
Seale, R., Morris, E. R., & Rees, D. A. (1982). Interactions of alginates with univalent
cations. Carbohydrate Research, 110, 101–112.
Ström, A., Ribelles, P., Lundin, L., Norton, I., Morris, E. R., & Williams, M. A. K. (2007).
Influence of pectin fine structure on the mechanical properties of calcium–pectin
and acid–pectin gels. Biomacromolecules, 8, 2668–2674.
Ström, A., & Williams, M. A. K. (2004). On the separation, detection and quantification
of pectin derived oligosaccharides by capillary electrophoresis. Carbohydrate
Research, 339, 1711–1716.
A. Ström et al. / Carbohydrate Polymers 113 (2014) 336–343
Thakur, B. R., Singh, R. K., Handa, A. K., & Rao, M. A. (1997). Chemistry and uses of
pectin—A review. Food Science and Nutrition, 37, 47–73.
Vincent, R. R. R., Mansel, B. W., Kramer, A., Kroy, K., & Williams, M. A. K. (2013).
Micro-rheological behaviour and nonlinear rheology of networks assembled
from polysaccharides from the plant cell wall. New Journal of Physics, 15 (art.
no. 035002).
Walkinshaw, M. D., & Arnott, S. (1981). Conformations and interactions of pectins
1. X-ray diffraction analysis of sodium pectate in neutral and acidified forms.
Journal of Molecular Biology, 153, 1055–1073.
343
Willats, W. G. T., Knox, J. P., & Mikkelsen, J. D. (2006). Pectin: New insights into an
old polymer are starting to gel. Trends in Food Science & Technology, 17, 97–104.
Yoo, S. H., Fishman, M. L., Savary, B. J., & Hotchkiss, A. T., Jr. (2003). Monovalent saltinduced gelation of enzymatically deesterified pectin. Journal of Agriculture and
Food Chemistry, 51, 7410–7417.
Yoo, S.-H., Lee, B.-H., Savary, B. J., Lee, S., Lee, H. G., & Hotchkiss, A. T. (2009). Characteristics of enzymatically-deesterified pectin gels produced in the presence of
monovalent ionic salts. Food Hydrocolloids, 23, 1926–1929.