Microwave-assisted carboxymethylation of cellulose extracted from brewer’s spent grain
Bạn đang xem bản rút gọn của tài liệu. Xem và tải ngay bản đầy đủ của tài liệu tại đây (1.75 MB, 9 trang )
Carbohydrate Polymers 131 (2015) 125–133
Contents lists available at ScienceDirect
Carbohydrate Polymers
journal homepage: www.elsevier.com/locate/carbpol
Microwave-assisted carboxymethylation of cellulose extracted from
brewer’s spent grain
Danilo Martins dos Santos ∗ , Andrea de Lacerda Bukzem, Diego Palmiro Ramirez Ascheri,
Roberta Signini, Gilberto Lucio Benedito de Aquino
Unidade de Ciências Exatas e Tecnológicas, Universidade Estadual de Goiás, Br 153, Fazenda Barreiro do Meio, 3105, 75132-903 Anápolis, Goiás, Brazil
a r t i c l e
i n f o
Article history:
Received 12 January 2015
Received in revised form 17 May 2015
Accepted 20 May 2015
Available online 3 June 2015
Keywords:
Brewer’s spent grain
Agro-industrial residue
Microwave
Carboxymethylation of cellulose
a b s t r a c t
Cellulose was extracted from brewer’s spent grain (BSG) by alkaline and bleaching treatments. The
extracted cellulose was used in the preparation of carboxymethyl cellulose (CMC) by reaction with
monochloroacetic acid in alkaline medium with the use of a microwave reactor. A full-factorial 23 central
composite design was applied in order to evaluate how parameters of carboxymethylation process such
as reaction time, amount of monochloroacetic acid and reaction temperature affect the average degree of
substitution (DS) of the cellulose derivative. An optimization strategy based on response surface methodology has been used for this process. The optimized conditions to yield CMC with the highest DS of 1.46
follow: 5 g of monochloroacetic acid per gram of cellulose, reaction time of 7.5 min and temperature
of 70 ◦ C. This work demonstrated the feasibility of a fast and efficient microwave-assisted method to
synthesize carboxymethyl cellulose from cellulose isolated of brewer’s spent grain.
© 2015 Elsevier Ltd. All rights reserved.
1. Introduction
Carboxylmethylcellulose is the most widely used cellulose ether
today, with applications in paper, textile, pharmaceutical, food
exploration and paint industries (Singh & Khatri, 2012). Production of carboxymethyl cellulose is carried out commercially on a
large scale, by the slurry process and includes two steps; first,
cellulose fibers are swollen in concentrated NaOH solution then,
still under conditions, the hydroxyl groups of cellulose react with
the monochloroacetic acid (MCA) (Bhandari, Jones, & Hanna, 2012;
Heinze & Koschella, 2005).
The etherification processes commonly employed for the production of carboxymethyl cellulose require temperature between
40 and 80◦ C and long reaction time (1–6 h) (Cheng & Biswas,
2011; Heinze & Koschella, 2005; Singh & Khatri, 2012). Under these
conditions, the occurrence of side reactions, such as depolymerization of cellulose and the formation of sodium glycolate, negatively
affect both the yield of the process and the characteristics of the
derivatives obtained, and the development of conversion processes
∗ Correspondence to: Unidade de Ciências Exatas e Tecnológicas, Universidade
Estadual de Goiás, Br 153 no. 3.105 - Fazenda Barreiro do Meio, P.O. Box 459,
Anápolis, GO, Brazil, Postal Code 75132-903. Tel.: +55 16 34190656.
E-mail addresses: danilomartins (D.M.d. Santos),
andrea (A.d.L. Bukzem),
(D.P.R. Ascheri), (R. Signini),
(G.L.B.d. Aquino).
/>0144-8617/© 2015 Elsevier Ltd. All rights reserved.
that minimize the occurrence of side reactions, the reaction time
and amount of reagents employed and energy is very important.
In recent years, microwave chemistry has become increasingly
popular within the organic synthesis (Gawande, Shelke, Zboril,
& Varma, 2014; Moseley & Kappe, 2011). Compared with conventional heating, microwave-assisted heating, under controlled
conditions, has been shown to be an advanced technology in
reducing reaction time besides increasing product yield and purity
(Caddick & Fitzmaurice, 2009; Nuchter, Ondruschka, Bonrath, &
Gum, 2004; Zhu & Chen, 2014). Microwave irradiation–assisted
synthesis and modification has been widely used in chemical
functionalization of polymer materials. It has been developed for
cellulose modification processes including acetylation (Li et al.,
2009) and carboxymethylation (Biswas, Kim, Selling, & Cheng,
2014). Therefore, microwave irradiation is a promising method to
modify the physical–chemical properties of cellulose.
Most of the sources of cellulose that were modified to carboxymethyl cellulose are wood and cotton (Singh & Singh, 2013).
However, many others resources could be used such as corn cobs
(Singh & Singh, 2013), rice straw (Ragheb, Nassar, Abd El-Thalouth,
Ibrahim, & Shahin, 2012), cotton by-products (Cheng & Biswas,
2011), cavendish banana pseudo stem (Adinugraha, Marseno, & H,
2005), however none of them uses the brewer’s spent grain (BSG)
as a cellulose source.
Brewer’s spent grain is the main solid by-product generated in
the brewing process. Approximately 15–20 kg of BSG is produced
126
D.M.d. Santos et al. / Carbohydrate Polymers 131 (2015) 125–133
per every hectolitre of beer, which corresponds to an annual production of more than 34 million tons of wet BSG (8.5 million
tons of dry BSG) (Mussatto, Dragone, & Roberto, 2006; Xiros &
Christakopoulos, 2012). This material is composed of the barley
malt residual constituents and includes the barley grain husk in
the greatest proportion, and also minor fractions of pericarp and
fragments of endosperm (Forssell et al., 2008).
BSG is rich in cellulose (16–21%), hemicellulose (15–29%), lignin
(19–28%) and proteins (24–39%) (Meneses, Martins, Teixeira, &
Mussatto, 2013; Mussatto, Rocha, & Roberto, 2008; Pires, Ruiz,
Teixeira, & Vicente, 2012). Some recent studies suggest the possibility of reusing this material for industrial applications such as the
production of activated carbon (Poerschmann et al., 2014), ethanol
(Forssell et al., 2008) and xylitol (Mussatto & Roberto, 2008), but
BSG is still traditionally used as a relatively low value cattle feed
(Niemi, Martins, Buchert, & Faulds, 2013). So, there is a need to find
new value-added end-uses for this by-product.
The aim of this work was to increase the economic value of
brewer’s spent grain by the extraction of the cellulosic component from this by-product through chemical methods. The obtained
cellulose was used in the preparation of carboxymethyl cellulose,
which has many important industrial applications. Carboxymethyl
cellulose was obtained through reaction of the extracted cellulose with monochloroacetic acid in alkaline medium employing
microwave reactor.
2. Materials and methods
2.1. Materials
Brewer’s spent grains (BSG) were supplied by Ambev, S.A.
(Anápolis, Goiás, Brazil). As soon as obtained, the material (approx.
80% moisture content) was dried at 105 ◦ C to 94% dry matter. Then
the dried BSG was milled using a knife mill fitted with a 1 mmsized grating and used in all experiments. Sodium chlorite (NaClO2 ),
monochloroacetic acid (MCA), sodium hydroxide and isopropanol
were obtained from Sigma-Aldrich. All of the other reagents were
analytical grade and were used without further purification.
2.2. Cellulose extraction from Brewer’s spent grains (BSG)
2.2.1. Alkaline treatment
Initially, the dried BSG was treated with a 2% (w/w) sodium
hydroxide aqueous solution in a solid:liquid ratio of 1:20 (w:v)
for 2 h at 90 ◦ C, as reported by Mussatto et al. (2006b) with some
modifications. The obtained black slurry was filtered and the solid
material was washed several times with distilled water until the
alkali was completely removed, and dried at 50 ◦ C for 12 h in an
air-circulating oven. The yield was calculated based on the dried
solid product weight and the starting weight.
2.2.2. Bleaching process
After the alkali treatment, the fibers were treated with a solution made up of equal parts (v:v) of acetate buffer and aqueous
sodium chlorite (2 wt% NaClO2 in water) in a solid:liquid ratio of
1:50 (w:v) for 4 h at 80 ◦ C. Then the mixture was allowed to cool
and was filtered using excess distilled water until the pH of the
fibers became neutral. The bleached fibers were dried at 50 ◦ C for
12 h in an air-circulating oven. The bleaching process was carried
out in a single step. The yield was calculated based on the dried
solid product weight and the starting weight.
2.3. Preparation of carboxymethyl cellulose (CMC)
Synthesis of CMC was carried out in two steps i.e., alkalization
and etherification under heterogeneous conditions. Alkalization
Table 1
Uncoded and coded levels of the independent variables of the carboxymethylation
process.
Independent variables
Time (min.)
MCA/celullose (g/g)
Temperature (◦ C)
Symbol
X1
X2
X3
Levels
−1
0
1
2.5
2
70
5
3.5
80
7.5
5
90
was conducted into glass reaction vessels with an internal volume 35 mL as follows: bleached cellulose (0.5 g) was suspended
in isopropanol (2 mL) and 2 mL of 40% (w/v) aqueous NaOH was
added dropwise under magnetic stirring at room temperature over
a period of 15 min.
The etherification was carried out in a monomode microwave
reactor (Discover-SP DC-7196, CEM, USA). The desired amount of
monochloroacetic acid (MCA) was dissolved in 2 mL of isopropanol.
The mixture was subjected to microwave irradiation at 200 W up
to the desired temperature (70–90 ◦ C) and stirred at that temperature for the desired duration (2.5–7.5 min). When the irradiation
was complete, the slurry was neutralized with glacial acetic acid
and then filtrated. The solid obtained as CMC was washed with
70% ethanol for four times to remove undesirable by-products. The
obtained cellulose derivative (CMC) was dried at 60 ◦ C in an oven.
For the purification of these derivatives, 1.5 g of the sample was dissolved in 750 mL of aqueous 0.4 mol L−1 NaCl. The
resulting solution was submitted to positive filtration through
0.45 m membrane (Millipore® ) and the carboxymethyl cellulose
was precipitated upon addition of ethanol. Subsequently, the carboxymethyl cellulose was sequentially washed with ethanol/water
mixtures of increasing ethanol content (70%, 80%, and 90%), with
absolute ethanol and then it was dried at room temperature. This
procedure resulted in purified sodium carboxymethyl cellulose
samples.
2.4. Experimental design
A full-factorial 23 central composite design was employed to
analyze the main effects and interactions of the following variables:
reaction time, amount of monochloroacetic acid (MCA) per gram of
cellulose and reaction temperature on the average degree of substitution (DS). The independent variables and their levels are shown
in Table 1. Maximum and minimum treatment levels were chosen
by carrying out preliminary screening tests. Each experiment was
performed in triplicate.
2.5. Characterization of brewer’s spent grain fibers and
carboxymethyl cellulose
2.5.1. Chemical composition of brewer’s spent grain fibers
The chemical composition of the BSG at each stage of
treatment was measured as follows: the holocellulose (␣cellulose + hemicellulose) and cellulose content were estimated
according to standard methods (Browning, 1967). The ␣-cellulose
content was determined treating the holocellulose with potassium
hydroxide solutions (Browning, 1967). The hemicellulose content
was found by subtracting the ␣-cellulose part from the holocellulose content. The lignin content was determined according to
a standard method of Technical Association of Pulp and Paper
Industry TAPPI T222 om-88. The viscosity of pulp (cP) dissolved
in a cupriethylene-diamine solution was determined according to
Tappi standard (T230 om-99). An average of three measurements
was calculated for each sample.
D.M.d. Santos et al. / Carbohydrate Polymers 131 (2015) 125–133
2.5.2. Determination of average degree of substitution (DS)
The average degree of substitution of CMC was determined
according to the methodology proposed by Ho and Klosiewicz
(1980), with modifications. For this purpose, the CMC samples were
hydrolyzed in a mixture of 25% (v/v) D2 SO4 /D2 O (75 mg mL−1 ) 1.5 h
at 90 ◦ C. The 1 H NMR spectra were obtained at room temperature
on a Bruker AVANCE III 500–11.75 Tesla spectrometer operating at
500.13 MHz. The chemical shifts were expressed in dimensionless
values (ppm) relative to an internal standard of acetic acid.
2.5.3. Field emission scanning electron microscopy (FE-SEM)
A field emission scanning electron microscope (LEO-440) was
used to evaluate the surface morphology of the untreated, alkalitreated, bleached brewer’s spent grain fibers and carboxymethyl
cellulose. The acceleration voltage was 15 kV. Prior to analysis, the
samples were coated with an ultrathin gold layer in a sputter coating system.
2.5.4. Fourier transform infrared (FTIR) spectroscopy
Fourier transform infrared spectra were recorded using a
Perkin-Elmer FTIR spectrophotometer. Samples were finely ground
and mixed with potassium bromide, KBr. The mixture was then
compressed into pellet form. FTIR spectral analysis was performed
within the wave number range of 400–4000 cm−1 .
2.5.5. X-ray diffraction (XRD)
XRD patterns of samples were obtained using an X-ray diffractometer (D8 Advance, Bruker AXS) equipped with CuK␣ radiation
˚ in the 2Â range 5–50◦ with a scan rate of 5◦ per min
( = 1.5406 A)
at room temperature. The operating voltage was 40 kV, and the
current was 40 mA.
2.5.6. Thermogravimetric analysis (TGA)
The thermal stability of the different samples was determined
by TGA measurements carried out using a Shimadzu TGA 50 equipment. The amount of sample used for each measurement was
approximately 7 mg. All measurements were carried out under a
nitrogen atmosphere with a gas flow of 50 mL min−1 by heating
the material from room temperature to 600 ◦ C at a heating rate of
10 ◦ C min−1 .
2.6. Statistical analysis
The statistical treatment of the experimental data consisted
in fitting a polynomial function to the set of experimental data
collected from full-factorial 23 central composite design. Multiple
regression analysis was used to fit Eq. (1) to the experimental data
by means of the least squares method.
Y = ˇ0 + ˇ1 X1 + ˇ2 X2 + ˇ3 X3 + ˇ12 X1 X2 + ˇ13 X1 X3
+ ˇ23 X2 X3 + ˇ123 X1 X2 X3 + ε
127
3. Results and discussion
3.1. Chemical composition of fibers
The chemical composition of the BSG was determined at each
stage of treatment and the data are summarized in Table 2. The original brewer’s spent grain contained 45.87 wt% holocellulose, 22.36
wt% cellulose, 20.09 wt% ␣-cellulose, 25.78 wt% hemicellulose
and 30.48 wt% lignin. The values found for the main constituents
of brewer’s spent grain are in agreement with literature data
(Meneses et al., 2013; Mussatto et al., 2008; Pires et al., 2012).
It was found that at the end of the chemical treatment the cellulose and ␣-cellulose content increased from 22.36% to 90.12% and
from 20.09% to 89.71%, respectively. The alkali and bleaching treatments were efficient in removing hemicellulose and lignin, which
decreased from 25.78% to 5.97% and from 30.48% to 3.23%, respectively, following treatments. The sum of the percentage of cellulose,
hemicelluloses and lignin to the brewer’s spent grain after bleaching stage corresponds to 99.32% of the total dry matter, therefore
the treatment not only removed hemicelluloses and lignin but also
other components such as proteins, extractives and ash.
Viscosity was strongly decreased after bleaching (from 16.80 to
9.18 cp), indicating that the average cellulose chain length (polymerization degree) was reduced, since viscosity loss occurs due to
the cleavage of glycosidic bonds in this polysaccharide chain. The
yield after alkaline treatment was 22.96% while after the bleaching treatment was 66.96% (Table 2). Therefore, starting from 100 g
of brewer’s spent grain was possible to obtain 15.37 g of pulp at
the end of the chemical treatments. The composition and viscosity
of the fibers after bleaching is quite suitable for the production of
carboxymethyl cellulose (Heinze & Koschella, 2005).
3.2. Preparation of CMC from cellulose
The manufacturing of carboxymethyl cellulose involved two
reaction stages. In the first stage, cellulose was treated with NaOH,
in the presence of isopropanol, which acts both as a swelling agent
and as a dilutant and facilitates penetration of NaOH into the cellulose structure. In the second stage, carboxymethyl cellulose was
synthesized by reacting monochloroacetic acid (MCA) and alkali
cellulose under microwave irradiation (Gu, He, Huang, & Guo, 2012;
Singh & Khatri, 2012).
The various properties of sodium carboxylmethylcellulose
depend upon three factors: molecular weight of the polymer, average number of carboxyl content per anhydroglucose unit [degree
of substitution (DS)] and the distribution of carboxyl substituents
along the polymer chains (Ruzene, Gonc¸alves, Teixeira, & Pessoa
de Amorim, 2007). The DS is most important factor because the
industrial utility of the CMC exclusively depends on the DS (Singh
& Singh, 2013) so all the optimization experiments were done with
respect to the DS and not the yield.
(1)
where, Y represents the predicted response, ˇ0 , is the model intercept, ˇ1 , ˇ2 , ˇ3 , and ˇ12 , ˇ13 , ˇ23 , ˇ123 , are linear and interaction
coefficients respectively, and X1 , X2 and X3 are the independent
variables. ε corresponds to the model residue.
The statistical significance of the model was determined by evaluating the p-value, F-value and lack of fit with 95% confidence level
obtained from the analysis of variance (ANOVA). The extent of fitting of the experimental results to the polynomial model equation
was expressed by the adjusted coefficient of determination (R2 adj ).
Response surface was obtained by using the fitted model and keeping one independent variable constant and varying the other two
variables. All calculations and graphs were obtained by the Statistica software (Statsoft version 7.0, USA).
Table 2
Chemical composition of brewer’s spent grain at different stages of treatment.
Parameter
BSGa
After alkali treatmenta
Holocelullose (%)b
Cellulose (%)
␣-cellulose (%)
Hemicellulose (%)
Lignin (%)
Others (%)c
Viscosity (cP)
Yield (%)
45.87 ± 1.24
22.36 ± 0.41
20.09 ± 0.86
25.78 ± 0.97
30.48 ± 0.54
21.38 ± 1.06
–
–
81.80
66.43
64.71
17.09
11.85
4.63
16.80
22.96
a
b
c
±
±
±
±
±
±
±
±
1.16
0.87
1.23
1.10
0.27
0.34
0.19
0.34
Values are mean ± SD of three replicates.
Hollocelulose (%) = ␣-celullose (%) + Hemicelullose (%).
Other components include ashes, protein and extractive.
After bleachinga
95.68
90.12
89.71
5.97
3.23
0.62
9.18
66.96
±
±
±
±
±
±
±
±
0.29
0.71
1.05
0.92
0.03
0.04
0.06
0.99
128
D.M.d. Santos et al. / Carbohydrate Polymers 131 (2015) 125–133
Table 3
Independent variables of the full-factorial 23 central composite design and the experimental results.
Assay
1
2
3
4
5
6
7
8
9
10
11
12
a
Temperature (◦ C)
MCAa /cellulose (g/g)
Time (min.)
2.50 (−1)
2.50 (−1)
2.50 (−1)
2.50 (−1)
7.50 (+1)
7.50 (+1)
7.50 (+1)
7.50 (+1)
5.00 (0)
5.00 (0)
5.00 (0)
5.00 (0)
2.00 (−1)
2.00 (−1)
5.00 (+1)
5.00 (+1)
2.00 (−1)
2.00 (−1)
5.00 (+1)
5.00 (+1)
3.50 (0)
3.50 (0)
3.50 (0)
3.50 (0)
DS
70.00 (−1)
90.00 (+1)
70.00 (−1)
90.00 (+1)
70.00 (−1)
90.00 (+1)
70.00 (−1)
90.00 (+1)
80.00 (0)
80.00 (0)
80.00 (0)
80.00 (0)
Distribuition of substituent
0.62
0.58
1.23
1.22
0.54
0.64
1.46
1.42
0.93
0.84
0.91
0.91
C2
C3
C6
0.32
0.28
0.51
0.50
0.26
0.25
0.61
0.65
0.48
0.45
0.46
0.48
0.10
0.12
0.34
0.33
0.10
0.19
0.35
0.33
0.17
0.15
0.18
0.16
0.20
0.18
0.38
0.39
0.18
0.20
0.5
0.44
0.28
0.24
0.27
0.27
MCA = monochloroacetic acid.
The 1 H NMR spectroscopy used to evaluate the distribution
of the carboxymethyl substituents at the C2 , C3 , and C6 hydroxyl
groups of the cellulose polymer chains and determine the degree
of substitution (DS). The degree of substitution of the samples was
calculated using the Eq. (2).
The previous work on the optimization of the carboxymethylation reaction has shown that DS depends on various reaction
parameters such as reaction temperature, reaction time and
monochloroacetic acid concentration (Adinugraha et al., 2005;
Barai, Singhal, & Kulkarni, 1997; Pushpamalar, Langford, Ahmad,
& Lim, 2006; Singh & Singh, 2013). Hence, to optimize the CMC
preparation conditions and the relationship between these factors,
a full-factorial 23 central composite design and response surface
methodology were applied to determine the optimal levels of the
selected three variables (Table 3).
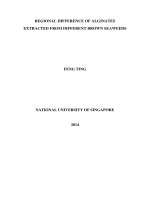
The 1 H NMR spectroscopy was used to study the completely
depolymerized samples. The representative spectra are shown in
Fig. 1. The set of doublets in the spectral region between 4.5
and 5.5 ppm at the lower field can be assigned to the proton
at C1 of the ␣-anomer, while the set of doublets at the higher
field was attributed to the proton at C1 of the -anomer. The
S and U identifications of the doublets in Fig. 1 refer to substituted and unsubstituted hydroxyl group at C2 , respectively. The
signals between 3 and 4 ppm correspond to the protons of the glucose unit. Protons from the carboxymethyl ( OCH2 COO ) group
were observed in a spectral region between 4.0 and 4.5 ppm (Ho &
Klosiewicz, 1980).
DS =
a/2
(2)
b/6 + c /2
where, a = Integral which refers to methylene protons of carboxymethyl (4 ppm < ı < 4,5 ppm); b = Integral which refers to the
C H protons of the glucose unit (3< ı < 4 ppm); c = Integral which
refers to the set of doublets in the spectral region between 4.5 and
5.5 ppm.
The distribution of the carboxymethyl groups at C2 , C3 , C6 were
determined based on the Eqs. (3)–(5).
c2 = DS IC(2)˛ + IC(2)ˇ /IC(2)˛ + IC(2)ˇ + IC(3) + IC(6)
(3)
c3 = DS IC(3) /IC(2)˛ + IC(2)ˇ + IC(3) + IC(6)
(4)
c6 = DS IC(6) /IC(2)˛ + IC(2)ˇ + IC(3) + IC(6)
(5)
–OCH2COO-Na+
H6
H1
H3
H2
H2, H3, H4, H5 and H6
Anomeric hydrogen
H1α
S
5.5
Glicoside ring
H1β
U
S
α
β
U
5.0
4.5
4.0
3.5
3.0
2.5
2.0
ppm
Fig. 1. H1 NMR spectrum of a CMC sample with DS = 1.46 obtained under the conditions of assay 7 (7.5 min.; 5 g of MCA/g of cellulose; 70 ◦ C).
D.M.d. Santos et al. / Carbohydrate Polymers 131 (2015) 125–133
129
Table 4
Analysis of variance (ANOVA) results.
Source of variationa
Sum of square
df
Mean square
F-value
X1
X2
X3
X1 .X2
X1 .X3
X2. X3
Lack of fit
Pure error
Total SS
R2 adj. = 0.9620
0.021013
1.087813
0.000013
0.025313
0.001513
0.001513
0.015317
0.004675
1.157167
1
1
1
1
1
1
2
3
11
0.021013
1.087813
0.000013
0.025313
0.001513
0.001513
0.007658
0.001558
13.4840
698.0615
0.0080
16.2433
0.9706
0.9706
4.9144
a
b
c
d
p-value
0.034950b
0.000119c
0.934279d
0.027460c
0.397174d
0.397174d
0.113083d
X1 = Time (min.); X2 = MCA/celullose (g/g); X3 = Temperature.
= Significant at 5% probability (p < 0.05).
= Significant at 1% probability (p < 0.01).
= Non-significant.
where, I represents the integral value of the peaks of C3 , C2 ␣, C2 ,
and C6 , respectively (Gu et al., 2012). A summary of these data is
presented in Table 3.
It can be noted that the DS varied to each condition employed
(from 0.54, assay 5, to 1.46, assay 7). It is generally observed that
there is slightly more substitution at C2 than at C6 , with the least
amount at C3 , indicating that the relative reactivity of the hydroxyl
groups is in the following order: OH(2) > OH(6) > OH(3).
3.3. Statistical analysis and the model fitting
Table 4 shows the coefficients of the variables in the models
that were calculated using the least square technique, and their
statistical significances were analised by ANOVA. The F-value and pvalue was used as a tool to check the significance of each parameter.
It can be seen from Table 4, the predominant effect on the developed
model for the degree of substitution corresponded to the linear
term amount of monochloroacetic acid (MCA) (X2 ), followed by the
interaction term between time and amount of monochloroacetic
acid (X1 .X2 ) and the linear term of time(X1 ). Other terms, such as the
linear terms of temperature (X3 ) and the interaction terms (X1 .X3
and X2 .X3 ) are not significant (p > 0.05).
The fitted model for DS without the non-significant terms and
in uncoded form is given in Eq. (6).
DS = 0.20 − 0.076X1 + 0.24X2 − 0.015X1 X2
(6)
The model for degree of substitution showed a good fit with the
experimental data, as the value of adjusted determination coefficient (R2 adj. ) was 0.9620. This confirms that the fitted model could
explain above 96.00% of the total variability within the range of
values studied. The lack of fit is an indication of the failure of a
model representing the experimental data at which points are not
included in the regression or variations in the models cannot be
accounted for random error. The non-significant value of lack of fit
(p-value > 0.05) revealed that the model is statistically significant
for the response.
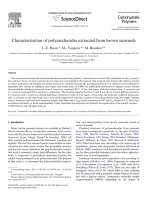
Three-dimensional surface was generated based on Eq. (6) and
is shown in Fig. 2 which present the relationship between time and
amount of monochloroacetic acid on the degree of substitution.
It was found that increasing the reaction time and the amount of
monochloroacetic acid results in larger values DS. The increase in
DS with increasing amounts of monochloroacetic acid and reaction
time is due to the fact that there is a better reaction environment
created (i.e., greater availability of the acid molecules at higher
concentrations) and a prolonged time available for carboxymethylation. Similar findings have been reported by Barai et al. (1997)
and Singh and Singh (2013).
Based on Table 3 and in Fig. 2, the optimum conditions for
carboxymethylation were achieved using 5 g de monochloracetic
acid per gram of cellulose and carrying out the reaction at 70 ◦ C
for 7.5 min. Under these conditions, it was possible to obtain carboxymethyl cellulose with DS of 1.46. In addition, microwave heat
allowed obtaining CMC samples with similar DS values compared to
the obtained by conventional heat. However, the average reaction
time when using conventional heat (1–6 h) for carboximethylation
is much greater than microwave heat (Biswas et al., 2014; Heinze
& Koschella, 2005; Pushpamalar et al., 2006; Singh & Khatri, 2012).
Microwave technology thus appears to be promising in CMC synthesis as a means to reduce reactions times, thereby potentially
increasing throughput and reducing energy cost.
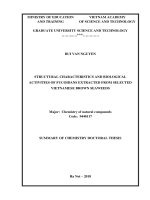
3.4. Morphological analysis
The morphological changes of the brewer’s spent grain fibers
after each stage of treatment were evaluated by field emission
scanning electron microscopy (Fig. 3). The untreated BSG presents
smooth surface (Fig. 3a) and diameter in the range 150–350 m.
After alkali treatment (Fig. 3b), the fiber surface becomes rougher
and the diameter decrease to 80–200 m. The effect of bleaching treatment was evident from the comparison of micrographs
in Fig. 3b and c. It can be seen that the BSG fiber bundles separated
into individual fibers whose diameters were in the range 5–30 m.
These morphological changes are due to the progressive removal
of the outer non-cellulosic layer composed of materials such as
Fig. 2. Response surface plot show the effect of reaction time and amount of
monochloroacetic acid on the response variable degree of substitution DS.
130
D.M.d. Santos et al. / Carbohydrate Polymers 131 (2015) 125–133
Fig. 3. Scanning electron micrographs (magnification: 1500×) of (a) brewer’s spent grain (BSG), (b) alkali-treated BSG, (c) bleached BSG, and (d) carboxymethyl cellulose
obtained under the conditions of assay 7 (7.5 min.; 5 g of MCA/g of cellulose; 70 ◦ C).
hemicelluloses, lignin, wax, and other impurities contained in the
brewer’s spent grain upon chemical treatments.
The SEM micrograph of carboxymethyl cellulose, synthesized
via chemical modification cellulosic fibers is given in Fig. 3d. It was
observed that the carboxymethyl cellulose appear to be irregular
and relatively smooth. This morphological change as compared to
bleached fiber was ascribed to the heterogeneous introduction of
the bulky carboxymethyl groups into the fiber surface after carboxymethylation.
The peaks at 1053 and 895 cm−1 are associated with the C O
stretching and C H rock vibrations of cellulose (Alemdar & Sain,
2008), which appeared in all of the spectra. The increment of these
peaks is directly related to the increase in the cellulosic components
percentages.
3.5. FTIR spectroscopy analysis
Fourier transform infrared spectroscopy (FTIR) allows the
characterization of a chemical structure by identifying the functional groups present in each sample. Fig. 4 shows the FTIR
spectra recorded for (a) untreated BSG, (b) alkali-treated BSG, (c)
bleached BSG and (d) carboxymethyl cellulose. The peak located
at 1739 cm−1 that is see in the spectrum of the untreated BSG can
be attributed either to the acetyl and uronic ester groups of the
hemicelluloses or to the ester linkage of carboxylic group of the
ferulic and p-coumeric acids of lignin and/or hemicelluloses (Sun
et al., 2005). This peak almost disappeared after the bleaching
treatment, indicating the removal of most of the hemicelluloses
and lignin from the BSG. The peak at 1526 cm−1 in the spectrum
of the untreated brewer’s spent grain represent the aromatic C C
of the aromatic rings of lignin. The peak observed at 1247 cm−1
corresponds to C O C (aryl–alkyl ether) (Sheltami, Abdullah,
Ahmad, Dufresne, & Kargarzadeh, 2012). These two peaks disappeared after the bleaching treatment, which suggests the removal
of lignin.
Fig. 4. FTIR spectra of (a) brewer’s spent grain (BSG), (b) alkali-treated BSG, (c)
bleached BSG, and (d) carboxymethyl cellulose obtained under the conditions of
assay 7 (7.5 min.; 5 g of MCA/g of cellulose; 70 ◦ C).
D.M.d. Santos et al. / Carbohydrate Polymers 131 (2015) 125–133
131
Fig. 5. X-ray diffractograms for (a) brewer’s spent grain (BSG), (b) alkali-treated BSG,
(c) bleached BSG, and (d) carboxymethyl cellulose obtained under the conditions of
assay 7 (7.5 min.; 5 g of MCA/g of cellulose; 70 ◦ C).
The occurrence of carboxymethylation was confirmed by
infrared spectroscopy. The IR spectra of the prepared CMC were
recorded, as displayed in Fig. 4 which shows that the appearance
of the typical band at 1610 cm−1 associated with the presence of
the carboxylate anion COO− and confirms the formation of CMCNa
(Heinze & Koschella, 2005).
3.6. X-ray diffraction (XRD)
The X-ray diffraction patterns obtained for untreated, alkalitreated, bleached brewer’s spent grain as well as for the
carboxymethyl cellulose are show in Fig. 5. It is observed that the
diffractogram of brewer’s spent grain has a main peak at 2Â = 21.5◦
and a discrete peak at 2Â = 34.7◦ . Three peaks can be observed for
alkali-treated BSG and bleached BSG at 2Â = 16.0◦ , 22.2◦ and 34.7◦ .
They are typical of cellulose I and become more defined upon
chemical treatments (Azubuike, Rodríguez, Okhamafe, & Rogers,
2012; Chen et al., 2011; Flauzino Neto, Silvério, Dantas, & Pasquini,
2013; Kumar, Negi, Bhardwaj, & Choudhary, 2012). The crystallinity
index (CrI) of all samples was calculated following the amorphous
subtraction method proposed by Park, Baker, Himmel, Parilla, &
Johnson (2010). By this method, the CrI was found to be 27.3%,
46.7% and 56.5% for untreated BSG, alkali-treated BSG and bleached
BSG, respectively. The higher CrI value of bleached BSG compared
to alkali-treated BSG and untreated BSG is due to the removal of
amorphous non-cellulosic compounds such as lignin and hemicellulose by the alkali and bleaching treatments carried out in the
purification process.
The comparison of the X-ray patterns of bleached fibers and
carboxymethyl cellulose revealed that the carboxymethylation of
fibers provoked important changes in the arrangement of the
polymer chains in the solid state. It can be seen that after carboxymethylation all characteristic peaks for bleached fibers have
almost disappeared and transformed into an amorphous phase.
Although the diffractogram of carboxymethyl cellulose have not
been quantitatively treated to determine the CrI, it is assumed that
the carboxymethyl cellulose adopt a less ordered arrangement as
compared to bleached fibers. This is attributed to the presence of
the carboxymethyl moieties which substitute the hydrogen atoms
of the hydroxyl groups of cellulose affecting the establishment of
hydrogen bonds involving these groups that are responsible for the
adoption of a more ordered arrangement by the cellulose (Johar,
Ahmad, & Dufresne, 2012).
Fig. 6. (a) TG and (b) DTG curves for brewer’s spent grain (BSG), alkali-treated BSG,
bleached BSG, and carboxymethyl cellulose obtained under the conditions of assay
7 (7.5 min.; 5 g of MCA/g of cellulose; 70 ◦ C).
3.7. Thermogravimetric analysis
Fig. 6 shows the TGA and derivative thermogravimetry DTG
curves obtained for raw brewer’s spent grain, as well as those
obtained after alkali treatment and bleaching and for carboxymethyl cellulose. In all cases, an initial weight loss of the fibers
occurs in the range of 35–150 ◦ C, due to the evaporation of adsorbed
and bound water (Flauzino Neto et al., 2013).
Degradation of hemicellulose and cellulose starts at temperatures 220 and 250 ◦ C, respectively, while lignin degrades at a lower
temperature, 200 ◦ C (Morán, Alvarez, Cyras, & Vázquez, 2008). At
higher temperatures lignin is more heat resistant than hemicelluloses and cellulose, due to its low degradation rate. The weight
loss between 200 and 300 ◦ C is mainly due to hemicelluloses
decomposition and the parallel slow decomposition of lignin, while
the weight loss between 250 and 500 ◦ C is attributed to cellulose (250–350 ◦ C) and lignin (200–500 ◦ C) decomposition (Nanda
et al., 2013). At temperatures higher than 400 ◦ C, there is oxidation
and breakdown of the charred residue to lower molecular weight
gaseous products (Morán et al., 2008).
By the comparison of the untreated and alkali treated fibers,
it was observed that the bleaching treatment induces an increase
in the materials thermal stability. This is due to the presence
of hemicellulose and lignin in the chemical composition of the
untreated and alkali treated BSG fibers. These components have a
lower decomposition temperature compared to cellulose and their
progressive removal improves the thermal stability of the fibers.
The lower thermal stability of alkali treated compared to
the bleached fibers is attributed to the partial elimination of
132
D.M.d. Santos et al. / Carbohydrate Polymers 131 (2015) 125–133
non-cellulosic material. However, after 400 ◦ C, the thermal stability
order of the materials is reversed, because lignin at higher temperature is more heat resistant than hemicelluloses and cellulose.
In the DTG curve for BSG, a shoulder is observed at around
300 ◦ C, but is no longer present after the chemical treatments,
which very likely reflects the removal of a portion of the hemicellulose. The weight fraction of material that still exists after heating
between 400 ◦ C and 600 ◦ C is representative of the carbon content
in the fibers. The increased residue amount at high temperature,
or the char fraction, for BSG compared to chemically treated fibers
is due to the presence of ash as well as lignin. As it can be seen
in Fig. 6, the amount of residue at temperature around 600 ◦ C in
bleached fibers was only 5%.
Fig. 6 shows that the introduction of carboxymethyl groups in
the cellulose chain decreased the thermal stability of the polymer.
The decrease in the thermal stability of the carboxymethyl cellulose
as compared to the parent cellulose is justified by the presence of
the negatively charged carboxymethyl groups and is supported by
the X-ray diffraction analyses which evidenced the less ordered
arrangement of CMC.
4. Conclusions
The present work shows that cellulose can be isolated from
brewer’s spent grain. Chemical treatment with alkali and sodium
chlorite removed the non-cellulosic constituents resulting in fibers
with high content of cellulose and ␣-cellulose, hence suitable for
production of carboxymethyl cellulose. The results obtained suggest that BSG is an industrial by-product with great potential to
be a feedstock for producing this derivative. The carboxymethylation of cellulose was successfully achieved and samples of different
average degrees of substitution (0.58 < DS < 1.46) were prepared
according to the reaction conditions employed. The use of a higher
amount of monochloroacetic acid and reaction time resulted in the
more substituted samples but the reaction temperature did not
strongly affect the average degree of substitution. Using optimized
set of conditions: 5 g of monochloroacetic acid per gram of cellulose; reaction time of 7.5 min and temperature of 70 ◦ C, CMC having
a DS of 1.46 can be prepared.
Acknowledgments
The authors would like to thank the State University of Goiás
(UEG) for the research stimulation grant (BIP) and revision of the
article. FAPEG, CAPES and CNPq for their financial support.
References
Adinugraha, M. P., Marseno, D. W., & Haryadi. (2005). Synthesis and characterization of sodium carboxymethylcellulose from cavendish banana pseudo stem
(Musa cavendishii LAMBERT). Carbohydrate Polymers, 62(2), 164–169. http://dx.
doi.org/10.1016/j.carbpol.2005.07.019
Alemdar, A., & Sain, M. (2008). Isolation and characterization of nanofibers from
agricultural residues—Wheat straw and soy hulls. Bioresource Technology, 99(6),
1664–1671. DOI />Azubuike, C., Rodríguez, H., Okhamafe, A., & Rogers, R. (2012). Physicochemical properties of maize cob cellulose powders reconstituted from ionic liquid solution.
Cellulose, 19(2), 425–433. DOI 10.1007/s10570-011-9631-y.
Barai, B. K., Singhal, R. S., & Kulkarni, P. R. (1997). Optimization of a process for
preparing carboxymethyl cellulose from water hyacinth (Eichornia crassipes).
Carbohydrate Polymers, 32(3–4), 229–231. DOI />Bhandari, P. N., Jones, D. D., & Hanna, M. A. (2012). Carboxymethylation of cellulose using reactive extrusion. Carbohydrate Polymers, 87(3), 2246–2254. DOI
/>Biswas, A., Kim, S., Selling, G. W., & Cheng, H. N. (2014). Conversion of agricultural
residues to carboxymethylcellulose and carboxymethylcellulose acetate. Industrial Crops and Products, 60(0), 259–265. />2014.06.004
Browning, B. L. (1967). Methods of wood chemistry. New York: John Wiley & Sons.
Caddick, S., & Fitzmaurice, R. (2009). Microwave enhanced synthesis. Tetrahedron,
65(17), 3325–3355. DOI />Chen, W., Yu, H., Liu, Y., Chen, P., Zhang, M., & Hai, Y. (2011). Individualization of
cellulose nanofibers from wood using high-intensity ultrasonication combined
with chemical pretreatments. Carbohydrate Polymers, 83(4), 1804–1811. DOI
/>Cheng, H. N., & Biswas, A. (2011). Chemical modification of cotton-based natural materials: Products from carboxymethylation. Carbohydrate Polymers, 84(3),
1004–1010. DOI />Flauzino Neto, W. P., Silvério, H. A., Dantas, N. O., & Pasquini, D. (2013).
Extraction and characterization of cellulose nanocrystals from agro-industrial
residue—Soy hulls. Industrial Crops and Products, 42(0), 480–488. DOI
/>Forssell, P., Kontkanen, H., Schols, H. A., Hinz, S., Eijsink, V. G. H., Treimo, J.,
et al. (2008). Hydrolysis of brewers’ spent grain by carbohydrate degrading
enzymes. Journal of the Institute of Brewing, 114(4), 306–314. DOI 10.1002/j.20500416.2008.tb00774.x.
Gawande, M. B., Shelke, S. N., Zboril, R., & Varma, R. S. (2014). MicrowaveAssisted chemistry: synthetic applications for rapid assembly of nanomaterials
and organics. Accounts of Chemical Research, 47(4), 1338–1348. DOI 10.1021/
ar400309b.
Gu, H., He, J., Huang, Y., & Guo, Z. (2012). Water soluble carboxymethylcellulose fibers
derived from alkalization-etherification of viscose fibers. Fibers and Polymers,
13(6), 748–753. DOI 10.1007/s12221-012-0748-x.
Heinze, T., & Koschella, A. (2005). Carboxymethyl ethers of cellulose and starch—A
review. Macromolecular Symposia, 223(1), 13–40. DOI 10.1002/masy.200550502.
Ho, F. F. L., & Klosiewicz, D. W. (1980). Proton nuclear magnetic resonance spectrometry for determination of substituents and their distribution in carboxymethylcellulose. Analytical Chemistry, 52(6), 913–916. DOI 10.1021/ac50056a032.
Johar, N., Ahmad, I., & Dufresne, A. (2012). Extraction, preparation and characterization of cellulose fibres and nanocrystals from rice husk. Industrial Crops and
Products, 37(1), 93–99. DOI />Kumar, A., Negi, Y. S., Bhardwaj, N. K., & Choudhary, V. (2012). Synthesis and characterization of methylcellulose/PVA based porous composite. Carbohydrate Polymers, 88(4), 1364–1372. DOI />10.1016/j.carbpol.2012.02.019.
Li, J., Zhang, L.-P., Peng, F., Bian, J., Yuan, T.-Q., Xu, F., et al. (2009). Microwave-assisted
solvent-free acetylation of cellulose with acetic anhydride in the presence of
iodine as a catalyst. Molecules, 14(9), 3551–3566, />inward/record.url?eid=2-s2.0-70349556803&partnerID=40&md5=
e02cbf146d55cf2124e4c3e16d1149e3.
Meneses, N. G. T., Martins, S., Teixeira, J. A., & Mussatto, S. I. (2013).
Influence of extraction solvents on the recovery of antioxidant phenolic
compounds from brewer’s spent grains. Separation and Purification Technology, 108, 152–158, />Morán, J., Alvarez, V., Cyras, V., & Vázquez, A. (2008). Extraction of cellulose and
preparation of nanocellulose from sisal fibers. Cellulose, 15(1), 149–159. DOI
10.1007/s10570-007-9145-9.
Moseley, J. D., & Kappe, C. O. (2011). A critical assessment of the greenness and
energy efficiency of microwave-assisted organic synthesis. Green Chem., 13(4),
794–806. DOI 10.1039/C0GC00823K.
Mussatto, S. I., Dragone, G., & Roberto, I. C. (2006). Brewers’ spent gra generation
characteristics potential applications. Journal of Cereal Science, 43(1,), 1–14. DOI
http://dx. doi org/10.1016/j. jcs.2005.06.001.
Mussatto, S. I., Dragone, G., Rocha, G. J. M., & Roberto, I. C. (2006). Optimum
operating conditions for brewer’s spent grain soda pulping. Carbohydrate
Polymers, 64(1), 22–28, />Mussatto, S. I., & Roberto, I. C. (2008). Establishment of the optimum initial xylose concentration and nutritional supplementation of brewer’s
spent grain hydrolysate for xylitol production by Candida guilliermondii.
Process Biochemistry, 43(5), 540–546. DOI />j.procbio.2008.01.013.
Mussatto, S. I., Rocha, G. J. M., & Roberto, I. C. (2008). Hydrogen peroxide
bleaching of cellulose pulps obtained from brewer’s spent grain. Cellulose, 15(4), 641–649, />Nanda, S., Mohanty, P., Pant, K. K., Naik, S., Kozinski, J. A., & Dalai, A. K. (2013).
Characterization of North American lignocellulosic biomass and biochars in
terms of their candidacy for alternate renewable fuels. Bioenergy Research,
663–677,
/>84876969305&partnerID=40&md5=c72e7b3a6a0d56ae56311755983c8fd9.
Niemi, P., Martins, D., Buchert, J., & Faulds, C. B. (2013). Pre-hydrolysis
with carbohydrases facilitates the release of protein from brewer’s
spent grain. Bioresource Technology, 136(0), 529–534. DOI .
org/10.1016/j.biortech.2013.03.076.
Nuchter, M., Ondruschka, B., Bonrath, W., & Gum, A. (2004). Microwave assisted
synthesis—A critical technology overview. Green Chemistry, 6(3), 128–141. DOI
10.1039/B310502D.
Park, S., Baker, J. O., Himmel, M. E., Parilla, P. A., & Johnson, D. K. (2010). Cellulose
crystallinity index: Measurement techniques and their impact on interpreting
cellulase performance. Biotechnology for Biofuels, 3. DOI 10.1186/1754-6834-310.
Pires, E. J., Ruiz, H. A., Teixeira, J. A., & Vicente, A. A. (2012). A new
approach on brewer’s spent grains treatment and potential use as
D.M.d. Santos et al. / Carbohydrate Polymers 131 (2015) 125–133
lignocellulosic yeast cells carriers. Journal of Agricultural and Food Chemistry,
60(23), 5994–5999, />40&md5=81e1fa71dd5784d096021d78bf42ddbd.
Poerschmann, J., Weiner, B., Wedwitschka, H., Baskyr, I., Koehler, R.,
& Kopinke, F.-D. (2014). Characterization of biocoals and dissolved
organic matter phases obtained upon hydrothermal carbonization
of brewer’s spent grain. Bioresource Technology, 164(0), 162–169. DOI
/>Pushpamalar, V., Langford, S. J., Ahmad, M., & Lim, Y. Y. (2006). Optimization of reaction conditions for preparing carboxymethyl cellulose from sago
waste. Carbohydrate Polymers, 64(2), 312–318. DOI />j.carbpol.2005.12.003.
Ragheb, a. a., Nassar, S. H., Abd El-Thalouth, I., Ibrahim, M. a., & Shahin, a. a.
(2012). Preparation, characterization and technological evaluation of CMC
derived from rice-straw as thickening agents in discharge, discharge–resist
and burn-out printing. Carbohydrate Polymers, 89(4), 1044–1049. DOI
10.1016/j.carbpol.2012.03.054.
Ruzene, D., Gonc¸alves, A., Teixeira, J., & Pessoa de Amorim, M. (2007). Carboxymethylcellulose obtained by ethanol/water organosolv process under acid
conditions. Applied Biochemistry and Biotechnology, 137–140(1–12), 573–582.
/>
133
Sheltami, R. M., Abdullah, I., Ahmad, I., Dufresne, A., & Kargarzadeh, H. (2012).
Extraction of cellulose nanocrystals from mengkuang leaves (Pandanus tectorius). Carbohydrate Polymers, 88(2), 772–779. DOI />j.carbpol.2012.01.062.
Singh, R. K., & Khatri, O. P. (2012). A scanning electron microscope based new method for determining degree of substitution
of sodium carboxymethyl cellulose. Journal of Microscopy, 246(1),
43–52,
/>Singh, R., & Singh, A. (2013). Optimization of reaction conditions for preparing carboxymethyl cellulose from corn cobic agricultural waste. Waste and Biomass
Valorization, 4(1), 129–137. DOI 10.1007/s12649-012-9123-9.
Sun, X. F., Xu, F., Sun, R. C., Geng, Z. C., Fowler, P., & Baird, M. S. (2005). Characteristics of degraded hemicellulosic polymers obtained from steam exploded wheat
straw. Carbohydrate Polymers, 60(1), 15–26. DOI />j.carbpol.2004.11.012.
Xiros, C., & Christakopoulos, P. (2012). Biotechnological potential of brewers spent
grain and its recent applications. Waste and Biomass Valorization, 3(2), 213–232.
DOI 10.1007/s12649-012-9108-8.
Zhu, Y.-J., & Chen, F. (2014). Microwave-assisted preparation of inorganic
nanostructures in liquid phase. Chemical Reviews, 114(12), 6462–6555. DOI
10.1021/cr400366s.