Chitosan/pectin polyelectrolyte complex as a pH indicator
Bạn đang xem bản rút gọn của tài liệu. Xem và tải ngay bản đầy đủ của tài liệu tại đây (1.47 MB, 9 trang )
Carbohydrate Polymers 132 (2015) 537–545
Contents lists available at ScienceDirect
Carbohydrate Polymers
journal homepage: www.elsevier.com/locate/carbpol
Chitosan/pectin polyelectrolyte complex as a pH indicator
Vinicius Borges V. Maciel a , Cristiana M.P. Yoshida b,∗ , Telma Teixeira Franco a
a
b
UNICAMP—State University of Campinas, School of Chemical Engineering, Av. Albert Einstein, 500–CP, 13083-852 Campinas, SP, Brazil
UNIFESP—Federal University of São Paulo, Department of Exact and Earth Science, Rua São Nicolau, 210 Diadema, SP, Brazil
a r t i c l e
i n f o
Article history:
Received 27 January 2015
Received in revised form 18 May 2015
Accepted 14 June 2015
Available online 30 June 2015
Keywords:
Chitosan
Pectin
Polyelectrolyte complex
pH indicator
Anthocyanin
a b s t r a c t
A polyelectrolyte complex (PEC) matrix formed between chitosan and pectin was developed to entrap a
bioactive compound (anthocyanin), obtaining an useful pH indicator device. Polysaccharides of opposite
charges such as chitosan and pectin can have a very strong intermolecular interaction. The innovation
lies in obtaining a new system based on natural and biodegradable compounds, which is simple to manufacture, to indicate variation in pH by visual changes in colour. This device has potential applications
in food packaging. The PEC was studied using chitosan and pectin solutions at different pHs values (3.0,
4.0, 5.0 and 5.5) and pectin/chitosan molar ratios (1.0 to 10/1.0 to 5.0). PEC films were homogeneous
and showed the highest yield (60.0%) at pH 5.5. Diffusion tests indicated efficient bioactive compound
entrapment in the PEC matrix. Thermogravimetric analysis (TGA), scanning electron microscopy (SEM)
and Fourier transform infrared (FTIR) spectroscopy indicate the compatibility between the polymers and
bioactive compound.
© 2015 Elsevier Ltd. All rights reserved.
1. Introduction
A polyelectrolyte complex (PEC) is formed by ionic interactions between polyanions and polycations. It has unique properties,
which are significantly different from those of the initial components. Basing a PEC on natural polymers such as chitosan and pectin
can improve its mechanical properties. The electrostatic attractions between the ionised amino groups of chitosan (NH3+ ) and
the ionised carboxyl acid groups (COO ) of pectin are the main
interactions in the formation of the pectin/chitosan PEC (Rashidova
et al., 2004). Different interactions (van der Waals, electrostatic,
hydrophobic and hydrogen and coordination bonding) can occur
between the different groups in polymer–polymer complexes. In
polysaccharide structures such as chitosan and pectin the presence
of polar functional groups results in a very strong intermolecular
interaction and highly ordered orientation of the rigid-chain polymers (Rashidova et al., 2004; Ghaffari, Navaee, Oskoui, Bayati, &
Rafiee-Tehrani, 2007). The stability of these complexes depends on
pH, temperature, charge density and ionic strength among other
environmental conditions (Recillas et al., 2011).
Chitosan is a linear cationic polysaccharide obtained from
chitin, found in the shells of shrimp, lobsters and crabs. It is
∗ Corresponding author. Tel.: +55 19 33193588; fax: +55 19 40436428.
E-mail addresses: (V.B.V. Maciel),
(C.M.P. Yoshida), (T.T. Franco).
/>0144-8617/© 2015 Elsevier Ltd. All rights reserved.
characterised by its formation of flexible and resistant films with an
efficient oxygen barrier (Yoshida, Bastos, & Franco, 2010; Recillas
et al., 2011). It is composed of N-glucosamine and a small amount
of N-acetyl glucosamine and is classified according to degree of
deacetylation (Ghaffari et al., 2007). Pectin is a natural, low toxicity
and anionic polysaccharide extracted from the cell walls of most
plants, such as apples, oranges and pears. It is characterised by its
gelling property and branched heteropolysaccharides, which consist predominantly of linear chains of partially methyl-esterified
(1,4) ␣-d-galacturonic acid residues (Ninan et al., 2013). Depending on the degree of substitution of d-galacturonic carboxyl groups
by methoxyl groups ( OCH3 ), defined as the degree of esterification (DE), pectins are classified as high-esterified pectins (DE > 50%)
or low-esterified pectins (DE < 50%) (Jindal, Kumar, Rana, & Tiwary,
2013). This describes the percentage of methoxylated C6 atoms in
the galacturonic acid backbone and strongly determines the gelling
properties. Other important molecular parameters are molecular
weight and galacturonan content (GC), which indicates the purity
of the pectin (Lopes da Silva & Rao, 2006; Einhorn-Stoll, Kastner, &
Drusch, 2014).
Many studies, mainly in medical areas and on drug delivery, have addressed production and characterisation of matrices
obtained from chitosan/pectin PEC (Rashidova et al., 2004; Bigucci
et al., 2008; Naidu et al., 2009; Cunha & Gandini, 2010; Brinques &
Ayub, 2011; Coimbra et al., 2011; Recillas et al., 2011). However,
no application of PEC as a pH indicator device was found in the
literature.
538
V.B.V. Maciel et al. / Carbohydrate Polymers 132 (2015) 537–545
The growing concern of consumers over the safety of foods
has led to the investigation of alternative natural preservation
technologies (Alzoreky & Nakahara, 2003; Latou, Mexis, Badekaa,
Kontakos, & Kontominas, 2014). The pH is one of the most important factors influencing the quality, safeness and freshness of food
(Smolander, 2003). Zhang, Lub, and Chen (2014) described the
advantages of optic or visual pH sensors, such as their small and
compact size, safety, long-distance transmission, sensitivity and
low cost. One of these new technologies, the colour-based pH indicator, offers potential for the indication of microbial metabolites
(Kerry, O’Grady, & Hogan, 2006), since microbiological growth can
induce a change in pH (Smolander, 2003). The study of alternative natural packaging devices was developed by Veiga-Santos,
Ditchfield, and Tadini (2011), who produced a biodegradable film
based on cassava starch plasticised with sucrose and inverted
sugar-containing grape and spinach extracts as a pH indicator.
Yoshida, Maciel, Mendonc¸a, and Franco (2014) evaluated chitosan films containing anthocyanin as a pH indicator device.
Maciel, Yoshida, and Franco (2012) developed a prototype of a
colourimetric temperature indicator for monitoring food quality
using chitosan suspensions containing anthocyanin applied on
card paper sheets. Almeida, Estela, Segundo, and Cerdà (2011)
proposed a membrane-less gas-diffusion unit containing a pH indicator to determine ammonium in wastewater and river water.
Capel-Cuevas, Cuéllar, Orbe-Payá, Pegalajar, and Capitán-Vallvey
(2011) studied different matrices containing different synthetic
pH indicators to form an optical pH sensor array based on neural networks. Zhang et al. (2014) prepared a colourimetric pH
sensing film based on chitosan and glutaraldehyde, applied it on
pork meat and fish and observed visual changes in colour from red
to green in the pH range of 2.2–9.0. Lee and Lee (2014) developed
a pH-sensitive colourimetric hydrogel using a catechol-conjugated
alginate hydrogel and a pyrocatechol violet dye and obtained large
colour changes and chemical stability without deformation over
a wide range of pH (1.0–13.0). Bigucci et al. (2008) investigated
the influence of PEC between chitosan and pectin on the release
behaviour of vancomycin, verifying the best results in complexes
prepared with 1:9 and 3:7 (chitosan:pectin) at pH 5.0. Ghaffari et
al. (2007) studied PEC formation using pectin (high-methoxylated)
and chitosan at pH 5.4, obtaining yields in the order of 70.0% with
a ratio of 2:1 (pectin:chitosan).
The aim of this study was to develop and characterise PEC formation using chitosan and pectin in different proportions for potential
application as an efficient pH indicator device. Zeta potential analysis, FTIR, TGA, SEM and diffusion tests were carried out to study
and characterise the degree of interaction between polyions on PEC
films.
2. Materials and methods
2.1. Materials
Chitosan (Primex, molecular weight of 2.38 × 10⁵ g mol−1 and
percentage of acetylation of 9.1%, Iceland), acetic acid (Synth,
Brazil), pectin (from citrus fruits) with a high degree of methoxylation (above 50% of groups esterified) (CPKelko, GENU® 105 rapid
set, Brazil) and anthocyanin (ATH) powder obtained from grapes
(Christian Hansen, AC-12r-WSP, Brazil).
2.2. Methods
2.2.1. Determination of the degree of deacetylation of chitosan
An adaptation of the procedure of Raymond, Morin, and
Marchessault (1993) and Santos, Soares, and Dockal (2003)
was used. A quantity of 0.5 g of chitosan was solubilised in
50.0 mL 0.1 mol L−1 hydrochloric acid (v/v). The suspension was
stirred for 30 min at room temperature (25 ± 2 ◦ C). Samples
were titrated with NaOH solution (0.092 mol L−1 ). Changes in
conductance were measured using a pH meter with results
in mV. The degree of deacetylation (DDA) was calculated by
DDA = (16.1*[base]*(V2 − V1 ))/m. The degree of acetylation (DA)
was calculated by DA = 100 − DDA.
2.2.2. Determination of the degree of esterification of pectin
In accordance with Bochek, Zabivalova, and Petropavlovskii
(2001), 0.2 g of pectin was placed in a weighing bottle for titration and wetted with ethanol (95.0%). Distilled water was heated to
40 ◦ C (20.0 mL) and added. The polymer was dissolved with magnetic stirring for 2 h. The solution was titrated with 0.1 M NaOH
in the presence of phenolphthalein to a pale rose colour and the
results were recorded as initial titrated solution (Ti). The pH of the
solution was measured. Ten mL of 0.1 M NaOH solution was added
to neutralise the galacturonic acid in the sample and the mixture
was stirred at room temperature for 2 h to saponify the esterified
carboxyl groups of the polymer. Then 10.0 mL of 0.1 M HCl was
added. Excess HCl was titrated with 0.1 M NaOH. The number of
esterified carboxyl groups was calculated from the volume of 0.1 M
NaOH titration solution (Tf). The degree of esterification (DE) of the
pectin was calculated using by the following equation:
DE(%) =
Tf
Ti + Tf
∗ 100
(1)
where Ti is the volume (mL) of 0.1 M NaOH used in the initial titration and Tf is the volume (mL) of 0.1 M NaOH used in the final
titration.
2.2.3. Chitosan/pectin PEC
PECs were prepared according to adaptation of the method of
Ghaffari et al. (2007) and Bigucci et al. (2008). Chitosan (0.50 g
100 g−1 ) was dissolved in aqueous acetic acid. The stoichiometric
amount of acetic acid was calculated from sample weight, taking
into account the value of DA and the weight to achieve protonation
of all the NH2 sites (Notin et al., 2006). Pectin (0.50 g 100 g−1 ) was
solubilised in distilled water and stirred magnetically at 60 ± 2 ◦ C
for 30 min. ATH (0.25 g 100 g−1 ) was added to chitosan suspension and homogenised by magnetic stirring at room temperature
(25 ± 1 ◦ C) for 45 min. The pH of the chitosan and pectin suspensions was adjusted to 3.0, 4.0, 5.0 or 5.5 using 0.1 M HCl or 0.1 M
NaOH solutions. Therefore, chitosan suspension containing ATH
was slowly added to the pectin aqueous suspension. The suspension obtained was maintained under magnetic stirring for 10 min
(selected by previous testing using different times: 10 min, 1 h, 5 h
and 24 h). Different pectin/chitosan ratios were studied (Table 1).
The PEC formed between pectin and chitosan was separated by
ultracentrifugation (Jouan, MR 1812 model, France) at 12,000 rpm
for 30 min at 5 ± 1 ◦ C. This precipitate was placed in plastic petri
dishes and dried at 40 ◦ C during 12 h in an oven with air circulation
(Tecnal, TE-394/1 model, Brazil) to form the PEC films.
2.2.4. Determination of zeta potential of PEC suspensions
PEC suspensions were prepared at 0.10 g 100 g−1 . The suspensions were maintained under continuous magnetic stirring
for 2 min and then kept still during four hours to separate the
supernatant and complex formed. Zeta potential was measured by
dynamic light scattering (DLS) in a Zetasizer Nano-ZS (Malvern, ZEN
3600 model, Germany). All measurements were carried out at 25 ◦ C
in triplicate. Different ratios of pectin/chitosan (%, v/v) were studied in each pH value (3.0, 4.0, 5.0 and 5.5) to determine the zeta
potential of the PEC suspensions.
V.B.V. Maciel et al. / Carbohydrate Polymers 132 (2015) 537–545
539
Table 1
Zeta potential analysis of PEC solutions obtained at different pHs values.
Ratios
Zeta potential (mV)
(P:C)1
pH 3.0
Pectin
Chitosan
1.0P:1.0C
2.0P:1.0C
3.0P:1.0C
4.0P:1.0C
4.1P:1.0C
4.3P:1.0C
4.5P:1.0C
4.8P:1.0C
4.5P:1.0C
5.0P:1.0C
5.1P:1.0C
5.2P:1.0C
5.3P:1.0C
5.5P:1.0C
6.0P:1.0C
6.5P:1.0C
7.0P:1.0C
8.0P:1.0C
9.0P:1.0C
10.0P:1.0C
1.0P:2.0C
1.0P:3.0C
1.0P:4.0C
1.0P:5.0C
−7.99 ±
55.50 ±
55.10 ±
52.75 ±
45.75 ±
34.25 ±
–
–
–
–
–
26.15 ±
–
–
–
19.80 ±
14.05 ±
–
8.69 ±
−3.66 ±
−5.64 ±
−7.33 ±
57.85 ±
58.75 ±
59.70 ±
60.65 ±
1
pH 4.0
1.14
2.16
0.07
0.95
0.85
4.05
1.32
2.48
0.05
0.29
0.05
0.03
0.30
2.95
0.75
1.50
1.65
−28.23 ±
62.15 ±
68.35 ±
63.20 ±
56.50 ±
46.68 ±
–
–
–
–
–
32.83 ±
32.55 ±
31.83 ±
24.20 ±
9.93 ±
−12.51 ±
−13.60 ±
−18.53 ±
−21.20 ±
−21.42 ±
−23.78 ±
66.95 ±
65.30 ±
66.25 ±
–
pH 5.0
−32.63 ±
44.45 ±
43.00 ±
36.90 ±
32.48 ±
24.20 ±
–
–
–
–
17.57 ±
−6.06 ±
–
–
–
−15.25 ±
−20.95 ±
–
−23.90 ±
−26.00 ±
–
–
42.73 ±
42.40 ±
43.25 ±
43.70 ±
1.30
0.95
3.35
2.40
3.59
3.35
1.82
0.05
1.72
0.10
0.27
2.31
0.00
1.86
0.57
0.72
1.65
2.15
0.20
0.35
pH 5.5
−37.10 ±
37.03 ±
33.95 ±
27.10 ±
21.30 ±
12.03 ±
11.05 ±
5.50 ±
−9.04 ±
−16.50 ±
–
−18.24 ±
–
–
–
–
−23.50 ±
–
−25.50 ±
–
–
–
35.35 ±
37.00 ±
37.70 ±
37.20 ±
2.94
0.34
0.80
0.90
2.49
1.35
2.57
3.53
0.45
0.82
0.55
0.83
2.04
0.90
0.45
1.20
1.32
2.21
0.15
0.90
0.58
0.43
0.05
0.06
0.15
0.70
0.94
0.53
0.10
1.25
0.70
0.70
0.50
“P” and “C” are pectin and chitosan, respectively.
2.2.5. Yield of PEC films formed
The yield of PEC films was calculated from the masses of chitosan, pectin and ATH used initially in suspension preparation and
the mass of the PEC films formed (Eq. (2)):
Yield(%) =
Mcomplex
(Mc + Mp + MAth )
∗ 100
(2)
where Mcomplex is the complex mass obtained after drying at 40 ◦ C
during 12 h and Mc , Mp and MAth are the respective initial masses
of chitosan, pectin and ATH used for PEC film formation.
2.2.6. Fourier transform infrared (FTIR) spectroscopy
FTIR analysis was performed in the range of 4000–650 cm−1
using a FTIR spectrometer (Thermo Scientific, Nicolet 6700 spectrometer, USA) operating in ATR mode (for the PEC films) and
potassium bromide (KBr, FTIR grade, Sigma-Aldrich, Germany)
discs for the powder samples (pectin, chitosan and ATH) coupled
to a computer with Omnic analysis software. Data collection was
performed with a 4 cm−1 spectral resolution and 64 scans.
2.2.7. Scanning electron microscopy (SEM) of the PEC films
The SEM analysis of the PEC films was performed on fractured cross sections and the surface of a gold-sputtered CH-Sys
using a LEO 440i scanning electron microscope (LEO Electron
Microscopy Ltd., England) under the following conditions: accelerating voltage = 15 kV, distance = 25 mm, current = 200 pA, and
vacuum = 10−5 Torr (1.3 × 10⁻³ Pa) (Reis, Yoshida, Reis, & Franco,
2011).
2.2.8. Diffusion test of bioactive compound from PEC films at
different pHs values
PEC films were preconditioned at 50.0 ± 0.2 ◦ C during 24 h
before analysis and cut into 2.0 cm squares and their thickness was
measured at five different places using a digital MDC-25 M model
micrometer (Mitutoyo, Japan). The PEC films were immersed in
200 mL of phosphate-citric acid buffer solutions with different pHs
values (4.0, 5.5 and 7.0) and kept under constant stirring at 90 rpm
(TE-420 model, Tecnal, Brazil). The aliquots (2 mL) were removed
at predetermined times during 480 min and the ATH concentration
released in the buffer solution was measured using a UV/VIS spectrophotometer (Thermo Fisher Scientific, Genisys 6 model, USA).
The specific wavelength ( max ) for each pH of the buffer solution was determined by scanning in the range 190–780 nm with
a 1 nm resolution, using a UV/VIS spectrophotometer (Varian, Gary
1G model, USA). This was necessary because the ATH structure
produces changes in colour at different pH values (Brouillard &
Dubois, 1977; Iacobucci & Sweeny, 1983). At pH = 4.0, the max was
530 nm; pH = 5.5, the max was 535 nm and pH = 7.0, the max was
575 nm.
A standard curve was determined for each buffer solution to
calculate the concentration of ATH. The amount of the compound
released at time Mt and the fraction of the final value (Mt /M∞ ) were
calculated and plotted as a function of immersion time (t). Tests
were carried out in triplicate.
2.2.8.1. Mathematical diffusion analysis. The diffusion test was
based on a study developed by Yoshida et al. (2010) using the same
boundary conditions. To model the bioactive compound (ATH) diffusion mechanism, it was assumed that the process occurred in
a thin sheet of film with an initially homogeneous bioactive concentration distribution. Solvent absorption and solute diffusion
occurred simultaneously. Film thickness was much smaller than
film width, so the diffusivity was considered to be unidirectional
and perpendicular to the surface of the sheet. The bioactive compound concentration inside the film was a function of x, the distance
from the surface. The ratio of the total amount of ATH released after
time t (Mt ) to the amount released at equilibrium (M∞ ) (Crank,
1975) was calculated as follows:
Mt
8
=1− 2
M∞
∞
m=0
1
−2(m + 1)2
exp
2m + 1
L2
2D
t
(3)
540
V.B.V. Maciel et al. / Carbohydrate Polymers 132 (2015) 537–545
where Mt is the amount of compound release at time t; M∞ is the
amount of compound release at infinite time; L is the film thickness
(mm); t is the time (s).
A computational program was developed using MatLab® 7.5
software for the mathematical modelling of ATH release results as
a function of time. The program provided the diffusion coefficient
(D ). A reliability test of the method was conducted using the sum
of squares of the deviations of the experimental points from the
modelling predictions.
2.2.9. Colourimetric characterisation of PEC films
The colour parameters of the PEC films were measured before
and after exposure to buffer solutions at different pHs (4.0, 5.5 and
7.0). A CR 400 Chroma Meter (Konica Minolta, Japan) was used. The
colourimeter was calibrated with a white plate, observation angle
of 2◦ and illuminant D65. Measurements were performed using the
CIE L* a* b* system. The parameter L* represents the lightness of
colours from 0 (dark) to 100 (light) and a*, the greenness/redness
(negative a* is green and positive a* is red) and b*, the grade of
blueness/yellowness (negative b* is blue and positive b* is yellow);
both a* and b* move along the two axes that form a plane orthogonal
to L* and neither has specific numerical limits. Three replicates were
conducted per experiment.
2.2.10. Thermogravimetric analysis (TGA)
The thermogravimetric analysis of pectin, chitosan, ATH, chitosan/pectin PEC films and chitosan/pectin/ATH PEC films was
performed using a thermogravimetric analyser (TGA-50, Shimadzu,
Japan). The experiments were run at a heating rate of 10 ◦ C min−1
in the range of 30–400 ◦ C with a nitrogen gas flow of 50 mL min−1 .
2.3. Statistical analysis
Statistical analysis was carried out with the Statistic version 7.0
program (Statistic Inc., USA) and differences between the means
were detected by the Tukey multiple comparison test.
3. Results and discussion
The estimated values for DA of chitosan and DE of pectin
were 9.1% and 72.0%, respectively. The pectin is classified as highesterified. The DA of chitosan and DE of pectin are important factors
in obtaining a PEC. These characteristics are related to the available
free charges of each polysaccharide, directly influencing its complexation (Ghaffari et al., 2007; Coimbra et al., 2011; Tsai et al.,
2014).
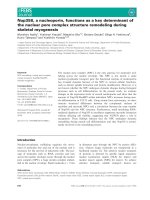
Fig. 1. PEC film obtained from chitosan and pectin suspensions containing a colourimetric bioactive compound (ATH).
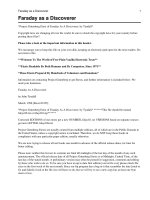
3.2. Zeta potential analysis
It was expected that pectin would interact with chitosan to form
PECs through opposite charge interactions. The charge densities of
pectin and chitosan solutions at the different pH values are shown
in Fig. 2.
For all pHs values studied, the chitosan and pectin solutions had
positive and negative charges, respectively. Increasing the pH from
3.0 to 5.5, the zeta potential of chitosan decreased from +55.5 mV to
+37.0 mV. This was associated with a pH value quite similar to the
pKa of chitosan (6.2–7.0) (Vaarum & Smidsrod, 2005). In this case,
at pH below pKa the amino groups of chitosan are deprotonated,
which makes the chitosan molecule cationic. The zeta potential was
more negative for pectin, increasing the pH from 3.0 to 5.5. Anionic
polysaccharides such as pectin have a low range of pKa (3.5–4.5)
(Rolin, 2002), which is determined by galactoronic acid, a weak acid
found in the pectin structure. At low pH values, the anionic characteristic of pectin is reduced due to dissociation of the carboxylic
groups of the pectin structure (Giancone, Torrieri, Masi, & Michon,
2009).
Pectin
Chitosan
60
3.1. Polyelectrolyte complex (PEC)
Zeta potential (mV)
PEC films were characterised as rugous, homogeneous and without bubbles or defects. The violet colour was due to the ATH
entrapped in the PEC matrix (Fig. 1).
For water-soluble PECs, stoichiometrically charged PECs usually precipitate and form turbid PEC solutions. In our study,
when mixing chitosan and pectin solutions with the same ionic
strength, a non-homogeneous solution with precipitate formation
was observed. These results are in accordance with other studies,
indicating that soluble PECs often occur due to strong ionic interactions between the polycationic chitosan and polyanionic pectin
(Bigucci et al., 2008; Coimbra et al., 2011). According to Tsai et
al. (2014), PECs are usually water-soluble and form homogeneous
solutions when the densities of positive charges on the polycations
and negative charges on the polyanions are not equitable.
40
20
0
-20
-40
3
4
5
6
pH
Fig. 2. Zeta potential of pectin 0.01% (w/w) and chitosan 0.01% (w/w) solutions at
pH 3.0, 4.0, 5.0 and 5.5.
V.B.V. Maciel et al. / Carbohydrate Polymers 132 (2015) 537–545
Table 2
Yield of PEC formed between pectin and chitosan at different pHs.
pH
Pectin:chitosan weight ratio (w/w)
Yield (%)
3.0
4.0
5.0
5.5
8.0P:1.0C
5.5P:1.0C
5.0P:1.0C
4.3P:1.0C
48.2
52.5
56.6
60.2
±
±
±
±
0.80a
1.10b
1.12c
0.89d
a,b,c,d
Means on the same line with different superscript letters differ significantly (p
≤ 0.05) in accordance with Tukey’s test.
An increase in pH from 3.0 to 5.5, improved the yield of PEC
formed in the order of 25%. The lowest yield (%) was obtained using
a high concentration of pectin and pH 3.0. This was associated with
the anionic character of pectin that is reduced at low pHs due to
the dissociation of the carboxylic groups of galacturonic acid. The
maximum yield (60.2%) was observed at a ratio of 4.3P:1.0C at pH
5.5. It is possible that more than one half of the ionic groups of both
polymers were ionised at this pH. Based on these results, 4.3P:1.0C
at pH 5.5 was defined as the best formulation for continuing the
study using ATH entrapped in PEC films.
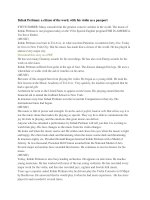
3.3. Fourier transform infrared (FTIR) spectroscopy
Samples of chitosan, pectin, ATH and PEC films with and without
ATH (4.3P:1.0C) were analysed by FTIR spectroscopy (Fig. 3). It was
possible to verify the chitosan-pectin interaction.
The spectral region between 3500 cm−1 and 2800 cm−1 for chitosan (Fig. 3a) and pectin (Fig. 3b) had absorption bands typical
of polysaccharides (Stuart, 2004). In the FTIR spectrum of pectin
it is possible to observe two bands between 1800 and 1500 cm−1
that are associated with the stretching vibrations of the carbonyl
group. The band at 1745 cm−1 corresponds to the methyl ester
group (COOCH3 ) and the undissociated carboxyl acid (COOH), while
the band at 1631 cm−1 is assigned to the asymmetric stretching
vibration of the carbonyl group of the carboxylate ion (COO )
(Coimbra et al., 2011). In the spectrum of chitosan, the band situated at 1643 cm−1 is assigned to the C O stretching vibration of
the amide group (amide I) of the acetylated units of chitosan. The
band at 1600 cm– 1 is the result of the overlapping of the amide
II of the amide groups and the N H bending vibration (amide II).
The spectrums of the PEC films with and without ATH indicate the
main changes in the range of 1800–1600 cm−1 , providing evidence
of the interaction of the amino and carboxyl groups (Fig. 3c and
d). In both spectra a peak can be observed at 1742 cm−1 and can
be attributed to the vibration of the carbonyl group of pectin. A
broad peak at 1600–1500 cm−1 in the spectrum of the PEC films
108
a)
98
1745
d)
94
1742
96
e)
1631
c)
1742
100
1592
1548
b)
102
1605
1558
104
1643
1600
106
% Transmitance
92
1618
The interaction between the polymers was evaluated by the PEC
charge formed at different pHs values (Table 1). A higher yield of
PEC films was obtained when the resultant charge of the solution
was near zero, indicated by the charge inversion of the PEC solution.
Under this condition, it is possible that there was more interactions
between the polymeric charges. At pH 3.0, the best pectin/chitosan
ratio was between 7.0P:1.0C and 8.0P:1.0C, and at pH 4.0, 5.0 and
5.5 it was between 5.5P:1.0C and 6.0P:1.0C, 4.5P:1.0C and 5.0P:1.0C
and 4.3P:1.0C and 4.5P:1.0C, respectively. When pH was increased
from 3.0 to 5.5, smaller amounts of pectin were required to form the
higher yields of PEC films. The formation of PECs between a weak
polybase (chitosan) and a weak polyacid (pectin) occurs extensively in the pH range between the pKa’s of the two polymers,
where more than one half of the ionic groups of both polymers are
ionised. For the pectin and chitosan complex system, this pH value
was between 3.5 and 4.5 (pKa range of pectin, Rolin, 2002) and 6.2
and7.0 (pKa range of chitosan, Vaarum & Smidsrod, 2005), respectively. A higher homogeneity of PEC films was observed at pH 5.0
and 5.5. Besides pH, the other important factors that affected PEC
formation and properties were the proportion and loadings of the
two polymers, temperature and ionic strengths. Macleod, Collett,
and Fell (1999), Ghaffari et al. (2007), Coimbra et al. (2011) and
Recillas et al. (2011) studied the formation of PEC between chitosan
and pectin and obtained the best results at a pH range between 3.0
and 6.0 at room temperature.
The resultant charge of the system formed between chitosan
and pectin was dependent on pH. Maintaining the proportion of
chitosan constant and varying the concentration of pectin, systems
with a positive zeta potential were observed in all formulations
and at all pHs up to the ratio of 4.3P:1.0C. Varying the proportion
of chitosan and maintaining the pectin concentration constant, the
charge of the systems was always positive. These results suggest
that the amount of pectin added was not sufficient to neutralise all
of the chitosan amino groups. The opposite behaviour was observed
for the amount of chitosan, which was not high enough to associate
with the charges of the pectin, resulting in systems with a negative
characteristic due to the excess of pectin concentration.
Ghaffari et al. (2007) studied PEC formation with chitosan and
pectin at different pHs and observed that under an extremely acid
condition (pH = 1.5), an insufficient ionisation of pectin was promoted to form the PEC at any pectin:chitosan ratio. Increasing
pH (3.8 and 5.4), the optimal pectin:chitosan ratios were 3:1 for
pH 3.8 and 2:1 and 3:1 for pH 5.4. Similar results for the ionisation limit of pectin at a very acid pH (pH = 2.0) were obtained by
Bigucci et al. (2008), where the maximum complex formation was
obtained at pH 5.0 using chitosan:pectin ratios from 1:1 to 3:7.
For pH 3.0 and 4.0, the best ratios were 1:9 and 3:7, respectively.
Rashidova et al. (2004) studied the PEC formed between chitosan
(DA of 40%) and pectin (DE of 61–68%) at different molar ratios.
They obtained pectin-chitosan interaction in a 2.0% acetic acid solution and observed that structural toughness depended on mixture
composition. Naidu et al. (2009) studied the PEC formed between
gum kondagogu and chitosan at different ratios, obtaining good
results (yield, membrane swelling and drug release) at ratios of 4:1
and 5:1 (gum kondagogu:chitosan). They observed that the gradual increase in the quantity of gum kondagogu used to form the
complex reduced the zeta potential of the suspension to negatives
values, indicating the complete neutralisation of chitosan. Abruzzo
et al. (2013) studied complexes formed between chitosan and alginate at pH 5.0 for vaginal delivery of chlorhexidine digluconate.
They found the best results of polymeric interaction using a ratio
of 1:1.
Based on the zeta potential results, the best formulation of PEC
film ratio for each pH was defined (Table 2). The yield of PEC films
was calculated based on the complex mass obtained after the drying
process and the initial mass of the pectin and chitosan used.
541
90
3500
3000
2500
2000
1500
1000
Wavenumbers (cm–1)
Fig. 3. FTIR spectra of (a) chitosan; (b) pectin; (c) chitosan/pectin PEC (4.3P:1.0C
without ATH); (d) chitosan/pectin/ATH PEC (4.3P:1.0C with ATH) and (e) ATH.
542
V.B.V. Maciel et al. / Carbohydrate Polymers 132 (2015) 537–545
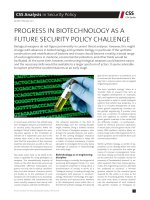
Fig. 4. Micrographs of the PEC films: (a) surface area of chitosan/pectin/ATH (4.3P:1.0C with ATH), (b) cross section of 4.3P:1.0C with ATH, (c) surface area of chitosan/pectin
(4.3P:1.0C without ATH) and (d) cross section of 4.3P:1.0C without ATH.
indicates a change in environment of the amine group through its
interaction with pectin. In fact, the asymmetric stretching vibration of the carbonyl group of the carboxylate (COO ) groups in
pectin (∼1631 cm−1 ) and the amide I (∼1643 cm−1 ) and amide
II (∼1600 cm−1 ) vibrations of the amide groups of chitosan indicate the formation of interchain or intermolecular ionic salt bonds,
i.e. PEC between amino groups of chitosan and carboxyl groups
of pectin (Rashidova et al., 2004; Stuart, 2004; Chen et al., 2010;
Brinques & Ayub, 2011).
In Fig. 3e, ATH shows a strong characteristic band at 1650 and
1450 cm−1 assigned to the stretching vibration of the C C aromatic ring. The absorption band around 1230 cm−1 is assigned to
stretching of pyran rings, typical of flavonoid compounds (Pereira,
Arruda, & Stefani, 2015). The PEC films containing ATH have the
same IR spectra, indicating no significant interactions between
pectin/chitosan and ATH. In this case, the ATH could be merely
entrapped in the PEC matrix.
3.4. Scanning electron microscopy (SEM)
The morphology of the PEC films was analysed by SEM to
observe the films’ surface morphology and cross section as well as
the homogeneity of the composite, presence of voids and the films’
homogeneous structure. Fig. 4 contains the SEM micrographs of
the PEC films using 4.3P:1.0C with (Fig. 4a and b) and without ATH
(Fig. 4c and d) at pH 5.5.
A relatively flat and smooth PEC film surface can be observed
(Fig. 4a and c), which indicates that the mixture between chitosan
and pectin as well as chitosan, pectin and ATH was homogenous in
these films. This is further supported by the compact cross-section
morphologies of both PEC films (Fig. 4b and d), which could indicate
a strong interaction between the polysaccharides with and without
ATH. Meanwhile, our results agree with those from other research
on biopolymers films, where a homogeneous and smooth surface is
usually preferred (Khan et al., 2012; Wang et al., 2013; Sun, Wang,
Kadouha, & Zhou, 2014).
3.5. Thermogravimetric analysis (TGA)
The thermogravimetric analysis (TGA) curves for chitosan,
pectin, ATH and PEC films (4.3P:1.0C) with and without ATH were
determined. The water distribution within the systems and the
temperature limits for PEC film applications were evaluated (Fig. 5).
Typical TGA curves for weight loss as a function of temperature can be observed for chitosan and pectin. Chitosan and pectin
were degraded at around 325 ◦ C and 240 ◦ C, respectively. In the
thermogram of pure pectin, two stages were observed. The first
thermal event was a weight loss in the range of 50–100 ◦ C, which
was related to evaporation of the water in the sample and the
equilibrium film. Evaporation occurs at the liquid/air interface, and
the water is readily available at the surface (Mandanas & Messing,
2000). The second thermal event started from 200 to 240 ◦ C and was
related to depolymerisation of the pectin chains. For the pure chitosan the first thermal event, related to the evaporation of unbound
water, was also seen below 100 ◦ C. The second thermal event for
chitosan was observed at about 230 ◦ C with the maximum rate at
375 ◦ C and a 43.7% reduction in weight. The degradation of the
PEC films both with and without ATH was similar, which could
V.B.V. Maciel et al. / Carbohydrate Polymers 132 (2015) 537–545
100
90
80
Weight (g/100 g)
70
60
50
40
30
20
0
50
100 150 200 250 300 350 400 450 500 550 600
Temperature (°C)
Fig. 5. Thermogravimetric analysis: chitosan ( ), pectin (------), ATH (-----), chitosan/pectin PEC (4.3P:1.0C without ATH) (– – –) and chitosan/pectin/ATH PEC
(4.3P:1.0C with ATH) (–·–··).
indicate that the addition of ATH to the PEC did not affect the
interaction between the polymers. In these thermograms an event
observed at 250 ◦ C could be due to chitosan and pectin complexation (Ghaffari et al., 2007). Structural decomposition of the PEC films
started above this temperature. The structural disruption facilitated
the movement of water molecules. The thermal degradation of the
complex at temperatures lower than those in the thermograms
of the pure polymers suggests that the formation of ionic bonds
between chitosan and pectin can probably be correlated with a loss
of organisation (Bigucci et al., 2008).
3.6. Diffusion test of bioactive compound from PEC films at
different pHs values
A diffusion test of the PEC films containing bioactive compound
(ATH) was carried out at different pHs (4.0, 5.5 and 7.0) during
8 h at room temperature (25 ± 0.5 ◦ C). Adjustment of the curves
was based on that proposed by Crank (1975). The proposal of this
analysis was to evaluate whether the matrix formed by the pectinchitosan interaction could entrap the ATH when these films were
put into different aqueous buffer solutions. Yoshida et al. (2014)
studied chitosan films containing ATH immersed at different pHs
(2.0, 4.0, 5.6, 7.0, 8.0 and 13.0) and concluded that despite the excessive change in colour in their films, the ATH migrated from the
chitosan films to the aqueous solution almost instantly.
1
Mt/M∞
0.8
0.6
0.4
0.2
0
0
25
50
75
100
125
150
175
200
225
Time (min)
Fig. 6. Release of bioactive compound ATH from PEC films (4.3P:1.0C with ATH)
immersed in different aqueous buffer solutions: pH 4.0 (x); pH 5.5 (᭹) and pH 7.0
( ).
543
The fractional mass released at pH 4.0, 5.5 and 7.0, defined as
Mt /M∞ (Mt is the mass of ATH released into the buffer solution at
time t and M∞ is the mass released at infinite time), was plotted
against the immersed time (Fig. 6). The average thickness of PEC
films was 0.200 ± 0.030 mm.
The release of ATH from the PEC films was gradual and followed
Fick’s law, tending asymptotically to 1 for all pHs values. A satisfactory correlation was obtained between the experimental data and
the proposed model. The maximum quantity of ATH released from
PEC films (M∞ ) was reached after approximately 4 h, 2 h and 2 h for
pH 4.0, 5.5 and 7.0, respectively.
The highest quantity of ATH that migrated from the PEC films to
the aqueous buffer solutions was calculated as follows: at pH 4.0,
1.13% of the ATH present in the PEC films migrated to the solution
and at pH 5.5 and 7.0 it was 1.51% and 0.77%, respectively. The
release of ATH content from the PEC films was lower than 2.0%,
which could indicate that the ionic interactions between chitosan
and pectin were able to keep the hydrophilic pigment entrapped
on the polymeric matrix.
The diffusion coefficients of the bioactive ATH were in the order
of 10−11 m2 s−1 for pH 4.0 (D pH4.0 = 8.40 ± 0.45 × 10⁻¹¹ m2 s−1 ) and
7.0 (D pH7.0 = 0.26 ± 0.04 × 10⁻¹¹ m2 s−1 ) and 10−9 m2 s−1 for pH 5.5
(D pH5.0 = 1.20 ± 0.31 × 10⁻⁹ m2 s−1 ).
The lowest diffusion coefficient of ATH in the PEC films was
observed at pH 5.5. At this pH the hydrophilicity of the PEC
films was low and did not allow absorption. Similar results were
observed by Isiklan, Inal, and Yigitoglu (2008) and Pal, Paulson,
and Rousseau (2009) for bioactive compound dissolved or dispersed in a polymer network, indicating that the decrease in
release rate over time was due to the increased distance of diffusion, which is characteristic of these systems. The solubility of the
compounds and their diffusivity in the polymer phase and polymercompound interactions play an important role in the release
process.
According to Korsmever and Peppas (1983) and Satish, Satish,
and Shivakumar (2006), in certain solvent-penetrating systems,
release depends on polymer relaxation, i.e. the stress required to
maintain the strain on the polymer decreases as a result of aqueous
solution absorption. Immersion of PEC films in an aqueous solution
can cause the matrix to relax, thus reducing resistance to compound diffusion. Important parameters associated with the process
of release through the polymeric matrix include bioactive compound hydrophilicity and network cross-linking density (Higuchi,
1963).
Yoshida et al. (2010) studied potassium sorbate diffusion in chitosan films and observed that the diffusion coefficient increased
at higher concentrations of the bioactive. It was observed that
high solubility of the potassium sorbate facilitated absorption of
solvent in contact with the aqueous medium. Rivero, Giannuzzi,
García, and Pinotti (2013) evaluated the controlled delivery of propionic acid from chitosan films in phosphate buffer at 4 ◦ C and
suggested that the process was driven by diffusion at the initial
phase release (burst stage) and a slower second release, in which
polymer swelling became the main mechanism of agent delivery. Tsai et al. (2014) evaluated chitosan/pectin/gum arabic PEC
solutions and various membrane compositions and observed that
using low concentration of pectin and gum arabic in PEC films
(84/8/8–chitosan/pectin/gum arabic) improved their mechanical
properties. A small quantity of polyanionic polymers (pectin and
gum arabic) can form network-like PECs that may enhance the
tensile strength of the PEC membranes. Larger quantities of pectin
and gum arabic (70/15/15–chitosan/pectin/gum arabic) can negatively affect the mechanical properties of the PEC due to the low
viscosity of the gum arabic, which interacts weakly with other
components and forms globe-like microstructures with chitosan,
thereby decreasing the tensile strength of the PEC membranes.
544
V.B.V. Maciel et al. / Carbohydrate Polymers 132 (2015) 537–545
Fig. 7. Visual change in colour of the PEC films containing ATH (4.3P:1.0C with ATH) when exposed to different pHs: (a) control (without immersion in buffer solution); (b)
pH 4.0; (c) pH 5.5 and (d) pH 7.0. (For interpretation of the references to color in this figure legend, the reader is referred to the web version of this article.)
Table 3
Colour parameters of the PEC films containing ATH (4.3P:1.0C with ATH) before and after the diffusion test at different pHs (4.0, 5.5 and 7.0).
pH
4.0
5.5
7.0
a,b
Control
After diffusion test
L*
a*
b*
L*
a*
b*
29.11 ± 0.75a
30.25 ± 0.85a
30.95 ± 1.04a
4.43 ± 0.55a
4.85 ± 0.98a
4.46 ± 0.80a
−1.47 ± 0.37a
−1.66 ± 0.32a
−1.94 ± 0.37a
30.97 ± 1.51a
30.86 ± 1.43a
27.67 ± 0.91b
20.18 ± 1.21b
14.34 ± 0.43b
0.54 ± 0.11b
3.62 ± 0.51b
2.17 ± 0.44b
−2.43 ± 0.34a
Means on the same line and parameters with different superscript letters differ significantly (p ≤ 0.05) in accordance with Tukey’s test.
Furthermore, they observed that the membranes prepared using
just chitosan and pectin had a stronger interaction between the
polymers.
Associating these results with our results and in accordance with
Ghaffari et al. (2007), who claim that at pH 5.4 a strong interaction
between chitosan and pectin occurs, we can affirm that the PEC
films obtained in our studies at pH 5.5 had the lowest diffusion
coefficient due to ionic interactions that occurred to the greatest
degree in this region between the pKas of the polymers.
The visual change in colour was observed in all PEC films after
immersion at different pHs (4.0, 5.5 and 7.0) (Fig. 7). At pH 4.0
violet colour was observed and at pH 5.5 the PEC films were purple. Bluish-green colour was seen at pH 7.0, indicating significant
differences in this parameter according to pH.
Kennedy and Waterhouse (2000) affirmed that these colour
variations are associated with the different chemical structures of
ATH molecules, which depend on the pH of the solution. Under acid
conditions (pH 1.0–3.0), ATH occurs predominantly in the form of
the flavylium cation (red colour), contributing to the purple and
red colours. In the range of pH 2.0–4.0, the quinoidal blue species
are predominant. The increase in pH to 5.0 and 6.0 results in a
decrease in colour intensity and the concentration of the flavylium
cation, which undergoes hydration to produce a colourless carbinol
pseudobase and chalcone, respectively. The equilibrium is shifted
towards a purple quinoidal anhydrobase at pH <7.0 and a deep blue
ionized anhydrobase at pH <8.0. Re-acidification at any time during this process to a pH below 2.0 will fully restore the original
˜
colour of the ATH (Brouillard, 1982; Castaneda-Ovando,
PachecoHernandez, Paez-Hernandez, Rodriguez, & Galan-Vidal, 2009).
Relating these results to the diffusion test, it can be observed
that the proposed system can be used to show changes at different pHs, using a visual parameter to obtain this information. In
our work, a device (PEC films) was developed by complexation
between chitosan and pectin containing ATH. This new system was
able to entrap the ATH in the matrix after immersion at pH 4.0, 5.5
and 7.0, indicating a visual change in colour. The buffer solutions
used in these experiments remained limpid and transparent in all
cases, confirming that the matrix entrapped the ATH molecules in
its structure.
The visual change in colour could be related to the colour parameters L*, a* and b* (Table 3).
Parameters a* and b* showed more significant variation after the
diffusion test for all pHs studied. At pH 4.0, parameter a* increased
from 4.43 to 20.18, tending towards violet, while at pH 5.5, it
increased from 4.85 to 14.34, showing a tendency towards purple. At both of these pHs, a greater change in colour was observed
than for the unexposed PEC films (4.3P:1.0C with ATH) at different
pHs. In PEC films in solution at pH 7.0, a significant difference (p
≤ 0.05) in parameters L* and a* was observed, showing a tendency
towards bluish-green. According to Maciel et al. (2012), the exposure of ATH to different pHs and a high temperature could alter
its structure, thereby producing a change in colour. Yoshida et al.
(2014) found similar results on colour change in chitosan films containing ATH at different pHs (from 2.0 to 13). They concluded that
ATH has a potential application as a natural pH indicator. Kohno
et al. (2009) evaluated the stability of ATH at pH 11 and determined that slightly basic conditions changed the ATH structure,
accompanied by a marked change in colour.
4. Conclusions
PEC films formed between pectin and chitosan were prepared
by the casting/solvent evaporation method. The formation of PEC
between pectin and chitosan at pH values in the vicinity of the pKa
interval of the two polymers was observed and the PEC was able
to entrap ATH on the films. The optimal weight ratio of pectin to
chitosan for PEC formation was 4.3P:1.0C at pH 5.5, which produced the highest product yield. The strong interaction between
the polysaccharides of opposite charges entrapped the hydrophilic
bioactive compound ATH in the PEC matrix, preventing its release
into the immersion solution. The proposed system is advantageous
due to its simple manufacture and visual change in colour, offering
an alternative for indicating pH variations in food products. Indicators associated with intelligent packaging show great potential for
assuring the safety and quality of food products.
Acknowledgements
This study was developed with the support of CNPq, FAPESP and
CAPES.
V.B.V. Maciel et al. / Carbohydrate Polymers 132 (2015) 537–545
References
Abruzzo, A., Bigucci, F., Cerchiara, T., Saladini, B., Gallucci, M. C., Cruciani, F., et al.
(2013). Chitosan/alginate complexes for vaginal delivery of chlorhexidine digluconate. Carbohydrate Polymers, 91, 651–658.
Almeida, M. I. G. S., Estela, J. M., Segundo, M. A., & Cerdà, V. (2011). A membraneless gas-diffusion unit—Multisyringe flow injection spectrophotometric method
for ammonium determination in untreated environmental samples. Talanta, 84,
1244–1252.
Alzoreky, N. S., & Nakahara, K. (2003). Antimicrobial activity of extracts from some
edible plants commonly consumed in Asia. International Journal of Food Microbiology, 80, 223–230.
Bigucci, F., Luppi, B., Cerchiara, T., Sorrenti, M., Bettinetti, G., Rodriguez, L., et al.
(2008). Chitosan/pectin polyelectrolyte complexes: Selection of suitable preparative conditions for colon-specific delivery of vancomycin. European Journal of
Pharmaceutical Science, 35, 435–441.
Bochek, A. M., Zabivalova, N. M., & Petropavlovskii, G. A. (2001). Determination
of the esterification degree of polygalacturonic acid. Russian Journal of Applied
Chemistry, 74, 796–799.
Brinques, G. B., & Ayub, M. A. Z. (2011). Effect of microencapsulation on survival of
Lactobacillus plantarum in simulated gastrointestinal conditions, refrigeration,
and yogurt. Journal of Food Engineering, 103, 123–128.
Brouillard, R. (1982). Anthocyanins as food colours. New York, NY: Academic Press
Inc (Chapter 1).
Brouillard, R., & Dubois, J. E. (1977). Mechanism of the structural transformations
of anthocyanins in aqueous media. Journal of America Chemistry Society, 99,
1359–1363.
Capel-Cuevas, S., Cuéllar, M. P., Orbe-Payá, I., Pegalajar, M. C., & Capitán-Vallvey, L.
F. (2011). Full-range optical pH sensor array based on neural networks. Microchemical Journal, 97, 225–233.
˜
Castaneda-Ovando,
A., Pacheco-Hernandez, M. L., Paez-Hernandez, M. E., Rodriguez,
J. A., & Galan-Vidal, C. A. (2009). Chemical studies of anthocyanins: A review. Food
Chemistry, 113, 859–871.
Chen, P.-H., Kuo, T.-Y., Kuo, J.-Y., Tseng, Y-Po., Wang, D.-M., Lai, J.-Y., et al.
(2010). Novel chitosan–pectin composite membranes with enhanced strength,
hydrophilicity and controllable disintegration. Carbohydrate Polymers, 82,
1236–1242.
Coimbra, P., Ferreira, P., Sousa, H. C., Batista, P., Rodrigues, M. A., Correia, I.
J., et al. (2011). Preparation and chemical and biological characterization of
a pectin/chitosan polyelectrolyte complex scaffold for possible bone tissue
engineering applications. International Journal of Biological Macromolecules, 48,
112–118.
Crank, J. (1975). The mathematics of diffusion. Oxford: Oxford University Press (Chapter 1).
Cunha, A. G., & Gandini, A. (2010). Turning polysaccharides into hydrophobic materials: A critical review. Part 2. Hemicelluloses, chitin/chitosan, starch, pectin and
alginates. Cellulose, 17, 1045–1065.
Einhorn-Stoll, U., Kastner, H., & Drusch, S. (2014). Thermally induced degradation
of citrus pectins during storage—Alterations in molecular structure, colour and
thermal analysis. Food Hydrocolloids, 35, 565–575.
Ghaffari, A., Navaee, K., Oskoui, M., Bayati, K., & Rafiee-Tehrani, M. (2007). Preparation and characterization of free mixed-film of pectin/chitosan/Eudragit® RS
intended for sigmoidal drug delivery. European Journal of Pharmaceutics and
Biopharmaceutics, 67, 175–186.
Giancone, T., Torrieri, E., Masi, P., & Michon, C. (2009). Protein–polysaccharide interactions: Phase behaviour of pectin–soy flour mixture. Food Hydrocolloids, 23,
1263–1269.
Higuchi, T. (1963). Mechanisms of sustained action mediation. Theoretical analysis
of rate of release of solid drugs dispersed in solid matrices. Journal of Pharmaceutical Science, 52, 1145–1149.
Iacobucci, G. A., & Sweeny, J. G. (1983). The chemistry of anthocyanins, anthocyanidins, and related flavilium salts. Tetrahedron Letters, 39, 3005–3012.
Isiklan, N., Inal, M., & Yigitoglu, M. (2008). Synthesis and characterization of
poly(N-Vinyl-2-pyrrolidone) grafted sodium alginate hydrogel beads for the
controlled release of indomethacin. Journal of Applied Polymer Science, 110,
481–493.
Jindal, M., Kumar, V., Rana, V., & Tiwary, A. K. (2013). Aegle marmelos fruit pectin for
food and pharmaceuticals: Physico-chemical, rheological and functional performance. Carbohydrate Polymers, 93, 386–394.
Kennedy, J. A., & Waterhouse, A. L. (2000). Analysis of pigmented high-molecular
mass grape phenolics using ion-pair, normal-phase high-performance liquid
chromatography. Journal of Chromatography A, 866, 25–34.
Kerry, J. P., O’Grady, M. N., & Hogan, S. A. (2006). Past, current and potential utilization
of active and intelligent packaging systems for meat and muscle-based products:
A review. Meat Science, 74, 113–130.
Khan, A., Khan, R. A., Salmieri, S., Le Tien, C., Riedl, B., Bouchard, J., et al.
(2012). Mechanical and barrier properties of nanocrystalline cellulose reinforced chitosan based nanocomposite films. Carbohydrate Polymers, 90,
1601–1608.
Kohno, Y., Kinoshita, R., Ikoma, S., Yoda, K., Shibata, M., Matsushima, R., et al.
(2009). Stabilization of natural anthocyanin by intercalation into montmorillonite. Applied Clay Science, 42, 519–523.
Korsmever, R. W., & Peppas, N. A. (1983). Macromolecular and modeling aspects of
swelling-controlled systems. In T. J. Roseman, & S. Z. Mansdorf (Eds.), Controlled
release delivery systems (p. 77). New York, NY: Marcel Dekker Inc.
545
Latou, E., Mexis, S. F., Badekaa, A. V., Kontakos, S., & Kontominas, M. G. (2014).
Combined effect of chitosan and modified atmosphere packaging for shelf life
extension of chicken breast fillets. Food Science and Technology, 55, 263–268.
Lee, Y.-K., & Lee, S.-Y. (2014). A colorimetric alginate-catechol hydrogel suitable as
a spreadable pH indicator. Dyes and Pigments, 108, 1–6.
Lopes da Silva, J. A., & Rao, M. A. (2006). Pectins: Structure, functionality and uses.
In A. M. Stephen, G. O. Phillips, & P. A. Williams (Eds.), Food polysaccharides and
their applications (pp. 353–411). Ort: Verlag.
Maciel, V. B. V., Yoshida, C. M. P., & Franco, T. T. (2012). Development of a prototype
of a colourimetric temperature indicator for monitoring food quality. Journal of
Food Engineering, 111, 21–27.
Macleod, G. S., Collett, J. H., & Fell, J. T. (1999). The potential use of mixed films of
pectin, chitosan and HPMC for bimodal drug release. Journal of Control Release,
58, 303–310.
Mandanas, M. M., & Messing, G. L. (2000). Thermogravimetric analysis of organic
binder segregation during drying of particulate suspensions. Thermochimica
Acta, 363, 37–45.
Naidu, V. G. M., Madhusudhana, K., Sashidhar, R. B., Ramakrishna, S., Khar, R. K.,
Ahmed, F. J., et al. (2009). Polyelectrolyte complexes of gum kondagogu and
chitosan, as diclofenac carriers. Carbohydrate Polymers, 76, 464–471.
Ninan, N., Muthiah, M., Park In, K., Elain, A., Thomas, S., & Grohens, Y. (2013).
Pectin/carboxymethyl cellulose/microfibrillated cellulose composite scaffolds
for tissue engineering. Carbohydrate Polymers, 98, 877–885.
Notin, L., Viton, C., David, L., Alcouffe, P., Rochas, C., & Domard, A. (2006). Morphology
and mechanical properties of chitosan fibers obtained by gel-spinning: Influence
of the dry-jet-stretching step and ageing. Acta Biomaterialia, 2, 387–402.
Pal, K., Paulson, A. T., & Rousseau, D. (2009). Biopolymers in controlled-release delivery systems. In S. Ebnesajjad (Ed.), Handbook of biopolymers and biodegradable
plastics: Properties, processing and applications (pp. 329–363). London: PDL Handbook Series.
Pereira, V. A., Jr., Arruda, I. N. Q., & Stefani, R. (2015). Active chitosan/PVA films
with anthocyanins from Brassica oleraceae (Red Cabbage) as time-temperature
indicators for application in intelligent food packaging. Food Hydrocolloids, 43,
180–188.
Rashidova, S. S., Milusheva, R. Y., Semenova, L. N., Mukhamedjanova, M. Y.,
Voropaeva, N. L., Vasilyeva, S., et al. (2004). Characteristics of interactions in
the pectin-chitosan system. Chromatographia, 59, 779–782.
Raymond, L., Morin, F. G., & Marchessault, R. H. (1993). Degree of deacetylation
of chitosan using conductometric titration and solid-state NMR. Carbohydrate
Research, 246, 331–336.
Recillas, M., Silva, L. L., Peniche, P., Goycoolea, F. M., Rinaudo, M., Románe, J. S.,
et al. (2011). Thermo- and pH-responsive polyelectrolyte complex membranes
from chitosan-g-N-isopropylacrylamide and pectin. Carbohydrate Polymers, 86,
1336–1343.
Reis, A. B., Yoshida, C. M. P., Reis, A. P. C., & Franco, T. T. (2011). Emulsion chitosan
application as coating on Kraft paper. Polymer International, 60, 963–969.
Rivero, S., Giannuzzi, L., García, M. A., & Pinotti, A. (2013). Controlled delivery of
propionic acid from chitosan films for pastry dough conservation. Journal of Food
Engineering, 116, 524–531.
Rolin, C. (2002). Pectins and their manipulation. In C. Seymour, & P. Knox (Eds.),
Commercial pectins preparation (pp. 222–241). London: Blackwell.
Santos, J. E., Soares, J. P., & Dockal, E. R. (2003). Caracterizac¸ão de quitosanas comerciais de diferentes origens. Polímeros: Ciência e Tecnologia, 13, 242–249.
Satish, C. S., Satish, K. P., & Shivakumar, H. G. (2006). Hydrogels as controlled drug
delivery systems: Synthesis, cross-linking, water and drug transport mechanism. Indian Journal Pharmaceutical Sciences, 68, 133–140.
Smolander, M. (2003). The use of freshness indicators in packaging. In R. Ahvenainen (Ed.), Novel food packaging techniques (pp. 5–21). Cambridge: Woodhead
Publishing Ltd.
Stuart, B. H. (2004). Infrared spectroscopy: Fundamentals and applications. Chichester:
John Wiley & Sons, Ltd.
Sun, X., Wang, Z., Kadouha, H., & Zhou, K. (2014). The antimicrobial, mechanical,
physical and structural properties of chitosan-gallic acid films. Food Science and
Technology, 57, 83–89.
Tsai, R.-Y., Chena, P.-W., Kuoa, T.-Y., Lina, C.-M., Wanga, D.-M., Hsienb,
T.-Y., et al. (2014). Chitosan/pectin/gum Arabic polyelectrolyte complex:
Process-dependent appearance, microstructure analysis and its application. Carbohydrate Polymers, 101, 752–759.
Vaarum, K. M., & Smidsrod, O. (2005). Structure–property relationship in chitosans.
In S. Dumitriu (Ed.), Polysaccharides: Structural diversity and functional versatility
(pp. 625–660). New York, NY: Marcel Dekker Inc.
Veiga-Santos, P., Ditchfield, C., & Tadini, C. C. (2011). Development and evaluation
of a novel pH indicator biodegradable film based on cassava starch. Journal of
Applied Polymer Science, 120, 1069–1079.
Wang, Z., Sun, X. X., Lian, Z. X., Wang, X. X., Zhou, J., & Ma, Z. S. (2013). The effects
of ultrasonic/microwave assisted treatment on the properties of soy protein
isolate/microcrystalline wheat-bran cellulose film. Journal of Food Engineering,
114, 183–191.
Yoshida, C. M. P., Bastos, C. E. N., & Franco, T. T. (2010). Modeling of potassium sorbate
diffusion through chitosan films. Food Science and Technology, 43, 584–589.
Yoshida, C. M. P., Maciel, V. B. V., Mendonc¸a, M. E. D., & Franco, T. T. (2014). Chitosan biobased and intelligent films: Monitoring pH variations. Food Science and
Technology, 55, 83–89.
Zhang, X., Lub, S., & Chen, X. (2014). A visual pH sensing film using natural dyes from
Bauhinia blakeana Dunn. Sensors and Actuators B: Chemical, 198, 268–273.