Improved fluorescent labeling of chitin oligomers: Chitinolytic properties of acidic mammalian chitinase under somatic tissue pH conditions
Bạn đang xem bản rút gọn của tài liệu. Xem và tải ngay bản đầy đủ của tài liệu tại đây (2.22 MB, 9 trang )
Carbohydrate Polymers 164 (2017) 145–153
Contents lists available at ScienceDirect
Carbohydrate Polymers
journal homepage: www.elsevier.com/locate/carbpol
Improved fluorescent labeling of chitin oligomers: Chitinolytic
properties of acidic mammalian chitinase under somatic tissue pH
conditions
Satoshi Wakita a,1 , Masahiro Kimura a,1 , Naoki Kato a , Akinori Kashimura a ,
Shunsuke Kobayashi a , Naoto Kanayama a , Misa Ohno a , Shotaro Honda a ,
Masayoshi Sakaguchi a , Yasusato Sugahara a , Peter O. Bauer b,c , Fumitaka Oyama a,∗
a
Department of Chemistry and Life Science, Kogakuin University, Hachioji, Tokyo, Japan
Department of Neuroscience, Mayo Clinic, Jacksonville, FL, USA
c
Bioinova Ltd., Prague 142 20, Czechia
b
a r t i c l e
i n f o
Article history:
Received 14 June 2016
Received in revised form 3 January 2017
Accepted 29 January 2017
Available online 31 January 2017
Keywords:
Acidic mammalian chitinase
Chitin
Chitin degradation products
Chitin oligomers
Fluorophore
Pre-acidification method
a b s t r a c t
Acidic mammalian chitinase (AMCase) has been implicated in various pathophysiological conditions
including asthma, allergic inflammation and food processing. AMCase is most active at pH 2.0, and its
activity gradually decreases to up to pH 8. Here we analyzed chitin degradation by AMCase in weak
acidic to neutral conditions by fluorophore-assisted carbohydrate electrophoresis established originally
for oligosaccharides analysis. We found that specific fragments with slower-than-expected mobility as
defined by chitin oligosaccharide markers were generated at pH 5.0 ∼ 8.0 as by-products of the reaction.
We established an improved method for chitin oligosaccharides suppressing this side reaction by preacidification of the fluorophore-labeling reaction mixture. Our improved method specifically detects
chitin oligosaccharides and warrants quantification of up to 50 nmol of the material. Using this strategy,
we found that AMCase produced dimer of N-acetyl-d-glucosamine (GlcNAc) at strong acidic to neutral
condition. Moreover, we found that AMCase generates (GlcNAc)2 as well as (GlcNAc)3 under physiological
conditions.
© 2017 The Authors. Published by Elsevier Ltd. This is an open access article under the CC BY-NC-ND
license ( />
1. Introduction
Chitin is a -1,4-linked polymer, insoluble in most solvents,
composed primarily of N-acetyl-d-glucosamine (GlcNAc) residues.
It is a major component of the exoskeletons of crustaceans and
insects, the microfilarial sheaths of parasitic nematodes and fungal
cell walls (Khoushab & Yamabhai, 2010; Koch, Stougaard, & Spaink,
2015). Thus, chitin is the second most abundant polysaccharide in
nature.
Chitinases are glycosidases that break down glycosidic bonds
in chitin. They are important enzymes responsible for chitin
metabolism in a wide range of organisms, including bacteria, fungi,
nematodes and arthropods (Bueter, Specht, & Levitz, 2013; Hamid
et al., 2013; Khoushab & Yamabhai, 2010; Koch et al., 2015; Lee
et al., 2011). Although mammals do not produce chitin, mice and
∗ Corresponding author.
E-mail address: (F. Oyama).
1
These authors contributed equally to this article.
humans express two active chitinases, chitotriosidase (Chit1) and
acidic mammalian chitinase (AMCase) (Bussink, van Eijk, Renkema,
Aerts, & Boot, 2006; Lee et al., 2011). Chit1 was the first mammalian
chitinase to be purified and its gene was cloned (Boot, Renkema,
Strijland, van Zonneveld, & Aerts, 1995; Renkema, Boot, Muijsers,
Donker-Koopman, & Aerts, 1995). AMCase was the second mammalian chitinase discovered and was named for its acidic isoelectric
point (Boot et al., 2001).
AMCase has attracted considerable attention due to its increased
expression under certain pathological conditions related to
immune response, for example in an induced asthma mouse model
and antigen-induced mouse models of allergic lung inflammation
(Reese et al., 2007; Zhu et al., 2004). Some polymorphisms and haplotypes in the AMCase gene are associated with bronchial asthma
in humans (Bierbaum et al., 2005; Okawa et al., 2016; Seibold et al.,
2009) and inhibition of its activity has been suggested as a therapeutic strategy against asthma (Sutherland et al., 2011; Yang et al.,
2009). Furthermore, AMCase has been shown to be involved in eye
(Bucolo, Musumeci, Maltese, Drago, & Musumeci, 2008; Bucolo,
/>0144-8617/© 2017 The Authors. Published by Elsevier Ltd. This is an open access article under the CC BY-NC-ND license ( />0/).
146
S. Wakita et al. / Carbohydrate Polymers 164 (2017) 145–153
Musumeci, Musumeci, & Drago, 2011; Musumeci et al., 2009) and
stomach diseases (Cozzarini et al., 2009; Nookaew et al., 2013).
We have reported that AMCase mRNA is synthesized in the
mouse stomach at exceptionally high levels. These levels are comparable to pepsinogen, the precursor of the major digestive enzyme
in gastric fluid, pepsin, suggesting a digestive role of AMCase
(Ohno et al., 2013; Ohno, Tsuda, Sakaguchi, Sugahara, & Oyama,
2012). Moreover, we recently showed that AMCase is a proteasesresistant glycosidase in mouse digestive system, further supporting
the hypothesis of AMCase functioning as a digestive enzyme (Ohno
et al., 2016). We have also shown that beside stomach, AMCase
mRNA is highly expressed in submaxillary gland and lung (Ohno
et al., 2012). In addition, recombinant AMCase and its catalytic
domain had the highest activity at around pH 2.0, when it produces primarily (GlcNAc)2 , and lower activities at more neutral pH
(pH 3.0 ∼ 7.0) (Boot et al., 2001; Kashimura et al., 2015; Kashimura
et al., 2013). The AMCase activity under somatic tissue conditions
at pH 5 ∼ 8 remains to be elucidated.
and
chitosan
oligosaccharides
(N-acetylChitin
chitooligosaccharides)
prepared
either
chemically
or
enzymatically, have been shown to have anti-cancer and antiinflammatory properties (Azuma, Osaki, Minami, & Okamoto,
2015; Masuda et al., 2014) and have various biological activities
in mammalian cells (Aam, Heggset, Norberg, Sorlie, Varum, &
Eijsink, 2010; Khoushab & Yamabhai, 2010). We hypothesized
that upregulated AMCase under certain pathological conditions
can generate specific degradation products associated with those
pathologies.
Here we analyzed the chitinase activity of AMCase by incubating the enzyme with chitin substrates at pH 2.0 ∼ 8.0 followed
by fluorophore-assisted carbohydrate electrophoresis (FACE), a
method based on labeling the reducing ends of oligosaccharides
with a fluorophore (Jackson, 1990). FACE is very sensitive (pmol
amounts) as compared to high-performance liquid chromatography (HPLC) and nuclear magnetic resonance (NMR) spectrometry,
and is often used for detection of very low oligosaccharide quantities (Boot et al., 2001; Jackson, 1990).
During our research, we found a pH-dependent generation of
an unexpected by-product with a slower mobility than (GlcNAc)2 ,
the main fragment resulting from chitin substrates digestion by
AMCase. This by-product was observed at pH 5.0 ∼ 8.0. To optimize
the digestion reaction, we established an improved method for a
specific detection of chitin oligosaccharides. Using this procedure,
we found that AMCase generates (GlcNAc)2 at broad pH range of
2.0 ∼ 8.0.
2. Materials and methods
2.1. Recombinant AMCase expressed in Escherichia coli and
enzymatic activity assays
We expressed and purified Protein A-AMCase-V5-His from
the periplasmic fraction of the E. coli as described previously
(Kashimura et al., 2015; Kashimura et al., 2013). The proteincontaining fractions were desalted using PD MidiTrap G-25 (GE
Healthcare, Milwaukee, WI, USA) equilibrated with TS buffer
[20 mM Tris-HCl (pH 7.6), 150 mM NaCl and protein inhibitor (Complete Mini; Roche Diagnostics, Basel, Switzerland)].
Chitinolytic activity was determined using a synthetic chromogenic substrate, 4-nitrophenyl N,N -diacetyl--d-chitobioside
(Sigma-Aldrich, St. Louis, MO, USA) as described previously
(Kashimura et al., 2015; Kashimura et al., 2013). AMCase unit definition was also reported previously (Kashimura et al., 2013).
2.2. Degradation of colloidal chitin and (GlcNAc)6 by E.
coli-expressed mouse AMCase
Colloidal chitin was prepared from shrimp shell chitin (SigmaAldrich), as described previously (Kashimura et al., 2013), and used
as a substrate to determine the chitinase activity of AMCase. All
enzymatic reactions using colloidal chitin (at a final concentration
of 1 mg/mL) or N-acetyl-chitohexaose (GlcNAc)6 (0.2 mol/mL)
(Seikagaku Corporation, Tokyo, Japan) were carried out in a volume of 50 L containing 0.8 mU or 0.1 mU E. coli-expressed mouse
AMCase in McIlvaine’s buffer (mixture of 0.1 M citric acid and 0.2 M
Na2 HPO4 ; pH 2.0 to pH 8.0). The reaction mixtures were incubated
for 1 h at 37 ◦ C.
2.3. Fluorophore labeling by the method of Jackson
Generated chitin fragments or chitin mono- and oligomers of
(GlcNAc)1∼6 (Seikagaku Corporation) as molecular weight markers were labeled covalently at their reducing end groups with the
fluorophore 8-aminonaphthalene-1,3,6-trisulphonic acid (ANTS,
Invitrogen, Carlsbad, CA, USA), and separated by 40% polyacrylamide gel electrophoresis (PAGE), as described by Jackson
(Jackson, 1990). Briefly, the enzymatic reaction samples were
lyophilized and 5 L of 0.2 M ANTS in acetic acid/water (3:17,
v/v) and 5 L of 1.0 M NaCNBH3 in dimethyl sulfoxide (DMSO)
were added. The mixture was incubated at 37 ◦ C for 16 h. The
reaction was neutralized by 10 L of 1 M NaOH, followed by
addition of 10 L Laemmli sample buffer (Laemmli, 1970) without SDS, 2-mercaptoethanol and bromophenol blue. The samples
were separated by PAGE and quantified using the Luminescent
Image Analyzer (ImageQuant LAS 4000, GE Healthcare), according
to the manufacturer’s instructions. Exposure condition was fixed
as follows: exposure type, precision; sensitivity, high resolution;
exposure time, 1 s.
2.4. Pre-acidification method for labeling chitin oligomers
Enzymatic reactions were lyophilized and 5 L of 0.2 M ANTS
in acetic acid/water (3:17, v/v), 5 L of 1.0 M NaCNBH3 in DMSO
and 5 L of 17.5 M acetic acid were added for reaction acidification
followed by incubation at 37 ◦ C for 16 h. The reaction was neutralized by 15 L of 1 M NaOH, followed by loading buffer addition. The
samples were analyzed by PAGE as described above.
2.5. Separation of degradation products from (GlcNAc)6 by
AMCase using HPLC
Enzymatic reactions using (GlcNAc)6 (0.6 mol/mL) were performed in a volume of 300 L containing 4.2 mU of E. coli-expressed
mouse AMCase in McIlvaine’s buffer (pH 2.0 or pH 7.0), 30 mM GlyHCl (pH 2.0) or 30 mM Tris-HCl (pH 7.0). The reaction mixtures
were incubated at 37 ◦ C for 1 h. Generated GlcNAc oligomers were
separated by gel permeation chromatography (GPC) essentially as
described previously (Kazami et al., 2015).
3. Results
3.1. Detection of pH dependent fluorophore-labeled products at
pH 5.0 ∼ 8.0
Previously, we have shown that the E. coli-produced AMCase
has the highest chitinolytic activity at around pH 2.0 which is
decreasing in less acidic environment (pH 3.0 ∼ 7.0) against the
synthetic chromogenic substrate, 4-nitrophenyl N,N -diacetyl--dchitobioside [4NP-(GlcNAc)2 ] (Kashimura et al., 2015; Kashimura
et al., 2013). To determine whether AMCase can generate distinct
S. Wakita et al. / Carbohydrate Polymers 164 (2017) 145–153
products depending on the pH condition, we incubated the enzyme
with colloidal chitin or (GlcNAc)6 substrates at pH 2.0 ∼ 8.0 in
McIlvaine’s buffer, followed by fluorophore-assisted carbohydrate
electrophoresis (FACE) as originally described by Jackson (Jackson,
1990).
AMCase degraded colloidal chitin primarily to (GlcNAc)2 fragments and to a lesser extent to (GlcNAc)3 as well as strong distinct
GlcNAc monomer under acidic conditions, which were consistent
with our previous observation (Fig. 1A) (Kashimura et al., 2013).
The hydrolysis was evident to up to pH 6.0 with decreasing activity upon increasing pH (Fig. 1A). Thus, the recombinant AMCase
can degrade high molecular weight chitin substrate at broad pH
range. However, there was an atypical product generated at pH
5.0 ∼ 8.0 that could represent a mobility shift of the (GlcNAc)2 fragment (Fig. 1A and B). AMCase also degraded a lower molecular
weight substrate, (GlcNAc)6 , and generated primarily (GlcNAc)2
and to a lesser extent (GlcNAc)3 fragments (Fig. 1B). In addition, we
detected the by-product, whose presence was evident at pH values
above 3 (Fig. 1B). These results suggest a pH-dependent generation of an atypical by-product from chitin substrates degradation
by recombinant AMCase or from FACE reaction.
3.2. By-products generation in the fluoresceination reaction and
pre-acidification procedure for detection of the GlcNAc oligomers
Next, we explored whether the FACE reaction could lead to the
slower mobility of the GlcNAc oligomers in the absence of AMCase
at pH 2.0 or 7.0 using McIlvaine’s buffer. Bands with expected
mobility were obtained when incubated at pH 2.0 (Fig. 2A, left and
right). In contrast, incubation at pH 7.0 resulted in two bands from
each GlcNAc oligomer using Jackson method (Fig. 2A, center and
right) (Jackson, 1990). Slower migrating by-products of the GlcNAc oligomers appeared when the fluorophore labeling reaction
was performed at pH 7.0 (Fig. 2A). Moreover, the fluoresceination
efficiency was lower at pH 7.0 when compared to that at pH 2.0
(Fig. 2A). Thus, caution should be exercised when performing fluorescence labeling of the GlcNAc oligomers directly obtained from
the enzymatic reaction at pH 5.0 ∼ 8.0 using McIlvaine’s buffer by
the method of Jackson (Jackson, 1990).
Next, we attempted to optimize the reaction conditions to
suppress the by-product formation at neutral pH. When we
acidified the reaction with acetic acid before the labeling with fluorophore (pre-acidification), we obtained single bands for all tested
oligomers at both conditions (Fig. 2B). Thus, the by-products were
formed in a pH-dependent manner during the fluorescent labeling.
These results indicate that our pre-acidification method by concentrated acetic acid just before the labeling reaction effectively
prevents the formation of unwanted fragments.
3.3. Effect of buffers on the fluorescent labeling
We next examined the effects of several buffer systems
commonly used in the biochemical evaluation of chitinolytic
activities on the fluorescent labeling of (GlcNAc)1∼6 . We tested
McIlvaine’s (Fig. 3A), phosphate or Tris-HCl (Fig. 3B), as well
as 2-(N-morpholino) ethanesulfonic acid (MES), piperazineN,N -bis (2-ethanesulfonic acid) (PIPES), 4-(2-Hydroxyethyl)-1piperazineethanesulfonic acid (HEPES) and 3-(N-morpholino)
propanesulfonic acid (MOPS) (Fig. 3C) buffers with final concentrations adjusted to 150 mM at pH 7.0. Our pre-acidification method
for the FACE reaction appeared beneficial irrespective of the used
buffer systems (Fig. 3) confirming universal enhancement of the
reaction at pH 7.0.
147
3.4. Application of the pre-acidification method for
determination of the GlcNAc oligomers using standard curve
To evaluate the ability for GlcNAc dimers quantification, we generated standard curves at pH 7.0 and found a linearity between
(GlcNAc)2 and fluorescence intensity to up to 50 nmol (Fig. 4). The
linearity was preserved with the pre-acidification step (Fig. 4).
The detection sensitivity at pH 7.0 was not inhibited by increasing levels of acetic acid when the (GlcNAc)2 was labeled using
the pre-acidification method. Thus, our method enables GlcNAc
oligomers quantification in chitinolytic reactions performed at pH
7.0. To analyze a sample that contains less than 1 nmol of (GlcNAc)2
per 50 L, the volume of the sample solution could be modified
from 50 L to 150 L. Otherwise, addition of concentrated acetic
acid to the sample or longer exposure in a luminescent image analyzer is recommended.
3.5. Re-evaluation of chitin substrates degradation by AMCase
using pre-acidification
Using our pre-acidification method, we re-evaluated the pHdependent degradation of chitin substrates by AMCase. Incubation
of the enzyme (0.8 mU) with colloidal chitin for 1 h in McIlvaine’s
buffer at pH 2.0 ∼ 8.0 resulted in production of primarily (GlcNAc)2
with a low amount of (GlcNAc)3 as well as strong distinct GlcNAc monomer (Fig. 5A). Incubation of AMCase with (GlcNAc)6 for
1 h in McIlvaine’s buffer at pH 2.0 ∼ 8.0 also resulted in production of primarily (GlcNAc)2 (Fig. 5B). The pH-dependent increase
of (GlcNAc)3 levels was more pronounced as compared to colloidal
chitin (Fig. 5B).
3.6. Chitinolytic properties of AMCase in weak acidic and neutral
conditions
The results described above indicate that AMCase can degrade
colloidal chitin and (GlcNAc)6 with relatively high activity even in
weak acidic and neutral environment. To further clarify this finding,
we incubated a reduced AMCase amount (0.1 mU) with (GlcNAc)6
or 4NP-(GlcNAc)2 , a chromogenic substrate used for evaluating
chitinolytic properties of the recombinant enzyme, at pH ranging
from 2.0 to 8.0 at 37 ◦ C for 1 h.
FACE analysis using pre-acidification step indicated that
AMCase produced primarily (GlcNAc)2 and (GlcNAc)3 at pH
2.0 ∼ 5.0 with a second peak (GlcNAc)2 at pH 6.0 and seemed to be
active up to pH 8.0 (Fig. 6A). The colorimetric analysis using 4NP(GlcNAc)2 at 405 nm indicated that its cleavage reached maximum
at pH 2.0 and it decreased at more neutral pH (pH 3.0 ∼ 7.0) (Fig. 6B).
Although both analysis showed similar results, FACE analysis could
detect more pronounced second peak at pH 6.0 (Fig. 6C).
Our results indicate that AMCase can degrade chitin substrates
to (GlcNAc)2 at pH 2.0 ∼ 8.0. These data show that the FACE analysis with pre-acidification is much more sensitive than the assay
using chromogenic substrate, 4NP-(GlcNAc)2 . Our results suggest
that AMCase can degrade chitin substrates not only in stomach but
also in other tissues including lungs and submaxillary glands.
3.7. Detection of GlcNAc oligomers using HPLC or FACE
Next, using HPLC or FACE, we evaluated the degradation of
(GlcNAc)6 by AMCase at strong acidic and neutral conditions. First,
we degraded (GlcNAc)6 in McIlvaine’s buffer using AMCase and
analyzed the HPLC-separated the products having absorbance at
210 nm. We obtained buffer-derived peaks, which are eluted at
approximate positions of (GlcNAc)4∼6 , whereas our improved FACE
method detected proper (GlcNAc)2 and (GlcNAc)3 signal (Supple-
148
S. Wakita et al. / Carbohydrate Polymers 164 (2017) 145–153
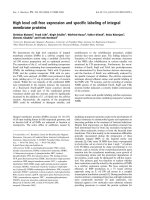
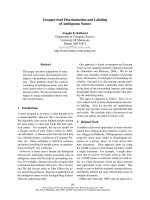
Fig. 1. Detection of pH-dependent fluorophore-labeled bands at pH 5.0 ∼ 8.0. Chitinolytic activity of mouse AMCase was investigated by incubating the enzyme (0.8 mU)
with colloidal chitin or (GlcNAc)6 at pH 2.0 ∼ 8.0 in McIlvaine’s buffer, followed by FACE as described in Materials and methods. Chitin oligomers are shown in the left margin
as standards. Recombinant AMCase degraded colloidal chitin (A) or (GlcNAc)6 (B) and generated primarily (GlcNAc)2 fragments, and in lower amounts the GlcNAc monomer
and (GlcNAc)3 . The quantification is shown right. Fluorescence intensity estimated from the results in Fig. 1A and B. Thin arrows, (GlcNAc)2 fragments; thick arrows, slow
mobile bands.
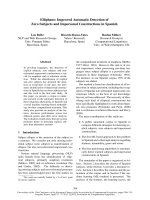
Fig. 2. Comparison of the fluorescent labeling between Jackson’s and our pre-acidification methods. A. Efficiencies of the Jackson’s method at pH 2.0 (left) or 7.0 (center)
using McIlvaine’s buffer. The quantification is shown right. B. The efficiency of the fluorescent labeling chitin oligosaccharide with pre-acidification at pH 2.0 (left) or 7.0
(center). The quantification is shown right.
S. Wakita et al. / Carbohydrate Polymers 164 (2017) 145–153
149
Fig. 3. Effect of different buffers on the labeling of the ANTS conjugate. We tested for labeling of (GlcNAc)1∼6 using McIlvaine’s buffer (A), phosphate or Tris-HCl buffer (B)
and Good buffers (MES, PIPES, HEPES and MOPS) (C). The final concentration of each buffer was adjusted to 150 mM at pH 7.0. M, molecular weight markers of N-acetyl
chitooligosaccharides; J, Jackson’s method; P, pre-acidification method.
Next, we changed the buffer system using Gly-HCl (pH 2.0) and
Tris-HCl (pH 7.0), respectively. We first confirmed that these buffer
systems gave no significant background except for a minor peak
at pH 2.0 at around expected (GlcNAc)2 signal (Supplementary Fig.
S2A and B).
Using these buffer systems, we analyzed the degraded products
by HPLC and our improved FACE methods. The results presented
in Figs. 5 and 6 can be replicated by HPLC at pH 2.0 and pH 7.0,
indicating that AMCase produces (GlcNAc)2 at strong acidic and
neutral conditions (Fig. 7A and B). For FACE analysis, we used a
10× diluted sample because our improved method is very sensitive (pmol amounts) when compared with the conventional HPLC
(Fig. 7C and D). Based on these results, we conclude that AMCase
generates (GlcNAc)2 under physiological conditions and that our
improved FACE method is very sensitive and effective for the detection and quantification of chitin oligomers.
4. Discussion
Fig. 4. Quantification of (GlcNAc)2 using standard curve. A. To evaluate the ability for GlcNAc dimers quantification, we labeled (GlcNAc)2 fragments at pH 7.0. B.
Quantification of GlcNAc oligomer was tested at up to 50 nmol of (GlcNAc)2 . There
was a linearity between (GlcNAc)2 and fluorescence intensity in the whole range at
pH 7.0. The linearity was preserved when using pre-acidification.
mentary Fig. S1A and B). This is probably caused by the citrate and
phosphate in McIlvaine’s buffer having absorbance at 210 nm.
AMCase has been shown to be predominantly produced in
mouse stomach (Boot et al., 2005; Ohno et al., 2013; Ohno et al.,
2012) and to have maximal enzymatic activity at pH 2.0 (Boot
et al., 2001; Kashimura et al., 2013). Previous studies were carried
out using natural chitin substrates at acidic conditions concluding
that AMCase produces primarily (GlcNAc)2 at pH 2.0 (Boot et al.,
2001; Kashimura et al., 2015; Kashimura et al., 2013). It has also
been shown that AMCase can function as a digestive enzyme in the
mouse gastrointestinal tract (Ohno et al., 2016; Ohno et al., 2013;
Ohno et al., 2012).
150
S. Wakita et al. / Carbohydrate Polymers 164 (2017) 145–153
Fig. 5. Re-examination of the pH degradation of chitin substrates by AMCase using pre-acidification method. We performed same experiments in Fig. 1A and B except for
labeling by ANTS using our pre-acidification method.
Fig. 6. Chitinolytic properties of AMCase under somatic tissue pH conditions. A. The enzymatic reactions using (GlcNAc)6 were carried out in a volume of 50 L containing 0.1
mU E. coli-expressed mouse AMCase in McIlvaine’s buffer. B. The pH dependence of chitinolytic activity of AMCase using 4NP-(GlcNAc)2 as a substrate. The values represent
the percentage of the maximum activity at pH 2.0. C. Comparison of the chitinolytic activity of recombinant AMCase analyzed by our improved FACE method (Fig. 6A) and
the colorimetric analysis using 4NP-(GlcNAc)2 at 405 nm (Fig. 6B). The values were represented as percentage of the maximum activity at pH 2.0.
Our previous gene expression analysis revealed that AMCase
mRNA is also expressed at high levels in salivary gland
and lung tissues (Ohno et al., 2012). Chitin oligomers (Nacetyl-chitooligosaccharides) have various biological activities in
mammalian cells (Aam et al., 2010; Khoushab & Yamabhai, 2010).
Anti-cancer and anti-inflammatory properties have been reported
for both chitin and chitosan oligosaccharides (Azuma et al., 2015;
Masuda et al., 2014). Mouse AMCase has been shown to be active
at up to pH 8.0, although its activity substantially decreases with
higher pH (Boot et al., 2001; Kashimura et al., 2013). We hypothesized that under pathological conditions, AMCase is upregulated
and can generate specific degradation products different from those
in stomach condition and that they can modify the bioactivity of the
chitin degradation products. Therefore, we have been interested in
S. Wakita et al. / Carbohydrate Polymers 164 (2017) 145–153
151
Fig. 7. Detection of GlcNAc oligomers using HPLC and FACE methods. (GlcNAc)6 was degraded by AMCase at pH 2.0 or pH 7.0 as described in Materials and Methods. The
samples were analyzed by HPLC (A) or FACE (B). Numbers with arrows indicate the number of GlcNAc units in the corresponding peaks. For FACE, we used a 10 x diluted
sample. C. Analysis of HPLC-separated degradation products by HPLC. D. Quantification of data generated by HPLC and FACE.
the AMCase-mediated degradation pattern of chitin substrates at
neutral conditions.
The widely-used Jackson method for oligosaccharides detection
(Jackson, 1990) is used for reducing ends labeling in the analyzed
molecules followed by high resolution PAGE. We usually conduct
chitin degradation reaction using McIlvaine’s buffer, which is a
citrate/phosphate buffer system allowing us to set the pH over a
broad range. However, we found two drawbacks of this method for
chitin oligosaccharides labeling directly used in high concentration
of non-volatile buffer. By FACE analysis, we noticed that AMCase
produced not only the predominant GlcNAc dimer but also certain
number of fragments with slower mobility at pH > 5.0. We found
that these additional fragments (here called “by-products”) were
generated at pH 5.0 ∼ 8.0 not during the digestion by AMCase but
during the oligomers labeling (Fig. 1). Importantly, we observed
reduced labeling at higher pH values when compared to pH 2.0
(Fig. 2A).
To overcome these problems, we developed an improved
method for fluorescent labeling enabling us to efficiently label the
reducing ends of the GlcNAc oligomers generated during the enzymatic reactions performed at pH 2.0 ∼ 8.0. We achieved this by
acidification of the sample by concentrated acetic acid just before
the labeling step with the fluorophore. Importantly, during labeling, pH has to be adjusted to pH < 4.0. The original Jackson method,
however, is suitable for pH < 4.0, adjusted by addition of concentrated acetic acid to the dried sample (Jackson, 1990). Although we
do not know the chemical structure of the by-products, our preacidification procedure was able to suppress the side reaction and
form single bands corresponding to the GlcNAc oligomer markers
(Fig. 2B). This method is simple and can be applied to various buffers
commonly used for biochemical analyses (Fig. 3). In addition, the
fluorescence efficiency increased allowing better quantification of
the GlcNAc oligomers. Our pre-acidification method presented in
this report [diagrammatic scheme of overall our improved method
and the formation of ANTS-(GlcNAc)2 are described in Supplementary Figs. S3 and S4] is essentially identical with the methods
reported by Jackson (Jackson, 1990) except for addition of concentrated acetic acid before fluorescent labeling reaction.
In the original Jackson method (Jackson, 1990), the saccharide
samples to be labeled were initially dissolved in water or else dissolved in 0.1 M ammonium acetate, then dried under vacuum and
re-dissolved in water. Because ammonium acetate is volatile, the
dried sample would be buffer-free before re-dissolving in water.
Then, for the labeling reaction the diluted acetic acid is sufficient
to maintain the acidic environment needed to catalyze the opening of the reducing end sugar. But, in our experiments, all samples
were dissolved in high concentration of non-volatile buffer before
labeling. This is why we found it necessary to add more acetic acid,
in order to ensure an acidic solution during the labeling reaction.
Our improved method provides a simple solution to the observation of unknown side products in the fluorescent labeling of chitin
oligosaccharides at the reducing end, for use in FACE analysis of
chitin oligosaccharides. It could become widely adopted by other
laboratories.
Finally, we re-examined the pH-dependent degradation of the
chitin substrates using our pre-acidification method for labeling the
GlcNAc oligomers (Figs. 5 and 6). We noticed that, at pH 5 ∼ 8, the
products generated from chitin substrates are more abundant than
those from the synthetic chromogenic substrate of 4NP-(GlcNAc)2
(Fig. 6) (Kashimura et al., 2013). These data indicate that the degradation ability of AMCase against colloidal chitin is superior to the
synthetic substrates at pH 5 ∼ 8 and that AMCase can work under
somatic tissue pH conditions. Family 18 chitinases are proposed to
utilize the substrate-assisted catalytic mechanism while their catalytic domains having TIM-barrel fold (Terwisscha van Scheltinga
et al., 1995). The DXXDXDXE motif included in this domain is
thought to have a central role in substrate binding and catalysis
in acidic condition (Chou et al., 2006) with His187 of AMCase being
responsible for the acidic optimum (Bussink, Vreede, Aerts, & Boot,
2008). This folding mechanism could explain the mouse AMCasemediated (GlcNAc)2 production at pH 2.0. The mechanistic details
of the AMCase activity at pH 7.0 remains to be determined. Taken
152
S. Wakita et al. / Carbohydrate Polymers 164 (2017) 145–153
together, AMCase can work under strong acidic to neutral condition
and degrade chitin substrates to produce predominantly (GlcNAc)2 .
We did not obtain any indication of longer GlcNAc oligomers
production under physiological conditions. One can speculate that
AMCase-mediated longer GlcNAc oligomers production may occur
under pathological conditions. On the other hand, long oligomers
produced by inefficient chitin degradation, might be stimuli or
enhancers of certain pathologies.
5. Conclusions
Mouse AMCase has optimal pH at pH 2.0 for the maximum
activity and is active at up to pH 8. We performed an extensive
analysis of chitin degradation by AMCase not only in strong acidic,
but also weak acidic to neutral conditions. When we analyzed
chitin degradation products in weak acidic to neutral conditions by
FACE established originally for oligosaccharides analysis, we found
that the by-products in the fluoresceinated reaction were formed
by labeling at pH > 5 and established a pre-acidification method
for chitin oligosaccharide analysis to suppress these products formations. Using this procedure, we found that AMCase generates
(GlcNAc)2 and (GlcNAc)3 at conditions mimicking somatic tissue
pH conditions as well as at pH 2.0.
Acknowledgements
We are grateful to Daisuke Yamanaka, Naohito Ohno, Tadatomo
Kawai, Shinji Nagumo, Yasutada Imamura and Yoshiaki Furukawa
for their suggestions and encouragement, to Kazuaki Okawa,
Daisuke Mizutani, Eri Tabata for valuable suggestions. This work
was supported by the Project Research Grant from the Research
Institute of Science and Technology, Kogakuin University, and
Grants-in-Aid for Scientific Research (15J10960 and 16K07699)
from the Ministry of Education, Culture, Sports, Science, and Technology of Japan, and Grant from the Science Research Promotion
Fund of the Promotion and Mutual Aid Corporation for Private
Schools of Japan and in part by a grant of the Strategic Research
Foundation Grant-aided Project for Private Universities (S1411005)
from the Ministry of Education, Culture, Sport, Science and Technology, Japan. P.O.B. received support from ALS Association and Mayo
Clinic Center for Regenerative Medicine.
Appendix A. Supplementary data
Supplementary data associated with this article can be found, in
the online version, at />095.
References
Aam, B. B., Heggset, E. B., Norberg, A. L., Sorlie, M., Varum, K. M., & Eijsink, V. G.
(2010). Production of chitooligosaccharides and their potential applications in
medicine. Marine Drugs, 8(5), 1482–1517.
Azuma, K., Osaki, T., Minami, S., & Okamoto, Y. (2015). Anticancer and
anti-inflammatory properties of chitin and chitosan oligosaccharides. Journal
of Functional Biomaterials, 6(1), 33–49.
Bierbaum, S., Nickel, R., Koch, A., Lau, S., Deichmann, K. A., Wahn, U., et al. (2005).
Polymorphisms and haplotypes of acid mammalian chitinase are associated
with bronchial asthma. American Journal of Respiratory and Critical Care
Medicine, 172(12), 1505–1509.
Boot, R. G., Renkema, G. H., Strijland, A., van Zonneveld, A. J., & Aerts, J. M. (1995).
Cloning of a cDNA encoding chitotriosidase, a human chitinase produced by
macrophages. Journal of Biological Chemistry, 270(44), 26252–26256.
Boot, R. G., Blommaart, E. F., Swart, E., Ghauharali-van der Vlugt, K., Bijl, N., Moe, C.,
et al. (2001). Identification of a novel acidic mammalian chitinase distinct from
chitotriosidase. Journal of Biological Chemistry, 276(9), 6770–6778.
Boot, R. G., Bussink, A. P., Verhoek, M., de Boer, P. A., Moorman, A. F., & Aerts, J. M.
(2005). Marked differences in tissue-specific expression of chitinases in mouse
and man. Journal of Histochemistry and Cytochemistry, 53(10), 1283–1292.
Bucolo, C., Musumeci, M., Maltese, A., Drago, F., & Musumeci, S. (2008). Effect of
chitinase inhibitors on endotoxin-induced uveitis (EIU) in rabbits.
Pharmacological Research, 57(3), 247–252.
Bucolo, C., Musumeci, M., Musumeci, S., & Drago, F. (2011). Acidic mammalian
chitinase and the eye: Implications for ocular inflammatory diseases. Frontiers
in Pharmacology, 2, 43.
Bueter, C. L., Specht, C. A., & Levitz, S. M. (2013). Innate sensing of chitin and
chitosan. PLoS Pathogens, 9(1), e1003080.
Bussink, A. P., van Eijk, M., Renkema, G. H., Aerts, J. M., & Boot, R. G. (2006). The
biology of the Gaucher cell: The cradle of human chitinases. International
Review of Cytology, 252, 71–128.
Bussink, A. P., Vreede, J., Aerts, J. M., & Boot, R. G. (2008). A single histidine residue
modulates enzymatic activity in acidic mammalian chitinase. FEBS Letters,
582(6), 931–935.
Chou, Y. T., Yao, S., Czerwinski, R., Fleming, M., Krykbaev, R., Xuan, D., et al. (2006).
Kinetic characterization of recombinant human acidic mammalian chitinase.
Biochemistry, 45(14), 4444–4454.
Cozzarini, E., Bellin, M., Norberto, L., Polese, L., Musumeci, S., Lanfranchi, G., et al.
(2009). CHIT1 and AMCase expression in human gastric mucosa: Correlation
with inflammation and Helicobacter pylori infection. European Journal of
Gastroenterology and Hepatology, 21(10), 1119–1126.
Hamid, R., Khan, M. A., Ahmad, M., Ahmad, M. M., Abdin, M. Z., Musarrat, J., et al.
(2013). Chitinases: An update. Journal of Pharmacy & Bioallied Sciences, 5(1),
21–29.
Jackson, P. (1990). The use of polyacrylamide-gel electrophoresis for the
high-resolution separation of reducing saccharides labelled with the
fluorophore 8-aminonaphthalene-1,3,6-trisulphonic acid. Detection of
picomolar quantities by an imaging system based on a cooled charge-coupled
device. Biochemical Journal, 270(3), 705–713.
Kashimura, A., Okawa, K., Ishikawa, K., Kida, Y., Iwabuchi, K., Matsushima, Y., et al.
(2013). Protein A-mouse acidic mammalian chitinase-V5-His expressed in
periplasmic space of Escherichia coli possesses chitinase functions comparable
to CHO-expressed protein. PLoS One, 8(11), e78669.
Kashimura, A., Kimura, M., Okawa, K., Suzuki, H., Ukita, A., Wakita, S., et al. (2015).
Functional properties of the catalytic domain of mouse acidic mammalian
chitinase expressed in Escherichia coli. International Journal of Molecular
Sciences, 16(2), 4028–4042.
Kazami, N., Sakaguchi, M., Mizutani, D., Masuda, T., Wakita, S., Oyama, F., et al.
(2015). A simple procedure for preparing chitin oligomers through acetone
precipitation after hydrolysis in concentrated hydrochloric acid. Carbohydrate
Polymers, 132, 304–310.
Khoushab, F., & Yamabhai, M. (2010). Chitin research revisited. Marine Drugs, 8(7),
1988–2012.
Koch, B. E., Stougaard, J., & Spaink, H. P. (2015). Keeping track of the growing
number of biological functions of chitin and its interaction partners in
biomedical research. Glycobiology, 25(5), 469–482.
Laemmli, U. K. (1970). Cleavage of structural proteins during the assembly of the
head of bacteriophage T4. Nature, 227(5259), 680–685.
Lee, C. G., Da Silva, C. A., Dela Cruz, C. S., Ahangari, F., Ma, B., Kang, M. J., et al.
(2011). Role of chitin and chitinase/chitinase-like proteins in inflammation,
tissue remodeling and injury. Annual Review of Physiology, 73, 479–501.
Masuda, S., Azuma, K., Kurozumi, S., Kiyose, M., Osaki, T., Tsuka, T., et al. (2014).
Anti-tumor properties of orally administered glucosamine and
N-acetyl-D-glucosamine oligomers in a mouse model. Carbohydrate Polymers,
111, 783–787.
Musumeci, M., Aragona, P., Bellin, M., Maugeri, F., Rania, L., Bucolo, C., et al. (2009).
Acidic mammalian chitinase in dry eye conditions. Cornea, 28(6), 667–672.
Nookaew, I., Thorell, K., Worah, K., Wang, S., Hibberd, M. L., Sjovall, H., et al. (2013).
Transcriptome signatures in Helicobacter pylori-infected mucosa identifies
acidic mammalian chitinase loss as a corpus atrophy marker. BMC Medical
Genomics, 6, 41.
Ohno, M., Tsuda, K., Sakaguchi, M., Sugahara, Y., & Oyama, F. (2012). Chitinase
mRNA levels by quantitative PCR using the single standard DNA: Acidic
mammalian chitinase is a major transcript in the mouse stomach. PLoS One,
7(11), e50381.
Ohno, M., Togashi, Y., Tsuda, K., Okawa, K., Kamaya, M., Sakaguchi, M., et al. (2013).
Quantification of chitinase mRNA levels in human and mouse tissues by
real-time PCR: Species-specific expression of acidic mammalian chitinase in
stomach tissues. PLoS One, 8(6), e67399.
Ohno, M., Kimura, M., Miyazaki, H., Okawa, K., Onuki, R., Nemoto, C., et al. (2016).
Acidic mammalian chitinase is a proteases-resistant glycosidase in mouse
digestive system. Scientific Reports, 6, 37756.
Okawa, K., Ohno, M., Kashimura, A., Kimura, M., Kobayashi, Y., Sakaguchi, M., et al.
(2016). Loss and gain of human acidic mammalian chitinase activity by
nonsynonymous SNPs. Molecular Biology and Evolution, 33, 3183–3193.
Reese, T. A., Liang, H. E., Tager, A. M., Luster, A. D., Van Rooijen, N., Voehringer, D.,
et al. (2007). Chitin induces accumulation in tissue of innate immune cells
associated with allergy. Nature, 447(7140), 92–96.
Renkema, G. H., Boot, R. G., Muijsers, A. O., Donker-Koopman, W. E., & Aerts, J. M.
(1995). Purification and characterization of human chitotriosidase, a novel
member of the chitinase family of proteins. Journal of Biological Chemistry,
270(5), 2198–2202.
Seibold, M. A., Reese, T. A., Choudhry, S., Salam, M. T., Beckman, K., Eng, C., et al.
(2009). Differential enzymatic activity of common haplotypic versions of the
human acidic mammalian chitinase protein. Journal of Biological Chemistry,
284(29), 19650–19658.
S. Wakita et al. / Carbohydrate Polymers 164 (2017) 145–153
Sutherland, T. E., Andersen, O. A., Betou, M., Eggleston, I. M., Maizels, R. M., van
Aalten, D., et al. (2011). Analyzing airway inflammation with chemical biology:
Dissection of acidic mammalian chitinase function with a selective drug-like
inhibitor. Chemistry and Biology, 18(5), 569–579.
Terwisscha van Scheltinga, A. C., Armand, S., Kalk, K. H., Isogai, A., Henrissat, B., &
Dijkstra, B. W. (1995). Stereochemistry of chitin hydrolysis by a plant
chitinase/lysozyme and X-ray structure of a complex with allosamidin:
Evidence for substrate assisted catalysis. Biochemistry, 34(48), 15619–15623.
153
Yang, C. J., Liu, Y. K., Liu, C. L., Shen, C. N., Kuo, M. L., Su, C. C., et al. (2009). Inhibition
of acidic mammalian chitinase by RNA interference suppresses
ovalbumin-sensitized allergic asthma. Human Gene Therapy, 20(12),
1597–1606.
Zhu, Z., Zheng, T., Homer, R. J., Kim, Y. K., Chen, N. Y., Cohn, L., et al. (2004). Acidic
mammalian chitinase in asthmatic Th2 inflammation and IL-13 pathway
activation. Science, 304(5677), 1678–1682.