Antioxidant starch films containing sunflower hull extracts
Bạn đang xem bản rút gọn của tài liệu. Xem và tải ngay bản đầy đủ của tài liệu tại đây (1.28 MB, 10 trang )
Carbohydrate Polymers 214 (2019) 142–151
Contents lists available at ScienceDirect
Carbohydrate Polymers
journal homepage: www.elsevier.com/locate/carbpol
Antioxidant starch films containing sunflower hull extracts
Carolin Menzel
a,b,⁎
b
b
, Chelo González-Martínez , Amparo Chiralt , Francisco Vilaplana
T
a
a
Division of Glycoscience, Department of Chemistry, School of Engineering Sciences in Chemistry, Chemistry, Biotechnology and Health, KTH Royal Institute of Technology,
AlbaNova University Centre, Stockholm, Sweden
Departamento de Tecnología de Alimentos, Instituto de Ingeniería de Alimentos para el Desarrolla, Universitat Politécnica de Valencia, Spain
b
A R T I C LE I N FO
A B S T R A C T
Keywords:
Renewable packaging
Physical properties
Antimicrobial activity
Molecular weight
DPPH
Chlorogenic acid
This study explores the preparation of antioxidant starch food packaging materials by the incorporation of
valuable phenolic compounds extracted from sunflower hulls, which are an abundant by-product from food
industry. The phenolic compounds were extracted with aqueous methanol and embedded into starch films. Their
effect on starch films was investigated in terms of antioxidant activity, optical, thermal, mechanical, barrier
properties and changes in starch molecular structure. The starch molecular structure was affected during thermal
processing resulting in a decrease in molar mass, smaller amylopectin molecules and shorter amylose branches.
Already 1–2% of extracts were sufficient to produce starch films with high antioxidant capacity. Higher amounts
(4–6%) of extract showed the highest antioxidant activity, the lowest oxygen permeability and high stiffness and
poor extensibility. The phenolic extracts affected predominantly the mechanical properties, whereas other
changes could mainly be correlated to the lower glycerol content which was partially substituted by the extract.
1. Introduction
There is an increasing interest to exploit by-products from food industries as matrices and additives in packaging materials contributing
to the material and process sustainability towards a circular bio-based
economy. An illustrative example of the potential of such by-products
are sunflower hulls. In 2016, the world production of sunflower seed
was estimated to 49.9 million tons, with Ukraine and Russia as major
producers counting for 27% and 22%, respectively (FAOSTAT, 2016).
Sunflower hulls are a by-product from sunflower seed production and
exhibit very low nutritional value for human and animal nutrition due
to their low digestibility. The hull represents between 20–30% of the
sunflower seed and is often removed before oil extraction or snack
processing. Hulls are mainly composed of carbohydrates (of which are
40–50% cellulose) and low amounts of lipids and proteins (Cancalon,
1971). However, sunflower hulls have also a great antioxidant activity
due to a high value of total phenolic compounds (Velioglu, Mazza, Gao,
& Oomah, 1998) that could have potential for obtaining antioxidant
extracts. De Leonardis, Macciola, and Di Domenico (2005) extracted an
antioxidant product from sunflower hulls that was reported to be economically suitable. Furthermore, there has been a patent on a natural
red sunflower anthocyanin colorant with naturally stabilized color
qualities as coloring agent in food products, cosmetics and pharmaceuticals (Fox, 2000).
⁎
In the framework of the relatively recent concept of active and intelligent packaging, the incorporation of antioxidants or antimicrobials
to packaging materials is useful to extend the shelf-life and improve
food safety or sensory properties (Valdés, Mellinas, Ramos, Garrigós, &
Jiménez, 2014). Active packaging systems can either deliver a compound into the packaged food and into the headspace or remove undesired compounds from the product and its environment. Most developments aim to directly incorporate active components into the
polymer matrix of the packaging but at the same time maintaining or
improving the barrier and mechanical properties of the initial material.
Natural compounds with antioxidant properties currently show a significant interest and can potentially be used in food packaging to replace synthetic antioxidants, as they can be biologically degradable and
are normally considered as safe migrants (Dainelli, Gontard,
Spyropoulos, Zondervan-van den Beuken, & Tobback, 2008). For instance, the addition of antioxidants such as α-tocopherol or citric acid
into edible starch-chitosan blends resulted in good antioxidant capacity
of the films but also good barrier properties (Bonilla, Talón, Atarés,
Vargas, & Chiralt, 2013). The incorporation of plant essential oils has
been shown to enhance mechanical and barrier properties of starch
films (Ghasemlou et al., 2013) but also to increase the antioxidant capacity of films and their antimicrobial properties (Oriani, Molina,
Chiumarelli, Pastore, & Hubinger, 2014). Likewise, starch is a very
promising biopolymer for the production of packaging materials since it
Corresponding author at: KTH Royal Institute of Technology, Roslagstullbacken 21, Plan 2, SE-10044 Stockholm, Sweden.
E-mail addresses: (C. Menzel), (C. González-Martínez), (A. Chiralt), (F. Vilaplana).
/>Received 3 December 2018; Received in revised form 6 March 2019; Accepted 6 March 2019
Available online 07 March 2019
0144-8617/ © 2019 The Authors. Published by Elsevier Ltd. This is an open access article under the CC BY license
( />
Carbohydrate Polymers 214 (2019) 142–151
C. Menzel, et al.
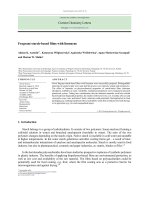
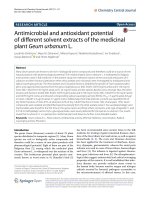
Fig. 1. Schematic milling and sieving process,
with weight percentage (bold numbers with
particle size) based on 100% starting material
that passed the sieve of 0.6 mm or 0.2 mm after
continuous milling. Joined material with particle size < 0.6 mm (red marked in the center)
was used for all further extractions. Numbers
in casket are total phenolic contents expressed
as mg GAE/100 g dry sample) (For interpretation of the references to colour in this figure
legend, the reader is referred to the web version of this article).
polymerization (DP) above 200 units, according to Vilaplana, Hasjim,
and Gilbert (2012).
Glycerol, sodium carbonate, methanol and ethanol were purchased
from PanReac Quimica S.L.U. (Castellar del Vallés, Barcelona, Spain).
Gallic acid, caffeic acid, pyrogallol, ferulic acid, chlorogenic acid, 2,2Diphenyl-1-picrylhydrazyl (DPPH) and Folin-Ciocalteu reagent (2N)
were purchased from Sigma-Aldrich (Saint Louis, USA). All other reagents and solvents were of analytical grade. Phosphate buffered saline,
tryptone soy broth, tryptone soy agar and thiazolyl blue tetrazolium
bromide (MTT) reagent were purchased by Scharlab (Barcelona, Spain).
Escherichia coli (CECT 101) and Listeria innocua were obtained from the
Spanish Type Cellection (CECT, University de Valencia, Spain).
is not only renewable but also biodegradable and available with high
purity at low cost (Jiménez, Fabra, Talens, & Chiralt, 2012; Versino,
Lopez, Garcia, & Zaritzky, 2016). Starch consists of two main polymers,
amylose and amylopectin, with distinct branching structure and physicochemical properties. Amylose is considered as an almost linear
polymer consisting of linear chains of α-(1 → 4)-linked glucose units
with very few α-(1 → 6) glycosidic bonds at the branching points, and a
molecular weight of about 106 Da. Amylopectin, on the other hand, is a
highly branched macromolecule comprising of many α-(1 → 4)-linked
glucose short elongated chains, branched by α-(1 → 6) glycosidic
bonds, with a much larger molecular weight of about 108 Da (Tester,
Karkalas, & Qi, 2004). Native starch exists as a granular structure and
can be thermo-processed into a continuous phase with the assistance of
added water or plasticizers (small molecules such as glycerol or sorbitol), i.e., thermoplastic starch, which forms films with excellent
oxygen barrier properties (Forssell, Lahtinen, Lahelin, & Myllärinen,
2002). However, starch films still demonstrate problems such as brittleness in the absence of a plasticizer and a very hydrophilic character,
which results in water sensitivity and poor moisture barrier properties
(Laohakunjit & Noomhorm, 2004).
In this study the suitability of sunflower hulls for the extraction of
antioxidants was investigated and their potential use as additive in
starch films to produce renewable food packaging materials was demonstrated as a proof of concept. Therefore, the extraction process of
an antioxidant fraction was optimized and the extract was characterized in terms of its total phenolic content, antioxidant capacity, antimicrobial activity and phenolic acid composition. The final phenolic
extract was included into compression molded starch films which were
analyzed in terms of their in-vitro antioxidant capacity, appearance,
tensile and barrier properties. The changes in the molecular structure of
starch during the film production were assessed in terms of molar mass
and branch chain-length distribution of the amylopectin and amylose
components.
2.2. Extraction of phenolics from sunflower hulls and evaluation of their
activity
2.2.1. Extraction of total phenolics from sunflower hull residue
Sunflower hulls were washed with water to remove the residues of
kernels, sand and other impurities were allowed to settle down. Hulls
were very light and were swimming on the water surface, hence, hulls
were easily skimmed off and dried at 40 °C overnight. The hulls were
milled using a mixer (Moulinex A320R1, 700 W). The milling process
was optimized using several sieving (< 0.6 mm and < 0.2 mm) and
milling steps (up to 3 times) by measuring total phenolic content using
Folin-reagent in the different fractions (schematic Fig. 1) which were all
extracted with 80% aqueous MeOH, stirred for 30 min at room temperature, by using a 1:20 hull:solvent ratio. After optimization of the
milling process, the extraction process was further optimized.
The final optimization of the extraction of phenolic compounds was
conducted using either 80% aqueous MeOH or 80% aqueous EtOH at
either 1:10 or 1:20 hull:solvent ratio for 30 min or 1 h. Subsequently,
the organic solvent was evaporated at 35 °C under vacuum and the
residual extract was lyophilized. The weight of the dry residue was
determined gravimetrically. All characterizations were done in triplicate.
2. Material and methods
2.1. Material
2.2.2. Determination of total phenolic content
Total phenolic content was determined using Folin-Ciocalteau reagent. In brief, 0.5 ml sample extract and 6 ml distilled water were first
mixed in a glass tube and then 0.5 ml Folin reagent (2N) were added.
After one minute, 1.5 ml sodium carbonate solution (20%, w/v) was
added and the mixture was filled up to 10 ml with distilled water and
incubated for 2 h at room temperature in the dark. The absorbance was
Sunflower hulls were kindly supplied by Grefusa (Alzira, Spain) as
waste by-product of the snack sunflower seed production. Potato starch
was supplied by Roquette (France) with an amylose content of 27%,
calculated as the area under the curve of the branch chain-length distribution of debranched native potato starch for degree of
143
Carbohydrate Polymers 214 (2019) 142–151
C. Menzel, et al.
measured spectrophotometrically at 725 nm using a UV–vis spectrophotometer (Evolution 201, Thermo Scientific) against a solvent blank
of methanol. A gallic acid solution was used as a standard for calibration and total phenolic content was expressed as mg of gallic acid
equivalents (GAE) /100 g of dry sunflower hulls. All characterizations
were performed in triplicates.
plate was incubated at 37 °C for 24 h. Afterwards 10 μl MTT solution
was added to each well and incubated again for 4 h more at 37 °C.
Finally the growth was checked visually by observing the change of
colour since alive bacteria has the capacity to metabolize the MTT reagent and form a purple complex. The amount of sample that showed
no purple colour formation indicates the MIC.
2.2.3. Evaluation of antioxidant capacity using DPPH* assay
The antioxidant capacity was evaluated by the DPPH* assay according to Brand-Williams, Cuvelier, and Berset (1995) with small
modifications. In brief, a solution of 0.06 mM DPPH in methanol was
added to 4 ml total volume in a cuvette to different amounts of the
methanolic and ethanolic fraction extracted from the sunflower hulls
(0.10, 0.15, 0.20, 0.25, 0.30, 0.35 ml). A blank sample was prepared
using the same volumes of ethanolic or methanolic solvent. Solutions
were kept in the dark for 4 h at room temperature. A reaction time of
4 h was necessary until a stable absorbance was reached. The resulting
absorbance was measured at 515 nm using a spectrophotometer (Evolution 201, Thermo Scientific). All characterizations were done in triplicate and results were expressed as amount necessary to decrease the
initial DPPH* concentration by 50% (Efficient concentration = EC50 in
mg dry sample/mg DPPH*) (Brand-Williams et al., 1995).
2.3. Preparation and characterization of starch films with bioactive
properties
2.3.1. Starch film preparation using melt blending and compression molding
Native potato starch was blended with glycerol (0.25 g/g starch),
using 40 g starch and 10 g glycerol (CS_10G). Glycerol was partially
substituted by four different amounts of phenolic extract, 0.5 g, 1 g, 2 g
and 3 g which resulted in 1, 2, 4 and 6 wt% of extract within the film
forming formulation. Furthermore, one starch formulation with 40 g
starch and 7 g glycerol (CS_7G) was prepared for comparison purposes.
Table 3 shows the film composition and sample codes. The blends were
introduced into an internal mixer (Haake PolyLab QC, Thermo Fisher
Scientific, Germany) and homogenized at 160 °C for 7 min. The antioxidant extract (AOE) was added seven minutes after the starch had
been blended in the internal mixer with glycerol and mixing continued
2 min more. The mixer chambers were preheated at 160 °C with rotors
operating at 50 rpm. The optimum conditions to process potato starch
with glycerol in the internal mixer were pre-determined using different
mixing times and temperatures and monitoring the evolution of torque
during the mixing.
The processed melts were grinded and equilibrated at 53% relative
humidity (RH) at 25 °C for 7 days and afterwards films of about 200 μm
thickness were produced by compression molding using Teflon molds of
about 20 cm diameter. About 4 g of starch melt was introduced between
two metal plates and preheated at 160 °C for 4 min without applying
pressure. During the following 8 min heating cycle, the pressure was
increased from 30 bar (2 min) to 130 bar (6 min) and afterwards a fast
cooling (3 min) was applied to reduce the temperature to about 70 °C.
The films were conditioned at 53% RH for 7 days at room temperature
in a sealed chamber containing an oversaturated solution of magnesium
nitrate. Relative humidity was measured by a digital RH-meter.
Thickness of the conditioned films was measured in at least six random
points of each sample using a digital electronic micrometer with an
accuracy of 0.001 mm (Palmer model COMECTA, Barcelona). Digital
pictures of the films were taken using a conventional camera.
2.2.4. Identification and quantification of phenolic acids using HPLC-DAD
Phenolic acids in the extracts were determined according to
Szydłowska-Czerniak, Trokowski, and Szłyk (2011) using a Waters
HPLC-DAD system (Waters 2695 separation module, Waters 2996
photodiode array detector) equipped with a Waters Empower Data
Chromatography Software. A RP-C18 column (Brisa LC2 C18 5 μm
particle size, 250 mm × 4.6 mm i.D., Teknokroma Analytítica, Spain)
with a C18 guard column from Phenomenex (3.2–8.0 mm i.D.) was used
for separation and operated at 25 °C and 1 ml/min flow rate. The mobile phase consisted of 2% (v/v) acetic acid in water (eluent A) and
100% methanol (eluent B). The gradient was as follows: 100–75% A
(11 min), 71.25% A (4 min), 64% A (10 min), 55% A (10 min), 35% A
(3 min), 100% A (3 min) and 100% A (4 min). The column was washed
with 100% B for 10 min and equilibrated to the starting conditions for
5 min before next injection. The total run time was 60 min and injection
volume of each sample and calibration standard was 20 μL. Calibration
was carried out between 0.5 and 100 mg/L of caffeic acid, chlorogenic
acid, gallic acid, pyrogallic acid and ferulic acid and UV/Vis spectra
between 210–400 nm were recorded at a spectral acquisition rate of
1.25 scans/s. Individual compounds were quantified using a calibration
curve of the corresponding standard compound at either 325 nm or
270 nm. All characterizations were performed in triplicates.
2.3.2. Size-exclusion chromatography for size, molecular weight and branch
chain-length distribution of starch films
2.3.2.1. Molar mass distribution of starch molecules. The molecular size
distributions of starch before and after production of compressionmolded films were analyzed using same size-exclusion parameters as
described elsewhere (Vilaplana & Gilbert, 2010). Starch films were
dissolved in DMSO/LiBr 0.5% (w/w) at a concentration of about 3 mg/
ml and heated to 60 °C under stirring overnight. Samples were injected
into a Size-exclusion Chromtographer (SECurity 1260, Polymer
Standard Service, Mainz, Germany) with triple detection (RI, UV and
MALLS) and separated using GRAM pre-column, 100 Å and 10,000 Å
analytical columns from PSS (Mainz, Germany) at a flow rate of 0.5 ml/
min at 60 °C. Calibration was carried out using pullulan standards with
molecular weight of 342 to 708,000 Da to relate the elution volume Vel
to the hydrodynamic volume Vh using a dn/dc value of 0.0853 ml/g
and Mark-Houwink parameters K = 2.427*10−4dl/g and a = 0.6804
(for pullulan standards). The data was processed using WinGPC (PSS,
Mainz, Germany) software to get weight distributions of separated
starch molecules.
2.2.5. Antimicrobial activity of sunflower hull extracts
Antimicrobial activity of sunflower hull extracts were tested against
E. coli (CECT 101) and Listeria innocua (CECT 910) using the MTT assay
on a 96-well microtiter plates according to Houdkova, Rondevaldova,
Doskocil, and Kokoska (2017). The MTT assay is a colorimetric assay
for assessing cell metabolic activity. NAD(P)H-dependent cellular oxidoreductase enzymes may, under defined conditions, reflect the
number of viable cells present. These enzymes are capable of reducing
the tetrazolium dye MTT to its insoluble formazan, which has a purple
color and can be detected visually.
The bacterial strains were grown in tryptone soy buffer and diluted
to a working solution of 105 colony forming unit (CFU). A MTT reagent
was freshly prepared (5 mg/ml) and freeze-dried phenolic extracts from
sunflower hulls were dissolved in the tryptone soy buffer (100 mg/ml).
The minimum inhibitory concentration (MIC) determination of both
bacteria strains were performed in 96-well plates with the following
scheme; for each bacteria strain 100 μl of the 105 CFU dispersion was
added to the wells and 10, 20, 30, 40, 50, 60, 70, 80, 90 or 100 μl
sample solution was added together with the appropriate amount of
tryptone soy buffer to give a final volume of 200 μl in each well. The
2.3.2.2. Debranching of starch. About 50 mg of starch were weighed
into a tube and wetted with 0.5 ml distilled water and then 4.5 ml
DMSO was added and heated in a boiling water bath for 1 h and then
144
Carbohydrate Polymers 214 (2019) 142–151
C. Menzel, et al.
Minneapolis, USA). Starch films of 50 cm2 were placed into the equipment at 25 °C and 53% RH. Oxygen permeability was calculated by
multiplying oxygen transmission rate and the average film thickness of
the starch film determined at five points. The measurement was done in
duplicate.
left stirring overnight to completely dissolution. An aliquot of 0.5 ml
was precipitated with 2.5 ml EtOH and centrifuged. The supernatant
was discarded before the pellet was dissolved in 4.5 ml water in a
boiling water bath for 15 min. To the cool dispersion 0.5 ml of 0.1 N
acetate buffer, 10 μl of 100 ppm sodium azide solution and 25 μl of
isoamylase (EC 3.2.1.68, Megazyme, 100 U/ml). Samples were
incubated for 4 h at 37 °C and then starch was precipitated using
25 ml EtOH and centrifuged. The pellet was dissolved in DMSO/LiBr
0.5% (w/w) for 2 h at 80 °C before injection into the SEC system. Since
debranched starch molecules are linear chains, the molar mass equals
the hydrodynamic volume calculated from the DRI calibration curve
from pullulan standards and the degree of polymerization can be
calculated by dividing the molar mass by the mass of the
anhydroglucose unit (162 Da).
2.3.8. Thermal analysis of starch films
Thermal properties of the starch films were measured using differential scanning calorimetry (DSC 1 StareSystem, Mettler-Toledo, Inc.,
Switzerland) and thermogravimetric analyzer (TGA/SDTA 851e,
Mettler Toledo, Schwarzenbach, Switzerland). Samples were conditioned for 1 week at 0% RH before analysis. DSC curves were obtained
by heating the sample from 25 °C to 160 °C at 5 °C/min and holding for
5 min at 160 °C. Samples were then cooled to 10 °C and rested for 5 min
and a second heating cycle was performed to 160 °C at 10 °C/min. TGA
analysis was performed by heating the samples from 25 °C to 600 °C at a
heating rate of 10 °C/min. Thermal analysis were performed under a
nitrogen flow (10 ml/min). Both measurements were performed in triplicates.
2.3.3. Microstructure analysis of film cross-sections using FESEM
Field emission scanning electron microscope (FESEM) images of the
cross-section of all starch films were taken using a ZEISS ULTRA 55
model (Zeiss, Germany). The films were previously dehydrated at 0%
RH over phosphorous pentoxide and cryo-fractured using liquid nitrogen. The films were placed on graphite stickers and were gold
coated. Images were taken using an acceleration voltage of 1.5 kV.
2.3.9. In-vitro antioxidant activity of films using DPPH* assay
About 1 g of film was weighed into a 100 ml bottle and 50.0 ml
distilled water was added. The film was suspended in the water using a
roto-stator for about 1 min and afterwards stirred about 12 h at 200 rpm
at room temperature. An aliquot of the starch dispersion was filtered
using a 0.45 μm filter and used for the DPPH assay as described in the
2.2.3 Section. The measurement was carried out in triplicates.
2.3.4. Moisture content of starch films
Moisture content of films conditioned at 53% RH was measured
gravimetrically after drying at 60 °C for 48 h under vacuum and subsequent equilibration at 0% RH for 2 days at room temperature in
sealed chambers containing phosphorous pentoxide.
2.4. Statistical analysis
2.3.5. Optical properties of starch films: color and internal transmittance
The measurement of the optical properties of starch films equilibrated at 53% RH at 25 °C was carried out using a MINOLTA spectrocolorimeter (Model CM-3600d, Tokyo, Japan). The reflection spectra
(400–700 nm, 10 nm bandwidth, specular component included) of the
films backed on black and white plates were measured in triplicate at
three points of the same film sample. The internal transmittance was
measured by applying the Kubelka-Munk theory of the multiple dispersion of reflection spectrum using the reflection spectra of the white
and black backgrounds. The CIELab color coordinates (illuminant D65
and observer 10°) were obtained from the reflectance of an infinitely
thick layer of the material according to Hutchings (1999).
IBM SPSS Statistics 25.0.0 software has been used for analysis of
variance (ANOVA) and Tukey´s HSD post hoc test in case of equal replicates and Gabriel post hoc test for unequal amount of replicates. In
case of duplicates a simple t-test has been used for comparison.
3. Results and discussion
3.1. Extraction and characterization of phenolic compounds from sunflower
hulls
The milling process was initially studied to optimize the yield for
extraction of phenolic compounds using different milling fractions
(schematic Fig. 1, milled raw material, material < 0.6 mm and < 0.2
mm). The material has been shown to be very tough during milling,
requiring long time and several repetitions. In general, smaller particle
sizes resulted in higher extraction yields of phenolic compounds measured as total phenolic content. The highest values of 498 mg GAE/
100 g dry milled sunflower hulls were achieved using material < 0.2
mm, which represents 20% of the material from the first milling fraction. However, from a time-efficient and economical point of view,
around 90% of the raw material could be milled to < 0.6 mm within
two milling stages, which was used for all further analysis (red marked
in Fig. 1).
In a second step the extraction conditions have been optimized
using different solvent and time and were evaluated in terms of total
phenolic acid content (Table 1). Methanolic extracts showed better
yields in terms of total phenolic content and this solvent was selected to
obtain the active extracts used for preparing active starch films. Likewise, the final phenolic extract were obtained with 80% aqueous MeOH
at a hull:solvent ratio 1:10 under constant stirring for 30 min at room
temperature in order to reduce the solvent use. Longer times (1 h,
Table 1) and repetitive extraction up to three times (3x extraction,
Table 1) did not improve yields significantly and is not economically
viable, due to the great amount of extraction solvent used. Several
studies reported similar results between 190 up to 400 mg GAE/100 g
dry sunflower hulls using Folin reagent (De Leonardis et al., 2005;
2.3.6. Mechanical properties
Mechanical properties were determined in eight replicates using a
Universal testing machine (Stable Micro System TA, XT plus,
Haslemere, England) following the ASTM standard method
(D882.ASTM D882, 2001). The conditioned films (25 °C, 53% RH) were
cut into 25 mm × 80 mm pieces and mounted into the equipment with
a stretching of 50 mm/min. Stress at break, maximum elongation and
Young´s modulus were calculated from the stress-strain curves, based
on the average film thickness measured at six points.
2.3.7. Barrier properties
Water vapor permeability (WVP) was determined gravimetrically at
25 °C using a modification of the ASTM E96-95 gravimetric method
(1995) for hydrophilic films. Starch film samples were cut into circles of
ø3.5 cm and mounted into Payne permeability cups (Elcometer SPRL,
Hermelle/s Argenteau, Belgium) that were filled with 5 ml of distilled
water (100% RH). The cups were placed into pre-equilibrated cabinets
containing oversaturated solutions of magnesium nitrate (53% RH)
with a fan on the top of the cup. The cups were weighed periodically
(1.5 h–24 h) using an analytical balance with ± 0.00001 g accuracy.
The slope of the weight loss versus time was plotted and the water vapor
transmission rate (WVTR) and WVP were calculated using duplicates.
Oxygen permeability of starch films equilibrated at 53% RH was
measured using Ox-Tran equipment (MOCON Model 1/50,
145
Carbohydrate Polymers 214 (2019) 142–151
C. Menzel, et al.
phenolic acids. Since the methanolic extract was evaporated and freezedried before addition to starch films, EC50 value was also calculated
based on the dry extract yield of 6 wt%, resulting in EC50 values of
4.41 mg dry extract/mg DPPH* (Table 2).
Antibacterial activity against E.coli and Listeria innocua was determined. However, no clear MIC was detected at concentrations as
high as 100 mg extract/ml (Supplementary Fig. S2), which was in
contrast with previously reported data. Taha et al. (2012) studied the
antimicrobial activity of sunflower hull extract against five food borne
pathogenic bacteria (E. coli, Listeria monocytogenes, Bacillus cereus, Staphylococcus aureaus, Salmonella typhimurium) at a concentration of 5 mg
extract/ml using disc diffusion method and showing inhibition of
growth of E.coli of a similar 80% aqueous MeOH extract. It is important
to point out that in this study, there was a clear change in cell growth at
around 40 mg/ml for Listeria innocua and E. coli, represented by a spot
coloration rather than full coloration of the wells (Supplementary Fig.
S2). That might me be due to a bacteriostatic action of the extract
where cell growth inhibition occurred but no cell death. Further in vitro
and in vivo analysis on different food products should be carried out to
confirm the bacteriostatic or bactericidal action of the extract and its
potential as anti-bacterial agent in food packaging applications.
Table 1
Total phenolic content in mg GAE/100 g dry hulls using different extraction
solvent, times, repeated extractions, material particle size and hull:solvent
ratio.
Extraction
80% MeOH
30 min, 1x extraction, entire sample, 1:20 ratio
1 h, 1x extraction, < 0.6 mm, 1:20 ratio
30 min, 3x extraction, < 0.6 mm, 1:20 ratio
30 min, 1x extraction + washing filter, < 0.6 mm,
1:20 ratio
30 min, 1x extraction + washing filter, < 0.6 mm,
1:10 ratio
146
157
194
277
±
±
±
±
a
10
12a
9.0b
20c
80% EtOH
134
145
176
176
±
±
±
±
10a
10a
7.0b
17b
137 ± 20a
Superscript letters in each column: t-test (p < 0.05)
Taha, Wagdy, Hassanein, & Hamed, 2012).
The three main phenolic acids identified and quantified using HPLCDAD are summarized in Table 2 for the 30 min extraction at room
temperature using 80% aqueous MeOH extract and 80% aqueous EtOH
extract at a 1:10 solids:solvent ratio. In total 11 peaks were detected
(Supplementary Table S1): three peaks were assigned to be isomers of
caffeoylquinic acid and one was expected to be a dicaffeoylquinic acid
derivate (Chromatographic profile and chemical structure in Supplementary Fig. S1) and some peaks were unknown. The assignment of
phenolic acids was in accordance with Weisz, Kammerer, and Carle
(2009) using equivalent HPLC conditions.
Extraction with 80% aqueous MeOH resulted in the highest content
of the three identified phenolic acids with 82.3 mg/100 g dry sunflower
hulls. Differences between determinations using Folin reagent and
HPLC-DAD are explained since Folin determination is sensitive to other
reducing non-phenolic components such as sugars and amino acids that
interfere with that analysis (Georgé, Brat, Alter, & Amiot, 2005).
Chlorogenic acid was identified as the main phenolic compound with
95% and 93% in methanolic and ethanolic extracts, respectively,
showing that the extraction of different phenolic acids depends on the
extraction solvent. Weisz et al. (2009) and Szydłowska-Czerniak et al.
(2011) reported similar amounts (40–86 mg total phenols/100 g dry
hulls) of the total phenolic compounds of different sunflower hulls, with
chlorogenic acid as main component and minor amounts of coumaric
and ferulic acid derivates, mono-caffeoylquinic and dicaffeoylquinic
acid derivates.
The antioxidant capacity of the phenolic extracts were determined
using DPPH* assay and EC50 values were calculated as mg of dry sunflower hulls/mg DPPH* (Table 2). It was shown that 73.5 mg hulls are
necessary to reduce 50% of 1 mg of DPPH* when extracted with 80%
aqueous MeOH. The total phenolic content analyzed by Folin reagent
showed 137 mg GAE/100 g dry sunflower hulls consisting of predominantly chlorogenic acid besides caffeic acid and other phenolic
compounds. The EC50 values of pure chlorogenic acid and caffeic acid
are 0.151 and 0.083 mg/mg DPPH*, respectively. Considering 0.137%
of the dried sunflower hulls are phenolic compounds and EC50 value of
the hulls are 73.5 mg/mg DPPH, we can expressed the EC50 as 0.101 mg
of total phenolic compounds/mg DPPH* (0.137% times EC50 value of
73.5mg /mg DPPH*), which is consistent with the values for the pure
3.2. Preparation and evaluation of starch films with antioxidant extract
3.2.1. Changes in molecular structure of starch determined as molecular
weight distributions and branch chain-length distribution using size-exclusion
chromatography
The changes in molecular structure of starch caused by thermal
processing were monitored for the starch films in comparison with
native starch, in terms of the molar mass distribution of the starch
macromolecules and the branch chain-length distribution after debranching with isoamylase (Fig. 3, Table 3). The starting native potato
starch exhibited a bimodal size distribution (Fig. 3a) corresponding to
the distinct amylopectin (Rh ˜ 20–100 nm) and amylose (Rh ˜ 1–20 nm)
population, with a weight-average molecular weight M¯w of 9.1 × 10⁶
Da (Table 3).
The thermal processing of the starch films resulted in a monomodal
size distribution together with a shift of the size distribution to smaller
sizes where no distinct contributions of the amylopectin and amylose
molecules where further detected. This was correlated with a noticeable
decrease in the weight-average molar mass M¯w (Rh) obtained from the
MALLS detector for all processed samples, associated with the degradation processes induced during the thermal-shear processing
(Table 3). In addition, the reduction in the amounts of glycerol (CS_10G
to CS_7G) resulted in a further decrease of the molar mass and size
distribution of starch films; starch films with added AOE showed the
same trend. It is well known that starch is susceptible to shear-induced
and thermal breakdown while an increasing amount of glycerol protected against starch degradation during processing of films (Carvalho,
Zambon, Curvelo, & Gandini, 2003). In addition, Liu, Halley, and
Gilbert (2010) reported a similar trend of starch chain scission and shift
towards monomodal weight distribution of starch after extrusion attributed to amylopectin being highly susceptible to shear degradation.
In order to further study the effect of thermal-mechanical
Table 2
HPLC results of individual phenolic acid content at 325 nm and EC50 values from DPPH* assay of aqueous MeOH and EtOH sunflower hull extracts from < 0.6 mm
material, extracted 30 min at room temperature at 1:10 hull:solvent ratio and washed filter.
Extraction
Phenolic acid [mg/100 g dry hulls]
Chlorogenic acid
80% aqueous MeOH
80% aqueous EtOH
a
78.3 ± 16.2
57.3 ± 1.22a
EC50 values [mg/mg DPPH*]
Caffeic acid
a
1.4 ± 0.26
1.0 ± 0.02a
Dicaffeoyl-quinic acid
a
2.6 ± 0.57
3.3 ± 0.02a
< 0.6 mm material
a
73.5 ± 12.6
88.7 ± 9.72a
Freeze-dried extract
4.41*
4.43*
* Freeze-dried extract for 80% aqueous MeOH was 6 wt% of the dry raw material, 5 wt% for 80% aqueous EtOH, Superscript letters in each column: t-test
(p < 0.05).
146
Carbohydrate Polymers 214 (2019) 142–151
C. Menzel, et al.
Table 3
Sample abbreviation and composition of starch-glycerol films with and without antioxidant extract (AOE). Number-average molecular weight M¯n , weight-average
molecular weight M¯w and polydispersity D for branched starches using light scattering and peak maximum of degree of polymerization XDP in the three regions of
debranched samples and height ratio of AP2/AP1 (AP-amylopectin, AM-amylose) using the DRI calibration.
Sample
Composition [g]
Branched Starch
Debranched Starch
Abbreviation
starch
Gly
AOE
M¯w [MDa]
M¯n [MDa]
D
XDP, AP1
XDP, AP 2
AP2/AP1
XDP, AM
Native starch
CS_7G
CS_10G
SS_9.5G_0.5A
SS_9G_1A
SS_8G_2A
SS_7G_3A
40
40
40
40
40
40
7
10
9.5
9
8
7
–
–
0.5
1
2
3
9.10
1.03
3.57
1.67
2.45
1.88
1.29
8.07
0.61
2.36
1.34
1.81
1.18
0.69
1.13
1.70
1.36
1.24
1.35
1.59
1.85
26
24
24
25
27
24
28
48
46
50
49
49
49
49
1.07
0.94
0.93
1.00
1.06
0.95
1.04
7475
464
1240
996
920
693
497
transparency, whereas low values of Ti are typical for more opaque or
colored films. The control starch film exhibited high values of Ti at
entire wavelength range which reflected the high level of film transparency. Films containing AOE showed a decrease in Ti at low wavelength associated with the selective absorption of the AOE compounds.
The higher the AOE concentration, the lower the Ti values and more
colored films.
Color parameters L*, a*, b* (Supplementary Table S1) revealed the
effect of AOE on the film color. The films appeared more yellowishbrownish with increasing amount of AOE. Lightness L* was highest for
the control films plasticized with glycerol and an increase in the AOE
amount decreased lightness. The color coordinate a* increased with the
content of AOE wile parameter b* slightly decreases representing a
change towards more reddish color as the AOE concentration rose.
Corrales, Han, and Tauscher (2009) have shown similar orangebrownish color formation in pea starch films with added grape seed
extracts, due to the presence of phenolic acids and flavonoids.
Although transparency of packaging material is a valuable parameter, color formation in the films can be of advantage as consumer
perception might be attracted to these kinds of colors in packaging,
especially for products such as chocolate or nuts, at the same time that
the films could better protect the products against negative effects of
light.
degradation during processing on the amylopectin and amylose populations, the branch chain-length distribution for the intact starch and
the films were evaluated after enzymatic debranching. The branch
chain-length distribution of starch showed two distinctive peaks
(Fig. 3b): one bimodal amylopectin peak < 100 DP ( XDP, AP ) and one
amylose peak > 100 DP ( XDP, AM ). The peak maxima are summarized in
Table 3. The bimodal distribution of the amylopectin peak is associated
to the amylopectin branching pattern into defined clusters with singlelamellar branches (AP1 with XDP, AP1 ˜5 to 35) and lamella-spanning
branches (AP2 with XDP, AP 2 ˜35 to 100) (Vilaplana & Gilbert, 2010;
Vilaplana, Meng, Hasjim, & Gilbert, 2014; Wang & Wang, 2001).
A clear shift in the peak of the long-chain amylose fraction was
observed for all starch films compared to the native starch ( XDP, AM in
Fig. 3b and Table 3), thus indicating that also the long-branch fractions
were sensitive to hydrolytic cleavage during processing. Wang and
Wang (2001) reported similar patterns in acid thinned potato starch
with a decrease of long-chain molecules of amylose in debranched
starches and a shift of the amylose fraction to lower chain-length. The
relatively constant peak height ratio (AP2/AP1 in Table 3) showed that
the branching pattern of debranched amylopectin was not significantly
altered indicating that molecules were randomly broken. The same
trend was reported by Liu et al. (2010) who investigated the effect of
extrusion on starch degradation. These authors reported that debranched samples showed no significant change in the shape of the
branch chain-length distribution after extrusion and attributed this to a
non-selective breaking of glyosidic bonds within the branches. It can be
assumed that mainly branching points were cleaved which would preserve the distribution of individual branch lengths. There was only a
slight decrease in AP2/AP1 height ratio of starch films compared to the
native starch which indicated that the long branches (AP2) were more
sensitive to thermal degradation than the shorter branches in the
amylopectin population AP1.
In summary, our study demonstrated that both amylose and amylopectin fractions were affected by the thermo-mechanical degradation,
as evidenced by the decrease in the weight-average molecular weight
M¯w and size distribution of the starch macromolecules and the evident
changes in the long-chain amylose fraction of debranched samples.
3.2.4. Thermal behavior of the films
Thermal gravimetric analysis was used to determine the thermal
decomposition and stability of the dry starch films. The results of the
TGA curves and their first derivative are shown in Fig. 4a (numerical
data in Table 4). The small mass loss below 100 °C can be mainly ascribed to unbounded water loss. The following mass loss till the onset
temperature of the thermal decomposition at around 250 °C can be
related to the evaporation/decomposition of both the glycerol and
bonded water in starch films. Starch thermal decomposition occurred
between 250 °C and 300 °C, without remarkable differences between
samples, although starch films with high amount of AOE showed a
slight shift towards lower degradation temperature (Fig. 4a). However,
starch films with AOE had a lower weight loss up to 300 °C, thus suggesting the presence of little amounts of ash content in the extracts.
The glass transition temperature Tg is an important parameter at
determining the mechanical properties of amorphous polymers
(Biliaderis, Page, Maurice, & Juliano, 1986). Often, it is desirable to
decrease Tg just below ambient temperature and obtain supple and
deformable rubbery materials. The Tg of completely dried films were
determined using DSC for the purposes of analyzing the potential
plasticizing effect of the AOE. The onset and midpoint are shown in
Table 4 (curves in Fig. 4b). For the AOE-free samples the increase in the
glycerol content provoked the expected decrease in the Tg (Chang, Abd
Karim, & Seow, 2006; Forssell, Mikkilä, Moates, & Parker, 1997).
However, the different degrees of partial substitution of glycerol by
AOE in the films did not provoke significant changes in the Tg values. In
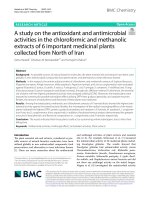
3.2.2. Starch film microstructure
The resulting starch films produced by compression molding had a
thickness between 181 μm and 216 μm. Images of the film cross-sections using FESEM are shown in Fig. 2. The films showed smooth surfaces and no cracks, no pores or phase separations. The phenolic extract
was successfully integrated into the starch-glycerol matrix.
3.2.3. Optical properties of the films
The optical properties of the films were measured to evaluate their
color and transparency (Hutchings, 1999). The internal transmittance
(Ti) spectra are shown in the Supplementary (Supplementary Fig. S3).
High values of Ti correspond to films with great homogeneity and hence
147
Carbohydrate Polymers 214 (2019) 142–151
C. Menzel, et al.
Fig. 2. FESEM images of cross sections of starch films with a) 0.5 g antioxidant extract (AOE) (SS_9.5G_0.5A), b) with 1 g AOE (SS_9G_1A), c) with 2 g AOE
(SS_8G_2A), d) with 3 g AOE (SS_7G_3A) and e) without AOE (CS_7 G). Digital images of films are displayed in the upper right corner.
fact, control films without AOE with the minimum amount of glycerol
(CS_7 G) exhibited closer Tg values to that AOE containing films than
control film with the maximum glycerol content. Likewise, this transition was more extended in films with AOE. This suggests that the interaction of AOE compounds with the starch chains induced restrictions
in the molecular mobility in the amorphous phase, interfering the
glycerol plasticizing effect. Nevertheless, the greater level of starch depolymerization when the glycerol content decreased would also contribute to the Tg values in the different matrices.
bond interactions between starch chains and the AOE phenolic acids,
contributing to the film cohesiveness and low flexibility. These kind of
interactions were intensified in the films containing the highest levels of
glycerol substitution, resulting in changes in their tensile behavior. The
stress-strain curves of these films showed a linear region until a higher
strain, with a fivefold to tenfold higher Young´s modulus, which indicated greater film rigidity. However, these films exhibited low values
of elongation at break (1.23% and 4.23%, respectively) being less extensible and more brittle.
As concerns tensile behavior, although almost constant Tg values
were obtained for the dry matrices with different degree of glycerol
substitution, their differences in the film water affinity could also affect
the mechanical response. The equilibrium moisture content of the films
(Table 4) became lower when the glycerol content decreased. This
lower amount of water content could also contribute to the increase in
the film Young´s modulus when the AOE content rose, since water has a
strong plasticizing effect (Slade & Levine, 1994). In addition, the different degree of starch degradation (see molecular weight results
above) in the different films could affect their mechanical properties
but this effect could be overlapped with the plasticizing effect of glycerol or the effect of added phenolic extract.
3.2.5. Mechanical properties
Mechanical properties of all films were measured and the obtained
stress-strain curves (Fig. 5) were used to determine Young´s modulus,
tensile strength and elongation at break (Table 4). Starch films without
or with low amounts of AOE showed a typical elastic behavior in the
initial region where the low Young´s modulus was determined and
when the yield point was reached plastic flow started until the film
ruptured. The elongation at break for glycerol-starch films without AOE
was 26.0% and 25.3% with a tensile strength of 4.31 MPa and
5.36 MPa, for the highest and lowest amount of glycerol, respectively.
Glycerol is a well-known plasticizer that increases the mobility of the
polymer chains and makes the films more extensible (Myllärinen,
Partanen, Seppälä, & Forssell, 2002).
The glycerol substitution by AOE at the two lowest levels showed
similar behavior as AOE-free films, but exhibited a twofold and fivefold
increase in tensile strength. This could be attributed to the hydrogen
3.2.6. Barrier properties
Oxygen permeability (OP) values are shown in Table 4. Control
films showed the susceptibility of starch as barrier to the glycerol
content as lower content of glycerol decreased OP values. Similar
148
Carbohydrate Polymers 214 (2019) 142–151
C. Menzel, et al.
Fig. 3. a) SEC weight distribution and weight-average molecular weight M¯w as
function of hydrodynamic radius Rh for native potato starch and starch films
dissolved in DMSO/LiBr 0.5% and b) SEC weight distribution of debranched
starches as function of their degree of polymerization (DP).
effects of glycerol content has been shown previously on compression
molded films of starch (Arvanitoyannis, Psomiadou, & Nakayama,
1996). The glycerol substitution by the phenolic extract into the films
slightly increased OP values at the lowest substitution level, however,
the oxygen barrier capacity increased as the phenolic extract concentration rose. This improvement of the oxygen barrier capacity could
linked to the decrease of glycerol content in the film and hence the
formation of a more tightly packed network structure with reduced
molecular mobility (Arvanitoyannis et al., 1996).
Water vapor permeability –results are shown in Table 4. Films with
the lowest substitution of glycerol by the phenolic extract
(SS_9.5G_0.5A) resulted in a slight increase of WVP values, but a subsequent decrease occurred when concentration of phenolic extract rose.
The lower WVP values could be explained by the lower amount of
glycerol in the films as seen for the control films but also to the interactions between the compounds of the antioxidant extract and starch
which might lead to a lower affinity of the starch films with water
molecules, as reveals the decrease of the equilibrium moisture content.
That is in accordance with previous results where water vapor transfer
rate has been shown to be proportional to total plasticizer content
(polyols and water) within the polymer matrix (Arvanitoyannis et al.,
1996).
Fig. 4. a) TGA curves and first derivative of starch films with and without AOE
and b) DSC curves of all starch films.
during the film preparation. Similar amounts were reported by Pastor,
Sánchez-González, Chiralt, Cháfer, and González-Martínez (2013) incorporating resveratrol as antioxidant into chitosan and methylcellulose films and reported EC50 values of about 50 mg film/mg DPPH*
using 5% of antioxidant in the films which is in the same range as the
films produced in this study with 6% as the highest amount of phenolic
extract added (SS_7G_3A) and an EC50 value of 71 mg films/mg DPPH*.
Nevertheless, in this study the films were dispersed into water and
DPPH* activity of the water solution was measured. The antioxidant
effect will have to be further evaluated in food contact applications
monitoring changes during storage and release of the phenolic compounds into the product since the activity of the antioxidant extract in
the films would become more relevant in wet systems and direct contact
with a food product (Bonilla, Atarés, Vargas, & Chiralt, 2012).
3.2.7. In-vitro antioxidant activity of films using DPPH* assay
An increased addition of the phenolic extract to the starch film resulted in lower EC50 values which in turn proved higher antiradical
activity of these films (Table 4). Based on the added amount of phenolic
extract (1, 2, 4 and 6% based on starch-glycerol formulation) multiplied
with the EC50 values from the prepared films offers an estimation of
extract needed to reduce 50% of one mg DPPH*: 3.18 mg, 4.22 mg
4.88 mg and 4.26 mg which is accordance with the EC50 value of the
methanolic extract reported above of 4.41 mg extract/mg DPPH*
(Table 2). Hence, no antiradical activity of the phenolic extract was lost
4. Conclusions
This study shows the potential use of utilizing sunflower hulls as a
valuable source of a natural antioxidant extract. The extraction was
shown to be fast and easy using 80% aqueous MeOH. Chlorogenic acid
was identified as the main active compound with expected antiradical
activity against DPPH*. Different amounts of the phenolic extract,
1–6 wt% based on the starch-glycerol formulation for films, were successfully incorporated into compression-molded films preserving their
antiradical activity against DPPH*. The incorporation of up to 6%
149
Carbohydrate Polymers 214 (2019) 142–151
0.5
0.5b
0.5c
0.5b,c
0.9a
1.4a
±
±
±
±
±
±
285
284
287
286
281
281
0.03
0.12d
0.02c
0.09b
0.12b
0.40a
0.216
0.188b
0.198a
0.198a,b
0.181a,b
0.182b
7.17
12.7
9.28
8.67
8.28
7.57
±
±
±
±
±
±
a
CS_7G
CS_10G
SS_9.5G_0.5A
SS_9G_1A
SS_8G_2A
SS_7G_3A
c
%
[μm]
[g]
* Thickness – average of 48 replicates and Tukey’s HSD post hoc test, moisture content – average of 3 replicates and Tukey’s HSD post hoc test, TGA DPPH – average of 3 replicates and Tukey’s HSD post hoc test, OP
and WVP – average of duplicates, tensile testing – average of 6–8 replicates using Gabriel post hoc test, Tg – average of duplicates and t-test (p < 0.05).
79 ± 20a
55 ± 20a
245 ± 26b
223 ± 46b
441 ± 134c
580 ± 107d
0.93
1.11a
0.84c
0.70b,c
1.54c
1.68a,b
±
±
±
±
±
±
5.36
4.73
7.90
7.43
8.24
5.56
3.94
5.95c
2.80b
4.32b
3.82a
0.68a
±
±
±
±
±
±
25.3
26.0
14.8
13.8
4.23
1.23
0.88
0.14
0.40
0.78
1.90
0.22
±
±
±
±
±
±
7.62
11.5
15.1
12.2
9.95
8.22
0.26
0.65
0.12
0.11
0.33
0.30
±
±
±
±
±
±
1.63
6.37
8.05
6.80
4.36
3.20
n.d
n.d
318 ± 0.8d
211 ± 0.8c
122 ± 9.6b
71.3 ± 3.1a
117 ± 10
70 ± 7a
105 ± 3b
98 ± 8b
92 ± 9a,b
105 ± 13b
100 ± 2
54 ± 8a
100 ± 10b
83 ± 10a,b
81 ± 8b
94 ± 15b
Tensile strength [MPa]
a
c
b
Elongation [%]
[°C]
TGA peak
Moisture*
Thickness*
Starch
Table 4
Physical properties of starch films with phenolic extract.
b,c
b
gmm/kPahm2
1014(cm3/msPa)
[mg film/mg DPPH]
Onset [°C]
Midpoint [°C]
OP
EC50
Tg
WVP
Mechanical properties
Young´s modulus
C. Menzel, et al.
Fig. 5. Stress-strain curve of starch films with glycerol and different amounts of
antioxidant extract.
active compound generated less stretchable and stiffer films. The
change in mechanical properties was mainly attributed to the interactions of the phenolic compounds with the starch polymer. All films
showed very good oxygen barrier properties and improved water vapor
barrier properties. Main changes in barrier properties can be attributed
to the reduction of glycerol as it was partially replaced by the phenolic
extract from sunflower hulls, and the associated difference in the
equilibrium water content in the films. Especially, the excellent barrier
of starch against oxygen was retained, which is comparable to ethylene
vinyl alcohol (EVOH) commonly used in food packaging for its oxygen
barrier properties.
The films developed an increased yellow-brownish color with
higher amount of extract but kept their transparency. The heat-shear
treatment during melt blending and compression molding process induced a reduction in the molecular weight of starch affecting both the
amylose and amylopectin populations. However, higher amounts of
glycerol slightly prevented starch degradation. The starch films showed
good thermal stability until 250 °C and a glass transition at 80–100 °C
depending on the glycerol content, whereas the incorporation of the
phenolic extract showed little influence on the thermal behavior of the
films.
The study demonstrates the potential use of agricultural by-products
to be re-utilized as raw material to produce 100% renewable and recyclable active food packaging material or coatings by compressionmolding. The application of the developed active starch films with
phenolic extracts from sunflower hulls in direct contact with foodstuff
will be further examined.
Acknowledgements
This work was supported by the Swedish Research Council Formas
[2015-00550] and by the project AGL2016-76699-R from Spanish
Ministerio de Educación y Ciencia. The authors would like to acknowledge Grefusa (Alzira, Spain) for the donated sunflower hull
waste.
Appendix A. Supplementary data
Supplementary material related to this article can be found, in the
online version, at doi: />References
Arvanitoyannis, I., Psomiadou, E., & Nakayama, A. (1996). Edible films made from sodium casemate, starches, sugars or glycerol. Part 1. Carbohydrate Polymers, 31(4),
179–192.
Biliaderis, C. G., Page, C. M., Maurice, T. J., & Juliano, B. O. (1986). Thermal characterization of rice starches: A polymeric approach to phase transitions of granular
starch. Journal of Agricultural and Food Chemistry, 34(1), 6–14.
Bonilla, J., Atarés, L., Vargas, M., & Chiralt, A. (2012). Edible films and coatings to
150
Carbohydrate Polymers 214 (2019) 142–151
C. Menzel, et al.
films: A review. Food and Bioprocess Technology, 5(6), 2058–2076.
Laohakunjit, N., & Noomhorm, A. (2004). Effect of plasticizers on mechanical and barrier
properties of rice starch film. Starch‐Stärke, 56(8), 348–356.
Liu, W.-C., Halley, P. J., & Gilbert, R. G. (2010). Mechanism of degradation of starch, a
highly branched polymer, during extrusion. Macromolecules, 43(6), 2855–2864.
Myllärinen, P., Partanen, R., Seppälä, J., & Forssell, P. (2002). Effect of glycerol on behaviour of amylose and amylopectin films. Carbohydrate Polymers, 50(4), 355–361.
Oriani, V. B., Molina, G., Chiumarelli, M., Pastore, G. M., & Hubinger, M. D. (2014).
Properties of cassava starch‐based edible coating containing essential oils. Journal of
Food Science, 79(2), E189–E194.
Pastor, C., Sánchez-González, L., Chiralt, A., Cháfer, M., & González-Martínez, C. (2013).
Physical and antioxidant properties of chitosan and methylcellulose based films
containing resveratrol. Food Hydrocolloids, 30(1), 272–280.
Slade, L., & Levine, H. (1994). Water and the glass transition — Dependence of the glass
transition on composition and chemical structure: Special implications for flour
functionality in cookie baking. In P. Fito, A. Mulet, & B. McKenna (Eds.). Water in
foods (pp. 143–188). Amsterdam: Pergamon.
Szydłowska-Czerniak, A., Trokowski, K., & Szłyk, E. (2011). Optimization of extraction
conditions of antioxidants from sunflower shells (Helianthus annuus L.) before and
after enzymatic treatment. Industrial Crops and Products, 33(1), 123–131.
Taha, F. S., Wagdy, S. M., Hassanein, M. M. M., & Hamed, S. F. (2012). Evaluation of the
biological activity of sunflower hull extracts. Grasas y Aceites, 63(2), 184–192.
Tester, R. F., Karkalas, J., & Qi, X. (2004). Starch—Composition, fine structure and architecture. Journal of Cereal Science, 39(2), 151–165.
Valdés, A., Mellinas, A. C., Ramos, M., Garrigós, M. C., & Jiménez, A. (2014). Natural
additives and agricultural wastes in biopolymer formulations for food packaging.
Frontiers in Chemistry, 2, 6.
Velioglu, Y. S., Mazza, G., Gao, L., & Oomah, B. D. (1998). Antioxidant activity and total
phenolics in selected fruits, vegetables, and grain products. Journal of Agricultural and
Food Chemistry, 46(10), 4113–4117.
Versino, F., Lopez, O. V., Garcia, M. A., & Zaritzky, N. E. (2016). Starch-based films and
food coatings: An overview. Starch - Stärke, 68(11–12), 1026–1037.
Vilaplana, F., & Gilbert, R. G. (2010). Two-dimensional size/branch length distributions
of a branched polymer. Macromolecules, 43(17), 7321–7329.
Vilaplana, F., Hasjim, J., & Gilbert, R. G. (2012). Amylose content in starches: Toward
optimal definition and validating experimental methods. Carbohydrate Polymers,
88(1), 103–111.
Vilaplana, F., Meng, D., Hasjim, J., & Gilbert, R. G. (2014). Two-dimensional macromolecular distributions reveal detailed architectural features in high-amylose starches. Carbohydrate Polymers, 113, 539–551.
Wang, L., & Wang, Y. J. (2001). Structures and physicochemical properties of acid‐thinned corn, potato and rice starches. Starch‐Stärke, 53(11), 570–576.
Weisz, G. M., Kammerer, D. R., & Carle, R. (2009). Identification and quantification of
phenolic compounds from sunflower (Helianthus annuus L.) kernels and shells by
HPLC-DAD/ESI-MSn. Food Chemistry, 115(2), 758–765.
prevent the detrimental effect of oxygen on food quality: Possibilities and limitations.
Journal of Food Engineering, 110(2), 208–213.
Bonilla, J., Talón, E., Atarés, L., Vargas, M., & Chiralt, A. (2013). Effect of the incorporation of antioxidants on physicochemical and antioxidant properties of wheat
starch–chitosan films. Journal of Food Engineering, 118(3), 271–278.
Brand-Williams, W., Cuvelier, M. E., & Berset, C. (1995). Use of a free radical method to
evaluate antioxidant activity. LWT - Food Science and Technology, 28(1), 25–30.
Cancalon, P. (1971). Chemical composition of sunflower seed hulls. Journal of the
American Oil Chemists’ Society, 48(10), 629.
Carvalho, A. J. F., Zambon, M. D., Curvelo, A. A. S., & Gandini, A. (2003). Size exclusion
chromatography characterization of thermoplastic starch composites 1. Influence of
plasticizer and fibre content. Polymer Degradation and Stability, 79(1), 133–138.
Chang, Y. P., Abd Karim, A., & Seow, C. C. (2006). Interactive plasticizing–antiplasticizing
effects of water and glycerol on the tensile properties of tapioca starch films. Food
Hydrocolloids, 20(1), 1–8.
Corrales, M., Han, H. J., & Tauscher, B. (2009). Antimicrobial properties of grape seed
extracts and their effectiveness after incorporation into pea starch films. International
Journal of Food Science & Technology, 44(2), 425–433.
Dainelli, D., Gontard, N., Spyropoulos, D., Zondervan-van den Beuken, E., & Tobback, P.
(2008). Active and intelligent food packaging: Legal aspects and safety concerns.
Trends in Food Science & Technology, 19, S103–S112.
De Leonardis, A., Macciola, V., & Di Domenico, N. (2005). A first pilot study to produce a
food antioxidant from sunflower seed shells (Helianthus annuus). European Journal of
Lipid Science and Technology, 107(4), 220–227.
FAOSTAT, FAO Statistics Division, 2016; Available from: />en/#data/QC.
Forssell, P. M., Mikkilä, J. M., Moates, G. K., & Parker, R. (1997). Phase and glass transition behaviour of concentrated barley starch-glycerol-water mixtures, a model for
thermoplastic starch. Carbohydrate Polymers, 34(4), 275–282.
Forssell, P., Lahtinen, R., Lahelin, M., & Myllärinen, P. (2002). Oxygen permeability of
amylose and amylopectin films. Carbohydrate Polymers, 47(2), 125–129.
Fox, G. J. (2000). Natural red sunflower anthocyanin colorant with naturally stabilized
color qualities, and the process of making. Google Patents.
Georgé, S., Brat, P., Alter, P., & Amiot, M. J. (2005). Rapid determination of polyphenols
and vitamin C in plant-derived products. Journal of Agricultural and Food Chemistry,
53(5), 1370–1373.
Ghasemlou, M., Aliheidari, N., Fahmi, R., Shojaee-Aliabadi, S., Keshavarz, B., Cran, M. J.,
et al. (2013). Physical, mechanical and barrier properties of corn starch films incorporated with plant essential oils. Carbohydrate Polymers, 98(1), 1117–1126.
Houdkova, M., Rondevaldova, J., Doskocil, I., & Kokoska, L. (2017). Evaluation of antibacterial potential and toxicity of plant volatile compounds using new broth microdilution volatilization method and modified MTT assay. Fitoterapia, 118, 56–62.
Hutchings, J. B. (1999). Instrumental specification. Food colour and appearance.
Springer199–237.
Jiménez, A., Fabra, M. J., Talens, P., & Chiralt, A. (2012). Edible and biodegradable starch
151