Complexation of chitosan with gum Arabic, sodium alginate and κ-carrageenan: Effects of pH, polymer ratio and salt concentration
Bạn đang xem bản rút gọn của tài liệu. Xem và tải ngay bản đầy đủ của tài liệu tại đây (5.46 MB, 11 trang )
Carbohydrate Polymers 223 (2019) 115120
Contents lists available at ScienceDirect
Carbohydrate Polymers
journal homepage: www.elsevier.com/locate/carbpol
Complexation of chitosan with gum Arabic, sodium alginate and
κ-carrageenan: Effects of pH, polymer ratio and salt concentration
T
Renata S. Rabelo , Guilherme M. Tavares, Ana S. Prata, Miriam D. Hubinger
⁎
School of Food Engineering, University of Campinas (UNICAMP), 80, Monteiro Lobato Street, ZIP 13083-862, Campinas, SP, Brazil
ARTICLE INFO
ABSTRACT
Keywords:
Associative phase separation
Complex coacervation
Electrostatic complexes
Isothermal titration calorimetry
The effects of pH, ionic strength and polymer ratio in the complexation of chitosan (CHI) with different anionic
polysaccharides, namely gum Arabic (GA), sodium alginate (ALG) and κ-carrageenan (CRG), were investigated.
This was made using titration techniques, which allowed the determination of stoichiometry and binding constant of complexes. The sulfated polysaccharide interacted more strongly with CHI than carboxylated polysaccharides. The increase of ionic strength (0–100 mM NaCl) in the polysaccharides complexation resulted in a
significant reduction in the binding constant of GA:CHI and CRG:CHI, but did not influence the complexation of
ALG with CHI. The pH and polymer ratio affected the formation and solubility of complexes GA:CHI, while for
ALG:CHI and CRG:CHI, insoluble complexes were observed in all pH and polymer ratio evaluated. A phase
transition of coacervate to gel was proposed to ALG:CHI and CRG:CHI, which can be related to the self-association of anionic polymers, when these are in excess.
1. Introduction
Chitosan (CHI), a linear cationic copolymer of β(1–4) linked Nacetyl glucosamine and D-glucosamine, is the deacetylated form of
chitin, the second most abundant polysaccharide in nature (P.M., 2014;
Wang et al., 2018). The free amino group in the D-glucosamine unit of
CHI is an important characteristic that is reflected in physical (e.g.
solubility), chemical (e.g. reactivity with other functional groups due to
their cationic charge at lower pH values), and biological (e.g. antimicrobial and antioxidant activity) properties of this polymer, and
makes it unique among polysaccharides (Luo & Wang, 2014; Rocha,
Coimbra, & Nunes, 2017; Verlee, Mincke, & Stevens, 2017).
The CHI was approved as GRAS (Generally Recognized as Safe) by
the Food and Drug Administration to be used as an additive in the food
industry in the year 2012 (FDA (Food & Drug Administration), 2012),
and has been evaluated for clarification of beverages and encapsulation
of active compounds due to cationic behavior (Alishahi et al., 2011;
Cesar et al., 2012; Domingues, Faria Junior, Silva, Cardoso, & Reis,
2012; Tastan & Baysal, 2015). The CHI has also been used as a natural
preservative in beverages and in formulation of active packaging due to
their antimicrobial and antioxidant properties (Ferreira, Nunes, Castro,
Ferreira, & Coimbra, 2014; Higueras, López-Carballo, Gavara, &
Hernández-Moz, 2015). Nevertheless, its potential to strongly
interact with components present in the food matrices has limited its
use in the food and beverage industries (Rocha et al., 2017).
The complexation of CHI with anionic polysaccharides may have a
synergic effect, improving the properties of isolated polymer and enabling the use of CHI in numerous applications in the food industry,
including delivery of active compounds (Chapeau et al., 2017;
Magalhães et al., 2016; Xiong et al., 2016), packaging materials
(Lindhoud, de Vries, Schweins, Cohen Stuart, & Norde, 2009), formation of fully reversible gels (Lemmers, Sprakel, Voets, van der Gucht, &
Cohen Stuart, 2010), fat replacer (Laneuville, Paquin, & Turgeon, 2005)
and edible films (Eghbal et al., 2016). Such applications are most often
made with protein-based complexes or protein blends with anionic
polysaccharides. But, given the biological functionalities of CHI, their
complexes with anionic polysaccharides may be interesting to application in the food industry as antimicrobial or antioxidant agent
(Bharmoria, Singh, & Kumar, 2013; Luo & Wang, 2014; Rocha et al.,
2017).
The investigation of molecular interactions in complexes formed by
polysaccharides is challenging because compared with the protein unit
(amino acid), the structure of monosaccharide shows the existence of
isomers; variable ways of inter-connection and the regularity of the
monosaccharides is still little known (2017, McClements, Decker, Park,
& Weiss, 2009; McClements, 2016). That intrinsic factor, as well the
Corresponding author.
E-mail addresses: (R.S. Rabelo), (G.M. Tavares), (A.S. Prata),
(M.D. Hubinger).
⁎
/>Received 7 March 2019; Received in revised form 17 July 2019; Accepted 21 July 2019
Available online 23 July 2019
0144-8617/ © 2019 Elsevier Ltd. All rights reserved.
Carbohydrate Polymers 223 (2019) 115120
R.S. Rabelo, et al.
extrinsic factors (pH, ionic strength, temperature) influences the complexation of oppositely charged polyelectrolytes because they are associated with the intricate balance of molecular interactions that invariably leads to the spontaneous formation of soluble complexes, or to
phase separation, either liquid-liquid (complex coacervation) or liquidsolid (precipitation) (Chollakup, Beck, Dirnberger, Tirrell, & Eisenbach,
2013; Comert, Malanowski, Azarikia, & Dubin, 2016; de Kruif,
Weinbreck, & de Vries, 2004; Kizilay, Kayitmazer, & Dubin, 2011;
Turgeon & Laneuville, 2009; Weinbreck, Nieuwenhuijse, Robijn, & de
Kruif, 2003).
The liquid-liquid phase separation, also known as complex coacervation, is the mechanism associated with phase separation in complexes of CHI and gum Arabic (GA) (Espinosa-Andrews, Báez-González,
Cruz-Sosa, & Vernon-Carter, 2007; Espinosa-Andrews, SandovalCastilla, Vázquez-Torres, Vernon-Carter, & Lobato-Calleros, 2010;
Espinosa-Andrews et al., 2013; Roldan-Cruz, Carmona-Ascencio,
Vernon-Carter, & Alvarez-Ramirez, 2016). Complexes of CHI with sodium alginate (ALG) (Becherán-Marón, Peniche, & Argüelles-Monal,
2004; Kulig, Zimoch-Korzycka, Jarmoluk, & Marycz, 2016; Sæther,
Holme, Maurstad, Smidsrød, & Stokke, 2008) or κ-carrageenan (CRG)
(Volod’ko, Davydova, Barabanova, Soloveva, & Ermak, 2012; Volod’ko,
Davydova, Glazunov, Likhatskaya, & Yermak, 2016) are usually mentioned in the literature only as polyelectrolyte complexes (which may
be soluble or insoluble complexes). The difficulty in discerning the kind
of phase separation, determining the charge stoichiometry of the system
or identifying the molecular interactions that occurs in the phase separation is related to limitations of the techniques used (Priftis, Megley,
Laugel, & Tirrell, 2013), difficulty in distinguishing between sequential
or simultaneous phenomena (Comert et al., 2016), and in clearly observing the difference among coacervate, precipitate and other states of
soft matter (Comert et al., 2016; Turgeon & Laneuville, 2009).
This work does not seek to solve all these challenges, but aims to use
complementary techniques (differential light scattering, isothermal titration calorimetry, and turbidimetric titration) to elucidate in more
details some aspects of polysaccharide complexation. In special, the
complexation of CHI with three anionic polysaccharides, two of them
displaying carboxyl groups (ALG and GA) and the other displaying
sulfate groups (CRG). All these anionic polymers have application in the
formation of many products of the food industry, determining in great
extent the texture, mechanical stability, consistency and, ultimately,
appearance and taste of foods. The formation of complexes with such
polymers may be broadly industrial acceptance as an alternative for the
incorporation of functional ingredients into microcapsules, food coextrusion processes, and others.
Table 1
Molecular weights (Weight-average, Mw; Number-average, Mn; Z-average, Mz)
and polydispersity index (Mw/Mn) of chitosan, κ-carrageenan, sodium alginate,
and gum Arabic.
Polymer
Mw (g/mol)
5
Chitosan (CHI)
κ-carrageenan (CRG)
Sodium alginate (ALG)
Gum Arabic (GA)
1.51 × 10
1.67 × 10⁵
7.83 × 10⁴
4.28 × 10⁵
Mn (g/mol)
5
1.05 × 10
1.31 × 10⁵
6.63 × 10⁴
2.38 × 10⁵
Mz (g/mol)
5
1.98 × 10
2.04 × 10⁵
9.61 × 10⁴
6.10 × 10⁵
Mw/Mn
1.44
1.28
1.18
1.80
pressure viscometer]. The column used was an Ultrahydrogel Linear
(7.8 x 300 mm) (Waters Corp., Milford, USA) and the molecular weights
of polymers were calculated from the chromatographs with respect to
poly(ethylene oxide) standards. The analysis was performed at 25 °C;
acetate buffer (pH = 4.5) and NaNO3 (0.1 M) were the eluting solvents
used to analysis of CHI and anionic polymers, respectively. The flow
rate was kept at 0.8 mL/min, and the measurements were made in
triplicate with a coefficient of variation less than 10%.
2.2. Polysaccharide solutions
The total polymer concentration in the complexes was defined
below the gelation concentration of the polysaccharides. As an earlier
study showed that mixtures of CHI and CRG obtained from a CRG
concentration > 4 mg/mL were gels (Shumilina & Shchipunov, 2002),
we fixed the total polymer concentration in 2 mg/mL. The polysaccharides were dispersed in deionized water (25 ± 1 °C), with exception of CHI, which was dispersed in acetic acid solution (1% v/v).
The CRG dispersion was heated up to 80 ± 1 °C and stirred at 100 rpm
for 30 min for polymer solubilization. After preparation, the solutions
were stirred for 12 h at 100 rpm and 25 ± 1 °C for complete polymer
hydration. Before use, the solutions were filtered through filter paper
with a pore size of 14 μm (Qualy®, J.Prolab).
2.3. Ionization degrees of polysaccharide solutions
The potentiometric titrations of polymers were performed using a
titrator Mettler Toledo (Model T50, Switzerland) with a pH resolution
of ± 0.02 unit. The pH of the solutions was adjusted using HCl
(0.1–1.0 M) and NaOH (0.1–2.0 M) and the change in pH was noted
after every increment. This procedure was made in triplicate. The pH
versus volume (of HCl or NaOH) composed the titration curves of
polymers. Degrees of ionization values (α and β for anionic polymers
and CHI, respectively) were calculated from the modified
Henderson–Hasselbalch equations (Eqs. (1) and (2)) (Kayitmazer,
Koksal, & Kilic Iyilik, 2015).
2. Material and methods
2.1. Material
pka = pH + log
Chitosan (Deacetylation degree = 85%, CAS 9012-76-4, SigmaAldrich), κ-carrageenan (CAS 9000-07-1, Satiagel™ OF 10, Cargill),
sodium alginate (M:G ratio = 0.6, CAS 9005-38-3, Grindsted Alginate
FD 175, DuPont) and gum Arabic (CAS 9000-01-5, Instantgum,
Colloides Naturels) were used as received without further purifications.
Sodium chloride (CAS 7647-14-5, Synth), acetic acid (CAS 64-19-7, J.T.
Baker), sodium hydroxide (CAS 1310-73-2, Synth), sodium nitrate (CAS
7631-99-4, Sigma-Aldrich) and other chemicals were of analytical
grade. Ultrapure water with a resistivity of 18.2 mΩ was obtained from
Milli-Q purification device (Millipore Corp., Massachusetts, USA) and
used as a solvent to all complexation experiments. The molecular
weight and polydispersity of polymers (Table 1) were obtained through
size exclusion chromatography combined with multi-angle laser light
scattering (SEC-MALLS). The system consisted of a pump (Model 515,
Waters Corp., Milford, USA), an injector (Model 7725i, Rheodyne,
Missouri, USA) and a Viscotek TDA-302 triple detector [refractive
index, laser light scattering (λ =670 nm, 90° and 7°), and differential
pka = pH + log
(1
)
(1
)
(1)
(2)
2.4. Zeta-potential (ζ-potential)
The ζ-potential of samples was determined using Zetasizer Nano-ZS
(Malvern Instruments, Worcestershire, UK) equipment, the operating
principle of which is Laser Doppler Electrophoresis. The measurements
were performed at 25 ± 1 °C in a disposable capillary cell (DTS1070).
The electrophoretic mobility of the samples was converted into ζ-potential by the Malvern software using the Henry’s equation (Eq. (3))
with Smoluchowski approximation (F(ka) = 1.5). The viscosity, dielectric constant and the refractive index of the solvent were set at
0.8872 cp, 78.5 and 1.333, respectively.
2
Carbohydrate Polymers 223 (2019) 115120
R.S. Rabelo, et al.
2 F (ka)
U
=
E
3
ITC measurements. The time between each successive addition of anionic polymer in the cell containing the cationic polymer was equal to
300 s. The stirring of samples between each polymer injection was done
manually and the experiment was performed at 25 ± 1 °C. The turbidity of the non-complexed polymers was evaluated at pH of complexation, none of them showed absorption at 600 nm.
(3)
Where: U/E is the electrophoretic mobility (m2 V−1 s−1 x 10⁻⁸), ζ is the
zeta-potential (mV), ε is the dielectric constant (dimensionless), η is the
viscosity (cP), and F(ka) is the Henry’s function.
2.5. Polysaccharide complexation
2.9. Fourier transform infrared spectroscopy (FTIR)
The complexation was made by slow addition of the anionic
polymer (n−) to the cationic polymer (n+). The order of mixing was
kept the same for all experiments and the total polymer concentration
was fixed at 2 mg/mL. The complexation of polymers at 50 and 100 mM
NaCl were carried out with polysaccharide solutions previously prepared at this molar concentration of salt. After complexation, all samples were equilibrated for 24 h before analytical investigation. All
complexes were made in duplicate.
The FTIR spectra were recorded on a Bruker IFS-55 FTIR spectrometer (Bruker Analytik, Karlsruhe, Germany) in the pellet with KBr.
Before analysis, the polymers were kept in a desiccator and the polymeric complexes were dried in a freeze dryer for 24 h. Each sample (2%
w/w) was added to dry potassium bromide (KBr), and the mixture was
ground into a fine powder using an agate mortar before pressing into a
thin KBr pellet under a hydraulic press at 10,000 psi. IR spectra were
recorded at 25 ± 1 °C by the accumulation of at least 100 scans from
4000 to 400 cm−1, with a resolution of 4 cm−1.
2.6. Microstructure of complexes
2.10. Statistical analysis
The microstructures of the freshly formed complexes were analyzed
using an optical microscope (Model AxioScope A1, Carl Zeiss,
Germany) with a 100x oil-immersion objective. A confocal microscope
Upright Zeiss LSM780-NLO (Carl Zeiss, Germany) was also used to
observe the structure of the complexes. In this case, the polysaccharides
were labeled with fluorescein isothiocyanate and then subjected to
complexation. The laser of equipment was adjusted to green fluorescence mode that yielded an excitation wavelength of 488 nm, which
generated green fluorescence images of samples.
The data presented in this work represents the mean ( ± standard
deviation, SD) of two independent experiments, each analyzed in triplicate. Statistical analysis was performed using Statistica 8.0 (Stat Soft
Inc., USA). Significant differences among samples were determined by
the Tukey test. The level of significance was set at p ≤ 0.05.
3. Results and discussion
3.1. Characterization of polymeric solutions
2.7. Isothermal titration calorimetry (ITC)
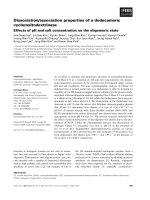
Prior to complexation of polymers, the most appropriate pH range
for complex coacervation was evaluated from the analysis of ζ-potential
(Fig. 1A) and of ionization degree (Fig. 1B) of polymers.
The data presented in Fig. 1 are associated with the charge density,
which is directly related to the protonation of ionizable groups of
polysaccharides (GA, CHI, ALG and CRG). As expected, since the ionized groups of polysaccharides used are carboxylic (−CO2−, pKa
about 2.5 to 4.5), sulfate (-SO4−, pKa < about 0.5–1.5), and amino
(-NH3+, pKa about 9.4) groups (Jones & McClements, 2010; Wang,
Loganathan, & Linhardt, 1991), the pH range where the anionic polysaccharides and the CHI are protonated is broad, varying from pH 2.0 to
pH 7.0, approximately.
At lower pHs, the CHI, which presents a large number of protonated
amino groups (-NH3+) exhibits a positive ζ-potential. The decrease in
the ζ-potential values of CHI was observed with the pH increasing, due
to deprotonation (-NH2) of the amino groups of CHI. The ζ-potential of
CHI was equal to zero around pH 7.3 (Fig. 1A), which is in agreement
with the literature (de Morais et al., 2016; Rinaudo, 2006). From this
pH, the ζ-potential of the CHI remained constant around zero.
The anionic polysaccharides solutions exhibited negative ζ-potential
throughout the evaluated pH range. The ζ-potential of ALG decreased
gradually from pH 2.0 to pH 6.0 and then, remained constant around
−86 mV. The ζ-potential of CRG in the pH range of 3.0–9.0 was
characteristic of strong polyelectrolytes since, in a wide pH range, the ζpotential values were practically constant (around -60 and −70 mV).
Lastly, the ζ-potential of GA remained constant at −20 mV after
reaching a pH of 4.5. The difference in the ζ-potential of ALG and CRG
was attributed mainly to the different pKa values of the respective
charged groups. For GA, which is a heteropolysaccharide, the low values of ζ-potential are related to the balance of charge between carboxylic and amino groups present in their saccharide and protein
fraction, respectively.
The ionization degrees of the polymeric solutions, which indicate
the fraction of ionizable groups that are available for complexation,
were also determined. The titrations of polymers with NaOH or HCl
Isothermal titration calorimetry was performed in a MicroCal VPITC (MicroCal Inc., MA, USA) with a sample cell volume equal to
1.4193 mL and an automatic injection syringe system. The sample cell
was filled with the CHI solution. Injection syringe was loaded with the
anionic polymer solution, at the same pH and ionic strength of the
solution in the cell. Then, after a preliminary injection of 2 μL of anionic
polymer, 28 successive injections of 10 μL of this polymer were made
with an interval of 300 s between each injection. The agitation speed
was set to 307 rpm. Before titration, all solutions were degassed in a
vacuum degasser Thermovac (MicroCal Inc., MA, USA). Control experiments were carried out to determine the enthalpies associated with
the heat of dilution of cationic and anionic polymers. The final titration
curves were obtained by subtracting the control enthalpies from the
enthalpies measured in the titration experiments. The thermogram data
were integrated using NITPIC 1.2.7 (Keller et al., 2012; Scheuermann &
Brautigam, 2016), and were analyzed in SEDPHAT 15.2b (Zhao,
Piszczek, & Schuck, 2015). The plots of results were made in GUSSI
1.4.0 (Brautigam, 2015). The binding constant (Ka), the binding stoichiometry (N) and the enthalpy change (ΔH), were obtained from a
one-binding-site model adjusted to experimental data. The entropy
change (ΔS) and Gibbs-free-energy change (ΔG) were calculated from
the fundamental equations of thermodynamics, ΔG = −RT ln Ka = ΔH
– TΔS.
2.8. Turbidimetric titration
Turbidity was used to qualitatively measure the extent of complex
formation as a function of the molar ratio of polysaccharides [R =
(n−)/(n+)]. A spectrophotometer (SpectroQuest 2800 UV/-Vis,
UNICO, New Jersey, USA) was used to monitor the transmittance of
complexes at 600 nm using glass cuvettes with 1 cm of optical path
length. The turbidity was calculated as τ = – (1/L) ln(T), where L is the
optical path length (1 cm) and T is the transmittance (0–100%). The
experiments were designed to follow the same dilution protocol as the
3
Carbohydrate Polymers 223 (2019) 115120
R.S. Rabelo, et al.
Fig. 1. ζ-potential (a) and ionization degree (b) of chitosan (●), sodium alginate (∇), gum Arabic (○) and κ-carrageenan (▼) as a function of pH. The data represent
the means ± standard deviation (n = 3) measured at 25 °C.
were carried out to determine the value of α (protonated degree) and β
(deprotonated degree). In Fig. 1B, the intersections between α and β
were observed in the pH range from 3.0 to 5.0, where more than 90% of
the primary amino groups are protonated and more than 90% of carboxylic and sulfate groups are deprotonated. Considering that complexation of polyelectrolytes is driven mainly by electrostatic interactions, this range of pH was selected to continue this study.
Still in Fig. 1B, it is possible to observe that a higher fraction of
ionizable groups of CRG is available to complex with CHI in comparison
to the other anionic polymers (ALG and GA). This result suggests a
higher affinity of electrostatic interaction between CHI and CRG due to
the high availability of ionizable groups of both.
and CRG:CHI at different molar ratios are presented in a pH range of
3.0–5.0. The polymer concentration of complexes was fixed at 2 mg/
mL. The molar ratio, R, was defined as the molar ratio between anionic
and cationic polymer (R[-/+] = n-/n+).
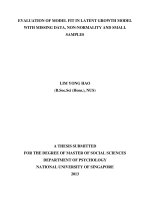
For GA:CHI, at pH 3.5 and 4.0 the neutrality of the ζ-potential of
samples was found at R[-/+] = 2.45 and R[-/+] = 2.10, respectively
(Fig. 2A). At these pH-values, the neutrality of the system was expected
to be reached at R[-/+] ≈ 1.60 and 1.00 (data estimated from the ζpotential data, Fig. 1A); i.e., a higher amount of GA would be necessary
to saturate the CHI chain. For ALG:CHI (Fig. 2B), deviations from
stoichiometric charge ratio was also observed at pH 3.25; the polymer
ratio where the neutrality of the complex was observed, R[-/+] = 2.40,
was a little higher than the estimated value, R[-/+] ≈ 2.12. Similar
deviations from stoichiometry were also reported by other authors in
the case of complexation of ALG with CHI (Becherán-Marón et al.,
2004; Kulig et al., 2016; Sæther et al., 2008).
For CRG:CHI, the formation of a complex with a ζ-potential near to
3.2. Characterization of the complexes
3.2.1. Zeta-potential of complexes at different molar ratios
In Fig. 2, the ζ-potential values for the systems GA:CHI, ALG:CHI
Fig. 2. ζ-potential of GA:CHI (a), ALG:CHI (b) and CRG:CHI (c) at different pHs as a function of molar ratio, expressed as the ratio between the molar concentration of
anionic and cationic polymer. The data represent the means ± standard deviation (n = 3), the measurements were made at 25 °C and the (●) pH 3.00, (○) pH 3.25,
(▼) pH 3.50, (Δ) pH 3.75, (◼) pH 4.00, (□) pH 4.25, (♦) pH 4.50, (◊) pH 4.75 and (▲) pH 5.00 were evaluated.
4
Carbohydrate Polymers 223 (2019) 115120
R.S. Rabelo, et al.
Fig. 3. Phase separation of GA:CHI (a), ALG:CHI (b) and CRG:CHI (c) at different pHs as a function of molar ratio, expressed as the ratio between the molar
concentration of anionic and cationic polymer (R[-/+] = n-/n+). The pictures were made after 24 h of complexation of polymers and the indicators red ( ), yellow (
) and white (○) are respective to positive, neutral and negative zeta-potential of the complex (For interpretation of the references to colour in this figure legend, the
reader is referred to the web version of this article).
zero was not observed (Fig. 2C). The mixture of these polysaccharides
resulted in an abrupt transition from positive to negative ζ-potential at
R[-/+] = 1.80–2.25 in all the pH values evaluated. For this system, the
estimated R-values (R[-/+] = 0.90–1.91) in the pH range of 3.0–5.0
were also lower than the experimental ones.
The discrepancies between R-values (estimated and experimental)
to all complexes evaluated could be associated with the occurrence of a
possible inaccessibility of some charged groups in the CHI molecule. It
is in accordance with Cao, Gilbert, and He (2009)) and Santoso et al.
(2012), who reported effects of “steric hindrance” of CHI in complexes
of this polymer with agarose and humic acid, respectively.
polymers (ALG and CRG) and the CHI in the pH range of 3.0 – 5.0.
This result partially explains the phase separation of complexes in
Fig. 3, since the charge density of polymers affects the critical point of
complexes’ phase separation. Polymers with a high charge density, such
as CHI and CRG at pH 3.0–5.0, tend to separate phases even at lower
polymer ratios, while the phase separation of weakly charged polymers
is usually observed at higher polymers ratios. On the other hand, it is
expected that the dissolution of the complexes formed by oppositely
charged polymers will occur by the charge repulsion in the presence of
excess polymer. However, as will be discussed in Fig. 4, that behavior
was not observed to all the systems evaluated in this work.
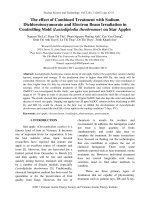
The Fig. 4 explores the microstructure of complexes close to neutrality (GA:CHI, pH 3.5, R[-/+] = 2.45; ALG:CHI, pH 3.25, R[-/
+] = 2.40; CRG:CHI, pH 4.00, R[-/+] = 1.80) and also with an excess of
anionic polymer (GA:CHI, pH 3.5, R[-/+] = 2.80; ALG:CHI, pH 3.25,
R[-/+] = 2.85; CRG:CHI, pH 4.00, R[-/+] = 2.70).
The images show the macroscopic behavior and the optical micrograph of spherical complexes, confirming that in the pH and molar ratio
conditions described, the polymers complexes formed a coacervated
phase. Comparing the images of samples obtained at different polymer
ratios, the GA:CHI (pH 3.5) did not present any significant changes in
its microstructure; the complexes maintained the spherical shape and a
diameter ranging from 1 to 10 μm. In the case of the complexes
ALG:CHI (pH 3.25) and CRG:CHI (pH 4.00), a significant change in the
microstructure of the systems was observed with the increase of
polymer ratio. At R[-/+] = 2.40 (ALG:CHI) and R[-/+] = 1.80
(CRG:CHI), the complexes formed coacervate droplets. But at R[-/
+] = 2.85 (ALG:CHI) and R[-/+] = 2.70 (CRG:CHI), thin fibrils were
3.2.2. Macro and microscopic images of complexes at a different molar
ratio
After ageing at room temperature for 24 h, macroscopic observations of the phase separation for each experimental condition evaluated
was registered (Fig. 3).
For GA:CHI, the phase separation was observed only in polymer
ratios (R[-/+]) and pHs where the system was closer to the charge
neutrality of the complex. Specifically, the ζ-potential equal to zero was
observed in pH 3.5 and 4.0 at polymers ratios of R[-/+] = 2.45 and R[-/
+] = 2.10, respectively. The amount of coacervate phase visualized in
GA:CHI system was also lower than the observed for the other complexes (ALG:CHI and CRG:CHI).
The phase separation of ALG:CHI (R[-/+] = 1.50–2.85, pH 3.0–5.0)
and CRG:CHI (R[-/+] = 0.90–2.70, pH 3.0–5.0) complexes was verified
for all pH values and molar ratios evaluated in Fig. 3. This probably
occurs due to the large difference between the charge density of anionic
5
Carbohydrate Polymers 223 (2019) 115120
R.S. Rabelo, et al.
Fig. 4. Optical and confocal micrograph of complex coacervate droplets of GA:CHI - pH 3.5 (a), ALG:CHI - pH 3.25 (b) and CRG:CHI - pH 4.0 (c) at different molar
ratios R[-/+]. (Scale bar of 10 μm).
observed apart from the spherical droplets. These fibrillary structures
were also visible from optical microscopy in the same polymer ratio,
but we chose to present the images obtained by confocal microscopy
(with higher contrast) to improve their visualization.
The fibrillary structures which apparently coexist with the coacervated droplets in Fig. 4B (ALG:CHI, pH 3.25, R[-/+] = 2.85) and Fig. 4C
(CRG:CHI, pH 4.00, R[-/+] = 2.70) could be associated with the beginning of the transition from coacervate to a gel phase, which is pushed by the polymers (ALG and CRG) tendency to gelation at reduced
electrostatic repulsion. Similar structures were also observed by other
authors that evaluated complexes containing CRG and pectin (both
gelling agents). Sow, Nicole Chong, Liao, and Yang (2018)), who
worked with complexes of fish gelatin (FG) and CRG, visualized the
formation of thin fibrils of CRG and demonstrated, through atomic force
microscopy images, that the existence of a critical mixing ratio from the
excess of CRG could contribute to the formation of bi-continuous gel in
the system FG:CRG. Kaushik, Rawat, Aswal, Kohlbrecher, and Bohidar
(2018)) reported the relation of complex coacervation and bicontinuous
gelation in the complexation of pectin with zein nanoparticles at room
temperature. Both authors observed a mixing ratio where the complex
presented lower charge repulsion as the initial condition of the observed structural transition.
investigate the microstructural transition from coacervate to gel, which
was proposed in the previous section for the complexes ALG:CHI and
CRG:CHI. The pHs 3.5 (GA:CHI), 3.25 (ALG:CHI) and 4.0 (CRG:CHI)
were fixed according to data presented in Section 3.2.1.
3.2.3.1. Isothermal titration calorimetry (ITC). Isothermal titration
calorimetry (ITC) is a direct way to measure the energy released (or
absorbed) during molecular interactions allowing their qualitative and
quantitative characterization. In Fig. 5, the binding isotherms of
complexes GA:CHI (pH 3.5), ALG:CHI (pH 3.25) and CRG:CHI (pH
4.0) obtained at 25 °C and in three different ionic strengths (0, 50 and
100 mM NaCl) are presented.
The binding isotherms in Fig. 5 were obtained from the integration
of thermogram peaks obtained during isothermal titration calorimetry
of anionic polymers in the CHI (A representative thermogram and its
respective isotherm are presented in the Supplementary data). The titrations were characterized by strong successive exothermic peaks that
decrease in intensity until the point where the enthalpy changes of the
system became constant. The fitting of the sigmoidal curves was satisfactory, and the thermodynamic parameters obtained from fitting are
presented in Table 2. These data enable a better comparison of the
systems and an accurate evaluation of salt concentration in the formation of complexes.
In Table 2, the N-values correspond to the binding stoichiometry of
complexes and are expressed as the molar ratio between anionic and
cationic polysaccharides (n−/n+). For GA:CHI, ALG:CHI and CRG:CHI,
the N-values have not changed significantly (p ≤ 0.05) with the
3.2.3. Titration experiments
The titration experiments were proposed in this work to verify the
kinds of molecular interactions associated with formation of GA:CHI,
ALG:CHI, CRG:CHI complexes at 0, 50 and 100 mM NaCl, and also to
6
Carbohydrate Polymers 223 (2019) 115120
R.S. Rabelo, et al.
Fig. 5. Binding isotherm of complexes GA:CHI (pH 3.5) (a) and ALG:CHI (pH 3.25) (b) and CRG:CHI (pH 4.0) (c) obtained at 25 °C and in three different ionic
strengths (0, 50 and 100 mM NaCl), respectively. Symbols represent experimental points and the line represents the calculated isotherm from the fitting of data.
increase of salt concentration (0, 50 and 100 mM NaCl). In addition, the
N-values at 0 mM NaCl were in good agreement with the experimental
molar ratios (R[+/-]), where the electroneutrality of complexes (at
0 mM NaCl) was observed (Section 3.2.1). Only in the case of the
GA:CHI, a little bit higher value of N was observed in relation to the
previous value declared by analysis of ζ-potential.
The binding constant (Ka) expresses the affinity between the polymers and is obtained by the inclination of the sigmoidal curves presented in Fig. 5. The decrease of Ka in Table 2 followed the order:
CRG:CHI > > ALG:CHI > GA:CHI, which is in agreement with results
presented in Section 3.2.1.
The Ka values magnitude in the complexes of GA:CHI and ALG:CHI
were 107 and 108, respectively, while the Ka value of CRG:CHI was in
the order of 1017, indicating that sulfated polysaccharides interact more
strongly with CHI than carboxylate polysaccharides. This results can be
associated with data of Section 3.2.1, where changes in the CRG:CHI ζpotential were characterized by an abrupt transition from positive to
negative at R[-/+] = 1.80–2.25, while gradual changes in the ζ-potential were observed for the other complexes.
The binding constant between CRG and CHI was reduced with the
addition of NaCl, but the magnitude of Ka was still higher than that
observed for the other complexes. For GA:CHI and ALG:CHI, the differences of Ka values between the three ionic strengths (0, 50 and
100 mM NaCl) remained in the same order of magnitude and no significant differences (p ≤ 0.05) were observed between the values of Ka
in this range of salt concentration.
Still in Table 2, the interaction of anionic polymers with CHI
showed a favorable enthalpy change (ΔH < 0) that is offset partially by
an unfavorable entropy (ΔS < 0). The negative value for free energy
indicates that binding of CHI with anionic polymers occurred spontaneously, which is characteristic of associative phase separation (Schmitt
et al., 1998).
Comparing the values of ΔG of complexes GA:CHI, ALG:CHI and
CRG:CHI, the difference observed among them, could be attributed to
the fact that the loss in polysaccharide conformational freedom after
the association is more considerable for CRG molecules than ALG or GA
molecules, justifying the higher values of ΔG of CRG:CHI.
The complexation of polymers at different ionic strengths (0, 50 and
100 mM NaCl) was accompanied by large changes in the enthalpic and
entropic contributions, and by no significant (p ≤ 0.05) changes in the
free-energy (ΔG) of the evaluated system. The relationship between the
binding enthalpies ΔH and entropies TΔS was then drawn in a plot to
each complex, taking into account the three ionic strengths evaluated.
An almost perfect linear relationship was obtained, indicating that any
change in enthalpy is accompanied by a similar change in entropy,
which represents an entropy-enthalpy compensation.
That compensation can be associated with the balance of molecular
interactions that actuates in the formation and stability of complexes at
different ionic strengths. The electrostatic interactions, recognized as
the main molecular interactions in the formation of the polyelectrostatic complexes operate at a greater distance than the hydrogen bonds
and Van der Walls interactions. In higher salt concentrations, the ions
shield the charge of polyelectrolytes in solution disfavoring the electrostatic interactions, and then, the importance of non-electrostatic
forces on complexation rises. The occurrence of non-electrostatic interactions is commonly characterized by tighter binding that contributes to the loss of entropy (Bolel, Datta, Mahapatra, & Halder,
2012). Thus, the gain in enthalpy of binding is offset by a loss in entropy, justifying the result presented in Table 2.
The reduction of the absolute values of ΔH of complexes as a
function of the increase in salt concentration is due to electrostatic
screening effects of Na+/Cl–, which weaken the attractive interactions
between polymers. For GA:CHI, the formation of complexes practically
was not observed at 100 mM NaCl, underlying a predominance of
Table 2
Thermodynamic parameters obtained from the mathematical adjustment of an one-site model for binding between anionic polymers and chitosan in the complexes
GA:CHI (pH 3.5), ALG:CHI (pH 3.25) and CRG:CHI (pH 4.00) at 25 °C and different ionic strengths (0, 50 and 100 mM NaCl).
Complex
GA:CHI
GA:CHI
GA:CHI
ALG:CHI
ALG:CHI
ALG:CHI
CRG:CHI
CRG:CHI
CRG:CHI
I (mM NaCl)
0
50
100
0
50
100
0
50
100
Ka (M−1)
N
2.81
2.97
3.27
2.42
2.38
2.41
1.97
2.10
2.18
±
±
±
±
±
±
±
±
±
a
0.11
0.34a
0.24a
0.39ª
0.01ª
0.06ª
0.48ª
0.20ª
0.34ª
7.09
3.73
2.62
4.28
2.38
1.69
4.89
5.33
2.84
±
±
±
±
±
±
±
±
±
0.79
0.46
0.92
0.26
0.68
0.25
1.37
0.85
0.12
ΔG (kcal/mol)
7
a
(x10 )
(x107) a
(x107) a
(x108) a
(x108) a
(x108) a
(x1017) a
(x1016) a
(x1010) b
−10.70
−10.32
−10.11
−11.76
−11.41
−11.21
−24.11
−22.79
−14.24
±
±
±
±
±
±
±
±
±
0.48ª
0.27ª
0.73ª
0.15ª
0.42ª
0.15ª
2.88ª
1.91ª
0.74b
Different superscripted lowercase letters indicate significant differences at p ≤ 0.05 for each complex.
7
ΔH (kcal/mol)
TΔS (kcal/mol)
a
−130.31 ± 16.11
−30.58 ± 2.73b
−17.05 ± 1.68b
−459.35 ± 49.30ª
−405.92 ± 24.78ª
−360.46 ± 21.06ª
−501.15 ± 91.64ª
−416.55 ± 50.84ab
−210.94 ± 36.85b
−119.61 ± 16.59a
−20.27 ± 3.00b
−6.94 ± 2.41b
−447.58 ± 49.44ª
−394.50 ± 25.19ª
−349.24 ± 21.21ª
−477.04 ± 94.50ª
−393.75 ± 52.74ab
−196.69 ± 37.59b
Carbohydrate Polymers 223 (2019) 115120
R.S. Rabelo, et al.
electrostatic interactions in this system. Similarly, Liu et al. (2010) and
Liu, Low, and Nickerson (2009)) reported that from levels of 100 mM
NaCl, the coacervation of pea protein isolates with GA was not more
observed.
The ALG:CHI was the less sensitive complex to the presence of NaCl.
The increase in the NaCl concentration from 0 to 100 mM has not
shown any significant change in the values of ΔH of the system. That
behavior was attributed to the effect of ALG in the complex. Carneiroda-Cunha, Cerqueira, Souza, Teixeira, and Vicente (2011)) evaluated
the effect of ionic strength (0–17 mM) in solutions of ALG (2.0–6.0 mg/
mL), CRG (2.0–4.0 mg/mL) and CHI (2.0–6.0 mg/mL). They observed
that the increase of NaCl exerts a significant (p ≤ 0.05) influence in the
average size of all polymeric solutions evaluated, with exception to
ALG. In addition, the authors also observed that changes in the ζ-potential of ALG solutions were near to the observed for CHI, but much
less pronounced than CRG solutions. The authors attributed the lower
sensitivity of ALG to changes in NaCl concentration of the compound
structure, which in this case was already influenced by the presence of
Na+.
The variation of ΔH-values of CRG:CHI from 0 to 100 mM NaCl was
not enough to suppress the formation of CRG:CHI complexes, but was
significant at p ≤ 0.05. Weinbreck, Nieuwenhuijse, Robijn, and De
Kruif (2004)) reported a partial inhibition in complex formation for a
whey protein isolate-CRG at NaCl concentration greater than 45 mM,
with complete inhibition at 1 M NaCl. The higher amount of NaCl necessary to suppress the complexation of cationic polymers with the CRG
is associated with the high negative charge of the sulfate groups in its
structure.
The effect of temperature in the formation of complexes was also
evaluated at 50 °C to complex with 0 mM NaCl (Supplementary data).
As temperature increase had no significant (p ≤ 0.05) effect on the
complexation of the polymers the values of heat capacity (ΔCp = ∂ΔH/
∂T) between 25–50 °C were equal to zero (p ≤ 0.05), confirming the
negligible effect of hydrophobic interactions on CHI complexes with
GA, ALG or CRG. The ΔCp provides thermodynamic information on the
change in hydration of the complexes and in most ITC studies, a negative value of ΔCp is interpreted as an indicator of hydrophobic effect
in the binding process (Darby, Platts, Daniel, Cowieson, & Falconer,
2017; Kabir & Kumar, 2013).
defined in ITC analysis, which is the point of maximum complexation of
polymers. Moreover, the turbidity profile of samples was characterized
by two different behaviors: 1) the turbidity of samples gradually decreased (without any apparent precipitation of polymer aggregation),
indicating the dissolution of the complexes; 2) the turbidity of samples
remains almost constant, though with a slight decrease trend.
The complex that showed a gradual decrease in turbidity values was
GA:CHI. That decrease might be due to the decrease in size or volume
fraction of particles caused by the rise of electrostatic repulsion of the
system, with the addition of anionic polymer in excess.
The other two systems (CRG:CHI and ALG:CHI) behaved as described in the second case, where the turbidity remained practically
constant (though with a slight decrease trend) after reaching a maximum point. That behavior is in agreement with the microstructural
change of complexes ALG:CHI and CRG:CHI presented in Fig. 4, where
the transition of condensed soft matter from coacervate to gel was
proposed (Section 3.2.2). The results in Fig. 6B and C, respectively, are
in accordance with the gelling of the complexes from the experimental
condition where the charge stoichiometry of systems was achieved.
Possibly, the reduction of electrostatic repulsion in this experimental
condition was the trigger to start the cold gelation of complexes at room
temperature and a polymer concentration below the gelling concentration of the non-complexed polymers. Thus, due to gelation of the
systems ALG:CHI and CRG:CHI, the complete dissolution of complexes
was not reached with addition (in excess) of the anionic polymer.
For all complexes (GA:CHI, ALG:CHI and CRG:CHI), the overall
turbidity of the samples containing NaCl was lower than the observed
in solutions in which the salt was not added, or was added in a lower
concentration. That result is related to a reduced complexation of
polymers in the presence of NaCl, which was also verified by ITC.
3.2.4. Fourier transform infrared spectroscopy (FTIR)
FTIR is a powerful tool of structural analysis of biopolymers (Prado,
Kim, Özen, & Mauer, 2005; Synytsya & Novak, 2014), and polymeric
complexes (Alsharabasy, Moghannem, & El-Mazny, 2016; Dehghan &
Kazi, 2014; Li, Hein, & Wang, 2013). For polysaccharides, two spectral
regions are important for structural characterization; the “anomeric
region” (950 – 750 cm–1) and the “sugar region” (1200 – 950 cm–1)
(Kac̆uráková, Capek, Sasinková, Wellner, & Ebringerová, 2000;
Synytsya & Novak, 2014). Both regions are shown in Fig. 7 for anionic
polysaccharides, CHI and their respective complexes. Complete FTIR
spectra of these polymers and complexes are in Supplementary data.
In Fig. 7A, the CHI spectrum showed a peak at 1598 cm−1, related
to amide II, and strong absorption peaks at 1652 and 1320 cm−1, which
are related to amide I and III, respectively (Mansur, de S. Costa,
Mansur, & Barbosa-Stancioli, 2009). Peaks at 895, 1030, 1076 and 1154
cm−1 indicate the CeO stretching vibration, which is characteristic of
CHI saccharide structures (Kumar Singh Yadav & Shivakumar, 2012;
Mansur, Mansur, Curti, & De Almeida, 2013; Nikonenko, Buslov,
Sushko, & Zhbankov, 2000). For CRG, the bands observed around
3.2.3.2. Turbidity. The evolution of turbidity of CHI solution during the
addition of aliquots of anionic polymers was evaluated at different salt
concentrations: 0, 50 and 100 mM NaCl (Fig. 6). This experiment was
conducted to mimic the ITC experiments. The results presented very
low deviations, and the turbidity was seen as a sensitive measure of
electrostatic complexation of GA:CHI, ALG:CHI and CRG:CHI.
In the initial titration stage, the turbidity of samples increased until
reaching a maximum point. This increase of turbidity was associated
with the formation of insoluble complexes. The maximum turbidity
reached in each system corresponded to the stoichiometric molar ratio
Fig. 6. Evolution of turbidity (τ) of complexes GA:CHI (a) and ALG:CHI (b) and CRG:CHI (c) obtained at 25 °C and in pH 3.5, 3.25 and 4.0, respectively. (The
coefficients of variation associated with repeated measurement were less than 5%).
8
Carbohydrate Polymers 223 (2019) 115120
R.S. Rabelo, et al.
Fig. 7. FTIR spectra of ALG, GA, CRG and CHI (a), and of complexes ALG:CHI, GA:CHI and CRG:CHI.
845 cm−1, 925 cm−1, 1026 cm−1 and 1226 cm−1 indicated the presence of C–O–SO3 on D-galactose-4-sulfate, CeO of 3,6-anhydro-D-galactose, glycosidic linkage (CeO) of 3,6-anhydro-D-galactose and S]O
stretching of sulfate esters, respectively, which were typical features for
CRG (Correa-Díaz, Aguilar-Rosas, & Aguilar-Rosas, 1990). GA showed
typical bands at 1610 cm−1 attributed to asymmetric stretching vibrations of carboxyl acid salt −COO− and also broad peaks at
1068 cm−1 and 1420 cm−1, due to the stretching vibrations of the CeO
bond (Espinosa-Andrews et al., 2010; Sijun Liu, Huang, & Li, 2016). The
spectrum of ALG shows characteristic absorption peaks of polysaccharides around 1095 cm−1 (CeO stretching), 1030 cm−1 (CeOeC
stretching), and 947 cm−1 (CeO stretching). In addition, the FTIR
spectrum of this polymer exhibits peaks at 1609 and 1416 cm−1 which
are assigned to asymmetric and symmetric stretching peaks of carboxyl
groups (Smitha, Sridhar, & Khan, 2005).
Shifts in the bands arising from the ionized groups of ALG, GA and
CRG relative to their complex with CHI can be seen in Fig. 7B, indicating intermolecular interactions involving −COOˉ or –OSO3ˉ
groups with the amino group of CHI (−NH3+). Specifically in complexation with CHI, the peak 1560 cm−1 of CRG:CHI was attributed to a
symmetric deformation of –NH3+ groups, suggesting that the electrostatic interaction occurs between ionizable groups of sulfated polysaccharide and the amino group of CHI. For ALG:CHI, the complex
formation was evidenced by the sharpening of the band at 1608 cm−1
due to the −COO− groups in the ALG and the disappearance of the CHI
amino bands.
The new absorption band around 1412 cm−1 is another indication
of interaction between CHI and anionic polymers in GA:CHI, ALG:CHI
and CRG:CHI. Peaks around this wavelength have already been identified by others authors as Simsek-Ege, Bond, and Stringer (2003)) and
Lawrie et al. (2007), in electrostatic complexation of CHI with ALG, and
Tapia et al. (2004), in complexation of CHI with CRG.
phase transition of coacervate to gel proposed to the complexes
ALG:CHI and CRG:CHI is interesting in an industrial process because it
could allow modulating the internal structure and the firmness of the
gels by adjusting the pH, the ionic strength and the polymer ratio. The
variation of ionic strengths (0–100 mM NaCl) in the complexation of
CHI with anionic polymers resulted in a significant reduction in the
binding constant of complexes GA:CHI and CRG:CHI. The complex
ALG:CHI was less sensitive to the presence of NaCl (0–100 mM) than
the other complexes. FTIR spectra of complexes confirmed the electrostatic interactions involving the anionic polysaccharides with CHI.
The unique characteristic of each complex studied with regard to
changes in ionic strength, pH and polymer ratio opens opportunity for
CHI application in different food systems, such as microcapsule formation, textural modification in products with lower or higher salt
content, and others. For applying these systems in food formulations it
is still important the knowledge of the thermal and rheological behavior
of the preparations and their responses in a higher polymer concentration.
4. Conclusion
References
The use of different titration techniques allowed the determination
of binding stoichiometry of complexes and a better molecular understanding of the complexation of CHI with GA, ALG and CRG involving
the solubility and the structural complexes conformation. The structural
Alishahi, A., Mirvaghefi, A., Tehrani, M. R., Farahmand, H., Shojaosadati, S. A.,
Dorkoosh, F. A., ... Elsabee, M. Z. (2011). Shelf life and delivery enhancement of
vitamin C using chitosan nanoparticles. Food Chemistry, 126(3), 935–940. https://doi.
org/10.1016/J.FOODCHEM.2010.11.086.
Acknowledgements
This work was supported by the Brazilian funding agencies FAPESP
(2015/11984-7), CNPq (449506/2014-2) and CAPES (001). The authors thank the access to confocal microscopy equipment provided by
INFABIC/UNICAMP (FAPESP 08/57906-3, CNPq 573913/2008-0), and
the Brazilian Biosciences National Laboratory (LNBio) at the CNPEM,
Brazil, for granting access to their ITC equipment.
Appendix A. Supplementary data
Supplementary data related to this article can be found, in the online version, at doi: />
9
Carbohydrate Polymers 223 (2019) 115120
R.S. Rabelo, et al.
Alsharabasy, A. M., Moghannem, S. A., & El-Mazny, W. N. (2016). Physical preparation of
alginate/chitosan polyelectrolyte complexes for biomedical applications. Journal of
Biomaterials Applications, 30(7), 1071–1079. />0885328215613886.
Becherán-Marón, L., Peniche, C., & Argüelles-Monal, W. (2004). Study of the interpolyelectrolyte reaction between chitosan and alginate: Influence of alginate composition and chitosan molecular weight. International Journal of Biological
Macromolecules, 34(1–2), 127–133. />Bharmoria, P., Singh, T., & Kumar, A. (2013). Complexation of chitosan with surfactant
like ionic liquids: Molecular interactions and preparation of chitosan nanoparticles.
Journal of Colloid and Interface Science, 407, 361–369. />2013.06.032.
Bolel, P., Datta, S., Mahapatra, N., & Halder, M. (2012). Spectroscopic investigation of the
effect of salt on binding of Tartrazine with two homologous serum albumins:
Quantification by use of the debye–Hückel limiting law and observation of
enthalpy–Entropy compensation. The Journal of Physical Chemistry B, 116(34),
10195–10204. />Brautigam, C. A. (2015). Calculations and publication-quality illustrations for analytical
ultracentrifugation data. Methods in Enzymology, 562, 109–133. />1016/BS.MIE.2015.05.001.
Cao, Z., Gilbert, R. J., & He, W. (2009). Simple agarose - chitosan gel composite system
dimensions. Biomacromolecules, 10, 2954–2959. />bm900670n.
Carneiro-da-Cunha, M. G., Cerqueira, M. A., Souza, B. W. S., Teixeira, J. A., & Vicente, A.
A. (2011). Influence of concentration, ionic strength and pH on zeta potential and
mean hydrodynamic diameter of edible polysaccharide solutions envisaged for
multinanolayered films production. Carbohydrate Polymers, 85(3), 522–528. https://
doi.org/10.1016/J.CARBPOL.2011.03.001.
Cesar, L. T., de Freitas Cabral, M., Maia, G. A., de Figueiredo, R. W., de Miranda, M. R. A.,
de Sousa, P. H. M., ... Gomes, C. L. (2012). Effects of clarification on physicochemical
characteristics, antioxidant capacity and quality attributes of aỗaớ (Euterpe oleracea
Mart.) juice. Journal of Food Science and Technology, 51(11), 3293–3300. https://doi.
org/10.1007/s13197-012-0809-6.
Chapeau, A.-L., Bertrand, N., Briard-Bion, V., Hamon, P., Poncelet, D., & Bouhallab, S.
(2017). Coacervates of whey proteins to protect and improve the oral delivery of a
bioactive molecule. Journal of Functional Foods, 38, 197–204. />1016/J.JFF.2017.09.009.
Chollakup, R., Beck, J. B., Dirnberger, K., Tirrell, M., & Eisenbach, C. D. (2013).
Polyelectrolyte molecular weight and salt effects on the phase behavior and coacervation of aqueous solutions of poly(acrylic acid) sodium salt and poly(allylamine)
hydrochloride. Macromolecules, 46(6), 2376–2390. />ma202172q.
Comert, F., Malanowski, A. J., Azarikia, F., & Dubin, P. L. (2016). Coacervation and
precipitation in polysaccharide–protein systems. Soft Matter, 12(18), 4154–4161.
/>Correa-Díaz, F., Aguilar-Rosas, R., & Aguilar-Rosas, L. E. (1990). Infrared analysis of
eleven carrageenophytes from Baja California, Mexico. S. C. Lindstrom, & P. W.
Gabrielson (Eds.). Thirteenth International Seaweed Symposium: Proceedings of the
Thirteenth International Seaweed Symposium Held in Vancouver, Canada, August 13–18,
1989, 609–614. />Darby, S. J., Platts, L., Daniel, M. S., Cowieson, A. J., & Falconer, R. J. (2017). An isothermal titration calorimetry study of phytate binding to lysozyme: A multisite
electrostatic binding reaction. Journal of Thermal Analysis and Calorimetry, 127(2),
1201–1208. />de Kruif, C. G., Weinbreck, F., & de Vries, R. (2004). Complex coacervation of proteins
and anionic polysaccharides. Current Opinion in Colloid & Interface Science, 9(5),
340–349. />de Morais, W. A., Silva, G. T. M., Nunes, J. S., Wanderley Neto, A. O., Pereira, M. R., &
Fonseca, J. L. C. (2016). Interpolyelectrolyte complex formation: From lyophilic to
lyophobic colloids. Colloids and Surfaces A: Physicochemical and Engineering Aspects,
498, 112–120. />Dehghan, M. H. G., & Kazi, M. (2014). Lyophilized chitosan/xanthan polyelectrolyte
complex based mucoadhesive inserts for nasal delivery of promethazine hydrochloride. Iranian Journal of Pharmaceutical Research, 13(3), 769–784. />10.1016/j.memsci.2015.04.023.
Domingues, R. C. C., Faria Junior, S. B., Silva, R. B., Cardoso, V. L., & Reis, M. H. M.
(2012). Clarification of passion fruit juice with chitosan: Effects of coagulation process variables and comparison with centrifugation and enzymatic treatments. Process
Biochemistry, 47(3), 467–471. />Eghbal, N., Yarmand, M. S., Mousavi, M., Degraeve, P., Oulahal, N., & Gharsallaoui, A.
(2016). Complex coacervation for the development of composite edible films based
on LM pectin and sodium caseinate. Carbohydrate Polymers, 151, 947–956. https://
doi.org/10.1016/J.CARBPOL.2016.06.052.
Espinosa-Andrews, H., Báez-González, J. G., Cruz-Sosa, F., & Vernon-Carter, E. J. (2007).
Gum Arabic-chitosan complex coacervation. Biomacromolecules, 8, 1313–1318.
/>Espinosa-Andrews, H., Enríquez-Ramírez, K. E., García-Márquez, E., Ramírez-Santiago,
C., Lobato-Calleros, C., & Vernon-Carter, J. (2013). Interrelationship between the
zeta potential and viscoelastic properties in coacervates complexes. Carbohydrate
Polymers, 95(1), 161–166. />Espinosa-Andrews, H., Sandoval-Castilla, O., Vázquez-Torres, H., Vernon-Carter, E. J., &
Lobato-Calleros, C. (2010). Determination of the gum Arabic–chitosan interactions by
Fourier Transform Infrared Spectroscopy and characterization of the microstructure
and rheological features of their coacervates. Carbohydrate Polymers, 79(3), 541–546.
/>FDA (Food and Drug Administration) (2012). Gras notices (GRN No. 443). Retrieved from
(Food and Drug Administration) GRN No. 443 website:.
gov/scripts/fdcc/?set=GRASNotices&id=443&sort=GRN_No&order=DESC&
startrow=1&type=basic&search=chitosan.
Ferreira, A. S., Nunes, C., Castro, A., Ferreira, P., & Coimbra, M. A. (2014). Influence of
grape pomace extract incorporation on chitosan films properties. Carbohydrate
Polymers, 113, 490–499. />Higueras, L., López-Carballo, G., Gavara, R., & Hernández-Moz, P. (2015). Reversible
covalent immobilization of Cinnamaldehyde on chitosan films via schiff base formation and their application in active food packaging. Food and Bioprocess
Technology, 8(3), 526–538. />Jones, O. G., & McClements, D. J. (2010). Functional biopolymer particles: Design, fabrication, and applications. Comprehensive Reviews in Food Science and Food Safety,
9(4), 374–397. />Kabir, A., & Kumar, G. S. (2013). Binding of the biogenic polyamines to deoxyribonucleic
acids of varying base composition : Base specificity and the associated energetics of
the interaction. PLoS One, 8(7), 1–13. />0070510.
Kac̆uráková, M., Capek, P., Sasinková, V., Wellner, N., & Ebringerová, A. (2000). FT-IR
study of plant cell wall model compounds: Pectic polysaccharides and hemicelluloses.
Carbohydrate Polymers, 43(2), 195–203. />00151-X.
Kaushik, P., Rawat, K., Aswal, V. K., Kohlbrecher, J., & Bohidar, H. B. (2018). Mixing ratio
dependent complex coacervation: Versus bicontinuous gelation of pectin with in situ
formed zein nanoparticles. Soft Matter, 14(31), 6463–6475. />c8sm00809d.
Kayitmazer, A. B., Koksal, A. F., & Kilic Iyilik, E. (2015). Complex coacervation of hyaluronic acid and chitosan: Effects of pH, ionic strength, charge density, chain length
and the charge ratio. Soft Matter, 11(44), 8605–8612. />C5SM01829C.
Keller, S., Vargas, C., Zhao, H., Piszczek, G., Brautigam, C. A., & Schuck, P. (2012). Highprecision isothermal titration calorimetry with automated peak-shape analysis.
Analytical Chemistry, 84(11), 5066–5073. />Kizilay, E., Kayitmazer, A. B., & Dubin, P. L. (2011). Complexation and coacervation of
polyelectrolytes with oppositely charged colloids. Advances in Colloid and Interface
Science, 167(1–2), 24–37. />Kulig, D., Zimoch-Korzycka, A., Jarmoluk, A., & Marycz, K. (2016). Study on alginatechitosan complex formed with different polymers ratio. Polymers, 8(5), 1–17. https://
doi.org/10.3390/polym8050167.
Kumar Singh Yadav, H., & Shivakumar, H. G. (2012). In vitro and in vivo evaluation of
pH-Sensitive hydrogels of carboxymethyl chitosan for intestinal delivery of theophylline. ISRN Pharmaceutics, 1–9. />Laneuville, S. I., Paquin, P., & Turgeon, S. L. (2005). Formula optimization of a low-fat
food system containing whey protein isolate- xanthan gum complexes as fat replacer.
Journal of Food Science, 70(8), s513–s519. />2005.tb11527.x.
Lawrie, G., Keen, I., Drew, B., Chandler-Temple, A., Rintoul, L., Fredericks, P., ...
Grøndahl, L. (2007). Interactions between alginate and chitosan biopolymers characterized using FTIR and XPS. Biomacromolecules, 8(8), 2533–2541. />10.1021/bm070014y.
Lemmers, M., Sprakel, J., Voets, I. K., van der Gucht, J., & Cohen Stuart, M. A. (2010).
Multiresponsive reversible gels based on charge-driven assembly. Angewandte Chemie
International Edition, 49(4), 708–711. />Li, C., Hein, S., & Wang, K. (2013). Chitosan-carrageenan polyelectrolyte complex for the
delivery of protein drugs. ISRN Biomaterials, 2013, 1–6. />2013/629807.
Lindhoud, S., de Vries, R., Schweins, R., Cohen Stuart, M. A., & Norde, W. (2009). Saltinduced release of lipase from polyelectrolyte complex micelles. Soft Matter, 5(1),
242–250. />Liu, S., Cao, Y.-L., Ghosh, S., Rousseau, D., Low, N. H., & Nickerson, M. T. (2010).
Intermolecular interactions during complex coacervation of pea protein isolate and
gum Arabic. Journal of Agricultural and Food Chemistry, 58(1), 552–556. https://doi.
org/10.1021/jf902768v.
Liu, S., Low, N. H., & Nickerson, M. T. (2009). Effect of pH, salt, and biopolymer ratio on
the formation of pea protein isolate gum arabic complexes. Journal of Agricultural and
Food Chemistry, 57(4), 1521–1526. />Liu, S., Huang, S., & Li, L. (2016). Thermoreversible gelation and viscoelasticity of κcarrageenan hydrogels. Journal of Rheology, 60(2), 203–214. />1122/1.4938525.
Luo, Y., & Wang, Q. (2014). Recent development of chitosan-based polyelectrolyte
complexes with natural polysaccharides for drug delivery. International Journal of
Biological Macromolecules, 64, 353–367. />017.
Magalhães, G. A., Jr, Moura Neto, E., Sombra, V. G., Richter, A. R., Abreu, C. M. W. S.,
Feitosa, J. P. A., ... de Paula, R. C. M. (2016). Chitosan/Sterculia striata polysaccharides nanocomplex as a potential chloroquine drug release device. International
Journal of Biological Macromolecules, 88, 244–253. />ijbiomac.2016.03.070.
Mansur, H. S., de S. Costa, E., Mansur, A. A. P., & Barbosa-Stancioli, E. F. (2009).
Cytocompatibility evaluation in cell-culture systems of chemically crosslinked chitosan/PVA hydrogels. Materials Science and Engineering: C, 29(5), 1574–1583. https://
doi.org/10.1016/j.msec.2008.12.012.
Mansur, H. S., Mansur, A. A. P., Curti, E., & De Almeida, M. V. (2013). Functionalizedchitosan/quantum dot nano-hybrids for nanomedicine applications: Towards biolabeling and biosorbing phosphate metabolites. Journal of Materials Chemistry B, 1(12),
1696. />McClements, D. J., Decker, E. A., Park, Y., & Weiss, J. (2009). Structural design principles
10
Carbohydrate Polymers 223 (2019) 115120
R.S. Rabelo, et al.
for delivery of bioactive components in nutraceuticals and functional foods. Critical
Reviews in Food Science and Nutrition, 49(6), 577–606. />10408390902841529.
McClements, D. J. (2016). Food Emulsions: Principles, Practices, and techniques (third). CRC
Press.
McClements, D. J. (2017). Lipid-based emulsions and emulsifiers. In C. C. Akoh (Ed.).
Food lipids: Chemistry, nutrition, and biotechnology (pp. 73–107). (4th ed.). Boca Raton,
Florida, USA: CRC Press.
Nikonenko, N. A., Buslov, D. K., Sushko, N. I., & Zhbankov, R. G. (2000). Investigation of
stretching vibrations of glycosidic linkages in disaccharides and polysaccarides with
use of IR spectra deconvolution. Biopolymers, 57(4), 257–262. />1002/1097-0282(2000)57:4<257::AID-BIP7>3.0.CO;2-3.
P.M, V. (2014). Polyelectrolytes. In V. P. M. Oguz Bayraktar, & G. A. Picó (Eds.).
Polyelectrolytes: Thermodynamics and rheology />Prado, B. M., Kim, S., Özen, B. F., & Mauer, L. J. (2005). Differentiation of carbohydrate
gums and mixtures using Fourier transform infrared spectroscopy and chemometrics.
Journal of Agricultural and Food Chemistry, 53(8), 2823–2829. />1021/jf0485537.
Priftis, D., Megley, K., Laugel, N., & Tirrell, M. (2013). Complex coacervation of poly
(ethylene-imine)/polypeptide aqueous solutions: Thermodynamic and rheological
characterization. Journal of Colloid and Interface Science, 398, 39–50. />10.1016/j.jcis.2013.01.055.
Rinaudo, M. (2006). Chitin and chitosan: Properties and applications. Progress in Polymer
Science, 31(7), 603–632. />Rocha, M. A. M., Coimbra, M. A., & Nunes, C. (2017). Applications of chitosan and their
derivatives in beverages: A critical review. Current Opinion in Food Science, 15, 61–69.
/>Roldan-Cruz, C., Carmona-Ascencio, J., Vernon-Carter, E. J., & Alvarez-Ramirez, J.
(2016). Electrical impedance spectroscopy for monitoring the gum Arabic–chitosan
complexation process in bulk solution. Colloids and Surfaces A: Physicochemical and
Engineering Aspects, 495, 125–135. />Sæther, H. V., Holme, H. K., Maurstad, G., Smidsrød, O., & Stokke, B. T. (2008).
Polyelectrolyte complex formation using alginate and chitosan. Carbohydrate
Polymers, 74(4), 813–821. />Santoso, U. T., Nurmasari, R., Umaningrum, D., Santosa, S. J., Rusdiarso, B., & Siswanta,
D. (2012). Immobilization of humic acid onto chitosan using tosylation method with
1,4-butanediol as a spacer arm. Indonesian Journal of Chemistry, 12(1), 35–42. https://
doi.org/10.22146/ijc.21369.
Scheuermann, T. H., & Brautigam, C. A. (2016). High-precision, automated integration of
multiple isothermal titration calorimetric thermograms: New features of NITPIC.
Methods, 76, 87–98. />Schmitt, C., Sanchez, C., Desobry-Banon, S., & Hardy, J. (1998). Structure and technofunctional properties of protein-polysaccharide complexes: A review. Critical Reviews
in Food Science and Nutrition, 38(8), 689–753. />10408699891274354.
Shumilina, E. V., & Shchipunov, Y. A. (2002). Chitosan – Carrageenan gels. Colloidal
Journal, 64(3), 372–378. />Simsek-Ege, F. A., Bond, G. M., & Stringer, J. (2003). Polyelectrolye complex formation
between alginate and chitosan as a function of pH. Journal of Applied Polymer Science,
88, 346–351.
Smitha, B., Sridhar, S., & Khan, A. A. (2005). Chitosan–sodium alginate polyion
complexes as fuel cell membranes. European Polymer Journal, 41(8), 1859–1866.
/>Sow, L. C., Nicole Chong, J. M., Liao, Q. X., & Yang, H. (2018). Effects of κ-carrageenan on
the structure and rheological properties of fish gelatin. Journal of Food Engineering,
239, 92–103. />Synytsya, A., & Novak, M. (2014). Structural analysis of glucans. Annals of Translational
Medicine, 2(2), 17. />Tapia, C., Escobar, Z., Costa, E., Sapag-Hagar, J., Valenzuela, F., Basualto, C., ... YazdaniPedram, M. (2004). Comparative studies on polyelectrolyte complexes and mixtures
of chitosan–alginate and chitosan–carrageenan as prolonged diltiazem clorhydrate
release systems. European Journal of Pharmaceutics and Biopharmaceutics, 57(1),
65–75. />Tastan, O., & Baysal, T. (2015). Clarification of pomegranate juice with chitosan: Changes
on quality characteristics during storage. Food Chemistry, 180, 211–218. https://doi.
org/10.1016/J.FOODCHEM.2015.02.053.
Turgeon, S. L., & Laneuville, S. I. (2009). Protein + polysaccharide coacervates and
complexes: From scientific background to their application as functional ingredients
in food products. In S. Kasapis, I. T. Norton, & J. B. Ubbink (Eds.). Modern biopolymer
science (pp. 327–364). Academic Press.
Verlee, A., Mincke, S., & Stevens, C. V. (2017). Recent developments in antibacterial and
antifungal chitosan and its derivatives. Carbohydrate Polymers, 164, 268–283. https://
doi.org/10.1016/J.CARBPOL.2017.02.001.
Volod’ko, A. V., Davydova, V. N., Barabanova, A. O., Soloveva, T. F., & Ermak, I. M.
(2012). Formation of soluble chitosan-carrageenan polyelectrolyte complexes.
Chemistry of Natural Compounds, 48(3), 353–357. />Volod’ko, A. V., Davydova, V. N., Glazunov, V. P., Likhatskaya, G. N., & Yermak, I. M.
(2016). Influence of structural features of carrageenan on the formation of polyelectrolyte complexes with chitosan. International Journal of Biological
Macromolecules, 84, 434–441. />Wang, H. M., Loganathan, D., & Linhardt, R. J. (1991). Determination of the pKa of
glucuronic acid and the carboxy groups of heparin by 13C-nuclear-magnetic-resonance spectroscopy. The Biochemical Journal, 278(Pt 3), 689–695. Retrieved from
/>Wang, R., Guo, Y., Liu, H., Chen, Y., Shang, Y., & Liu, H. (2018). The effect of chitin
nanoparticles on surface behavior of DPPC/DPPG Langmuir monolayers. Journal of
Colloid and Interface Science, 519, 186–193. />021.
Weinbreck, F., Nieuwenhuijse, H., Robijn, G. W., & de Kruif, C. G. (2003). Complex
formation of whey proteins: Exocellular polysaccharide EPS B40. Langmuir, 19(22),
9404–9410. />Weinbreck, F., Nieuwenhuijse, H., Robijn, G. W., & De Kruif, C. G. (2004). Complexation
of whey proteins with carrageenan. Journal of Agricultural and Food Chemistry, 52(11),
3550–3555. />Xiong, W., Li, L., Wang, Y., Yu, Y., Wang, S., Gao, Y., ... Yang, X. (2016). Design and
evaluation of a novel potential carrier for a hydrophilic antitumor drug: Auricularia
auricular polysaccharide-chitosan nanoparticles as a delivery system for doxorubicin
hydrochloride. International Journal of Pharmaceutics, 511(1), 267–275. https://doi.
org/10.1016/j.ijpharm.2016.07.026.
Zhao, H., Piszczek, G., & Schuck, P. (2015). SEDPHAT – A platform for global ITC analysis
and global multi-method analysis of molecular interactions. Methods, 76, 137–148.
/>
11