Evaluation of nanocellulose interaction with water pollutants using nanocellulose colloidal probes and molecular dynamic simulations
Bạn đang xem bản rút gọn của tài liệu. Xem và tải ngay bản đầy đủ của tài liệu tại đây (3.95 MB, 12 trang )
Carbohydrate Polymers 229 (2020) 115510
Contents lists available at ScienceDirect
Carbohydrate Polymers
journal homepage: www.elsevier.com/locate/carbpol
Evaluation of nanocellulose interaction with water pollutants using
nanocellulose colloidal probes and molecular dynamic simulations
⁎
Chuantao Zhua, Susanna Montib, , Aji P Mathewa,
a
b
T
⁎
Department of Materials and Environmental Chemistry, Stockholm University, 10691 Stockholm, Sweden
CNR-ICCOM – Institute of Chemistry of Organometallic Compounds, via Moruzzi 1, 56124 Pisa, Italy
A R T I C LE I N FO
A B S T R A C T
Keywords:
Atomic force microscopy
Nanocellulose
Colloidal probe
Force spectroscopy
Molecular dynamics
Water purification
Atomic Force Microscope (AFM) probes were successfully functionalized with two types of nanocellulose,
namely 2,2,6,6-tetramethylpiperidine-1-oxylradical (TEMPO)-mediated oxidized cellulose nanofibers (TOCNF)
and cellulose nanocrystals (CNC) and used to study interfacial interactions of nanocellulose with Cu(II) ions and
the Victoria blue B dye in liquid medium. TOCNF modified tip showed higher adhesion force due to adsorption
of Cu(II) ions and dye molecules compared to CNC ones. Exploring the adsorption properties through classical
reactive molecular dynamics simulations (ReaxFF) at the atomic scale confirmed that the Cu(II) ions promptly
migrated and adsorbed onto the nanocelluloses through the co-operative chelating action of carboxyl and hydroxyl species. The adsorbed Cu(II) ions showed the tendency to self-organize by forming nano-clusters of
variable size, whereas the dye adopted a flat orientation to maximize its adsorption. The satisfactory agreement
between the two techniques suggests that functionalized AFM probes can be successfully used to study nanocellulose surface interactions in dry or aqueous environment.
1. Introduction
In recent years, nanocellulose has been explored extensively as a
sustainable and versatile nanomaterial for several applications including water purification. (Ma, Hsiao, & Chu, 2011; Karim, Mathew,
Grahn, Mouzon, & Oksman, 2014; Voisin, Bergström, Liu, & Mathew,
2017). The interaction of nanocellulose surface with water pollutants is
a complex phenomenon combining different types of interactions, including, for example, van der Waals, electrostatic and hydrogen
bonding terms, and various mechanisms such as chelation, entrapments, local reactions, etc. Atomic force microscopy (AFM) is one of the
most powerful tool to study adsorption in nano and sub-nanoscale
through advanced topographical imaging (micro to sub-nanometer resolution) and force measurements (pico-newton sensitivity) in liquid
(Ducker, Senden, & Pashley, 1992; Weisenhorn, Hansma, Albrecht, &
Quate, 1989) with ad hoc customized tips to disclose new insights into
the interfacial interactions of different species. (Dufrêne, 2017; Kada,
Kienberger, & Hinterdorfer, 2008; Senapati & Lindsay, 2016; Valotteau
et al., 2017). AFM tips functionalization by gluing, (Kappl & Butt, 2002)
is extensively applied to micro-particles, (Kappl & Butt, 2002) such as
silica microspheres that are most widely used as colloidal probes, to
investigate surface interactions and forces (i.e. the adhesion force
against slide surfaces (Herman & Walz, 2015) and living cells
⁎
(McNamee, Pyo, & Higashitani, 2006), the hydrophobicity of sapphire
surfaces (Wada, Yamazaki, Isono, & Ogino, 2017) etc. or colloidal
probes such as polylactide particles (Nugroho, Pettersson, Odelius,
Höglund, & Albertsson, 2013) and microbubbles (Abou-Saleh, Peyman,
Critchley, Evans, & Thomson, 2013). In a previous study, we examined
the forces at the interface between microspheres of cellulose and Ag(I)
in wet conditions via force spectroscopy measurements (Zhu, Fang
et al., 2015). We found that the irregularity of the cellulose microspheres and their swelling in the aqueous medium affected the accuracy
of the measured interactions.
Chemical functionalization route (Barattin & Voyer, 2008; Frisbie,
Rozsnyai, Noy, Wrighton, & Lieber, 1994) is adopted to develop colloidal probes using smaller molecules, such as DNA (Möller, Csáki,
Köhler, & Fritzsche, 2000), antibodies (Ebner et al., 2007), biomolecules (Kumar et al., 2015; Senapati, Manna, Lindsay, & Zhang, 2013;
Wildling et al., 2011), single cell (Beaussart et al., 2014) etc., forming
direct chemical bonds to the tip apex (Green, Idowu, & Chan, 2003) and
have the purpose of disclosing specific binding events at the molecular
level and thus unveil single-molecule inter/intra-molecular interactions
(Alessandrini & Facci, 2005; Chtcheglova & Hinterdorfer, 2018;
Dufrêne et al., 2011; Mönig et al., 2016). Successful efforts for high
resolution AFM imaging were obtained using nanoparticle based colloidal probes too, for example, by placing single CdTe tetrapods on
Corresponding authors.
E-mail addresses: (C. Zhu), (S. Monti), (A.P. Mathew).
/>Received 22 July 2019; Received in revised form 22 September 2019; Accepted 19 October 2019
Available online 22 October 2019
0144-8617/ © 2019 The Authors. Published by Elsevier Ltd. This is an open access article under the CC BY-NC-ND license
( />
Carbohydrate Polymers 229 (2020) 115510
C. Zhu, et al.
flattened AFM tips (Nobile et al., 2008) and also by attaching to the tips
individual carbon nanotubes (Wilson & MacPherson, 2009; Wong,
Harper, Lansbury, & Lieber, 1998). One interesting development in this
context was the use of a nanofibrillar cellulose coating on the hemispherical polydimethylsiloxane caps as colloidal probe to study the
adhesion on biopolymer model surfaces (flat wood) (Gustafsson,
Johansson, Wågberg, & Pettersson, 2012). To the best of our knowledge, neither nanocellulose functionalized AFM probes nor force spectroscopy experiments using such probes for characterizing molecular
scale interactions are available to date. The aim of the current work is:
i) to develop AFM probes functionalized with nanocellulose; ii) to demonstrate their potential to evaluate nanocellulose surface interactions
forces with water pollutants, in situ in aqueous environment. In the
current investigation, we explore the surface interactions of nanoscaled cellulose nanofibers and nanocrystals with copper ions
(Shrivastava, 2009) and the Victoria blue B dye (VBB) (Karim et al.,
2014), which are two well-known toxic substances that can be found in
polluted water.
To support further the experimental characterization, molecular
modeling studies at the atomic level are carried out to unveil both the
structure and dynamics of TOCNF/CNC, metal ions and dyes. These
components are simulated realistically in a complex environment mimicking the experimental setup. The computational models and procedures have been already presented in an earlier work (Zhu, Monti, &
Mathew, 2018) where an archetypal hybrid system made of TOCNF
fibrils, CuSO4 ions and water, was used to investigate the ability of the
matrix to capture metal ions and the tendency to aggregate and form
mixed clusters. Here, the model is extended and modified to simulate
copper ions and dye molecules adsorption configurations and their
dynamics at the substrate interface.
2.2.2. Force measurements
The force measurement experiments were performed by a
Dimension Icon Atomic Force Microscopy (AFM; Bruker, Nanoscope
controller, Santa Barbara, California, USA). The electrochemistry contact mode was applied to take advantage of its quicker and convenient
operation when approaching the tip to the same location on the substrate in liquid medium, while the whole force measurements were
conducted under contact mode. The fluid probe holder and the protective skirt were used to prevent water leakage or damage to the
equipment. The probes were calibrated before functionalization, and
the deflection sensitivity values were updated during measurements.
The setup parameters were as follows: scan size 500 nm, scan rate 1 Hz,
ramp size 300 nm, trigger threshold 0.1 V, number of samples 2048, Z
closed loop on. All the force experiments used the same set up parameters. Each of the experiments collected 100–120 force curves and
was performed at least 3 times to ensure reproducibility. One set of
representative data was selected for discussion and comparison.
2.2.2.1. Metal ions interaction. The functionalized probe (TOCNF or
CNC probe) was loaded on the scanner followed by engaging it to the
mica surface. MQ water was added, and at least 100 curves were
collected. The water was then exchanged for Cu(NO3)2 solution for Cu
(II) adsorption to the TOCNF/CNC probe for 5 min. This exchange was
followed by the exchange of the Cu(NO3)2 solution with MQ water and
rinsing of the holder and sample with MQ water adequately to remove
free Cu(NO3)2. MQ water was added to the sample, and at least 100
force curves were collected. Baseline values were used to correct the
force curves, and calculations of all the forces were performed. The pull
off force values with histograms and normal distribution curves were
fitted with Gaussian curves to get the average adhesion force after
normalization with corresponding tip radius before and after
adsorption of Cu(II). Thus, the surface interaction between Cu(II) and
TOCNF/CNC was indirectly estimated based on the adhesion force
between the probe and mica in MQ medium with Cu(II) adsorption.
2. Experimental
2.1. Materials
2.2.2.2. Dye interaction. The Victoria blue B solution (50 mg/L) was
dropped onto the APTES modified mica surface and rinsed with MQ
water to remove free molecules. After drying in air, a layer of Victoria
blue B was homogeneously coated on mica and used for the force
measurement between the TOCNF/CNC and Victoria blue B. 100–120
force curves were first collected between the TOCNF/CNC probe and
mica and then between the TOCNF/CNC probe and Victoria blue B,
both in MQ water medium. The data were analyzed in the same way as
with the indirect method.
TEMPO-oxidized cellulose nanofibers (TOCNF; carboxyl content
1.0 mmol/g) and cellulose nanocrystal (CNC; carboxyl content
0.5 mmol/g) were prepared at Stockholm University, Sweden following
the procedure reported by Isogai et al (Isogai, Saito, & Fukuzumi, 2011)
and Mathew et al (Mathew et al., 2014) respectively. Three-component
solvent-free epoxy resin Araldite CY212 kit was purchased from Agar
Scientific Corporation (U.K.). Copper(II) nitrate hydrate, Victoria blue
B, (3-Aminopropyl) triethoxysilane (APTES) were all purchased from
Sigma-Aldrich, Germany and used as received. Milli-Q water was used
as the dispersion and force measurement medium. ScanAsyst Air probe
and SNL-10 probes were purchased from Bruker (USA) which were used
for imaging and tip functionalization, separately. All the probes were
cleaned in a UV/ozone chamber before modification. Mica sheets
(75 × 25 × 0.15 mm) were purchased from TAAB laboratories equipment Ltd, England. The mica was used both for the surface interaction
study for the case of Cu(II) and VBB. The AFM image of the mica surface
was shown in Fig. 6c.
2.3. Characterizations
2.3.1. Atomic Force Microscopy (AFM)
ScanAsyst Air probe (spring constant = 0.4 N/m) under ScanAsyst
mode was applied for nanocellulose, mica and Victoria Blue B surface
morphology imaging measurements. SNL-10 probes and the number B
cantilever with a spring constant of k = 0.12 ± 0.02 N/m (determined
by the thermal tune method (Kim, Choi, Kim, & Park, 2010) using the
built-in option in AFM software Nanoscope 9.1) was chosen and calibrated before tip functionalization and force measurements. All cantilevers were cleaned in a UV/ozone chamber for 20 min before modification. The collected data were processed with the NanoScope
Analysis 1.5 software (Bruker).
2.2. Methods
2.2.1. Probe functionalization
Chemical route is adopted for the probe functionalization. The
probes were placed in the AFM probe box, and 5 μL APTES was dropped
inside the box, which was then kept closed for 30 min.. The surface of
probes was homogeneously air coated with APTES vapor during this
process. Then, the TOCNF/CNC solution was dropped onto the probe
and incubated for 5 min. The probes were rinsed with MQ water at least
3 times to remove free TOCNF/CNC. The probes were investigated by
SEM to make sure that they were functionalized with TOCNF/CNC
properly. The functionalized probes were used for subsequent force
measurements.
2.3.2. Scanning electron microscopy – energy dispersive X-ray spectroscopy
(SEM-EDS)
The AFM probes with and without functionalization and the functionalized probes after force measurements were observed using scanning electron microscopy on a JEOL JSM-7000 F microscope (Japan).
The samples were placed on conductive carbon tape without any
coating to avoid damaging the nanocellulose functionalized on the
2
Carbohydrate Polymers 229 (2020) 115510
C. Zhu, et al.
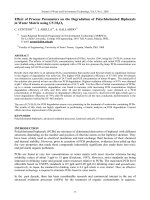
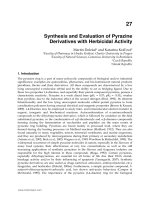
Fig. 1. Morphology of the nanocellulose and AFM probe. AFM images of TOCNF (a,) and CNC (b); SEM images of the clean AFM probe after calibration, side view of
the cantilever with tip (c), top view of the tip (d) and the corresponding side view of the tip after calibration showing tip radius of 15 nm (e), and the tip after
functionalized with CNC showing the tip radius of 19 nm measured by SEM (f).
ensemble, at 300 K and 1 atm, to prepare the supports for the subsequent simulations in crowded environments. The equilibrated models
were then used as initial configurations of the substrates in the simulations with copper ions, dyes, counterions and waters.
probes. Images were taken at 5 kV and 10 mm working distance was
used for the EDS measurements. Spot and map profiles showed the
elemental distribution on the samples surface. The functionalized
probes used for force measurements were investigated only after force
measurements to prevent any damage to the nanocellulose that may
have affected the force measurements. All AFM probes were imaged by
SEM after the experiments and inspected for defects, cracks, or evidence
of contamination.
2.4.2. Molecular dynamics simulations
Four multicomponent configurations were prepared and simulated
for hundreds of picoseconds until they reached their final equilibration.
They consist of one of the two supports (CNC or TOCNF), five molecules
of VBB with its respective Cl− counterions, or 32 Cu(II) ions with their
respective NO−
3 counterions and around two thousand water molecules.
The most crowded scenario contained about ten thousand atoms. No
restraints were introduced in the systems and reactivity was always
considered as the protonation and deprotonation of the carboxyl moieties and other possible reactions involving, for example, the hydroxyl
groups in response to the surrounding environment. All the MD simulations were performed with the Amsterdam Density Functional (ADF)/
ReaxFF (Baerends et al., 2016). The systems were first equilibrated in
the NVT ensemble and then at constant pressure and temperature
(T = 300 K, P = 1 atm) for about 300 ps. Subsequently, the production
dynamics were performed in the NVT ensemble for about 1 ns and
system structures were collected every 0.1 ps. Temperature and pressure were controlled through the Berendsen’s thermostat and barostat
(Berendsen, Postma, Van Gunsteren, Dinola, & Haak, 1984) with relaxation constants of 0.1 ps and the time step was set to 0.25 fs. Considering that we were interested in disclosing the characteristic adsorption of the metal ions and dye on each model substrate, and that
both dye molecules and metal ions were already near the supports at
the beginning of the simulations, the simulated production time span
was substantial to reach the final settlement. Thus, the analysis of the
sampled data was focused on the last portions of the trajectories, which
were obtained from several simulations with different starting positions
of Cu(II) ions and dye molecules in relation to the substrates (at a
distance of about 8 Å). The final analysis collects all the data of the MD
runs and tries to depict and predict the various tendencies of adsorption
2.4. Molecular modeling
2.4.1. Model building
The TOCNF/CNC structure is made of sixteen chains, containing
sixteen glucosyl residues each, arranged as a parallelepiped rod. Only
one facet, chosen to reproduce an infinite substrate, is functionalized
(TOCNF) with carboxyl groups and the infinite slab is obtained by replicating the system in x and y directions (periodic boundary conditions
– see Fig. S2). The size of the fibril is around 84 × 25 × 25 Å3.
Considering the type of support, we believe that the size we have
chosen is sufficient to simulate the variability of the environment and,
at the same time, to represent reasonably the experimental observations
at an affordable computational cost. Indeed, according to the experimental characterization the size of the cellulose nanofibers is widely
distributed (50–1000 Å) and the average diameter is around 380 Å.
This, in our modeling case, is equivalent to an infinite system.
The initial conformation of VBB was built by mutation of the ISIPEH
(CID) structure downloaded from the Cambridge Structural (Groom,
Bruno, Lightfoot, & Ward, 2016) and optimized at the M062X/6311+G** level. Before creating the complete configurations, the validity of the cellulose nano fibril models, namely CNC and TOCNF, and
their behaviour in water solution were checked by means of short
atomistic molecular dynamics (MD) simulations based on a ReaxFF
force field appropriately parametrized to describe these kinds of systems (see Ref.(Mathew et al., 2014) and references therein). Essentially,
these checks were pre-equilibrations of the systems in the NPT
3
Carbohydrate Polymers 229 (2020) 115510
C. Zhu, et al.
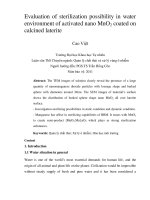
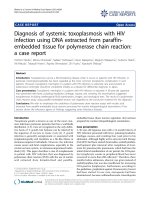
Fig. 2. AFM probes modified by chemical functionalization method using APTES as cross linker. AFM probes functionalized with TOCNF (top view: a and b, side
view: c) and CNC (top view: d and e, side view: f). The red cross (g and k) shows the tip apex and the corresponding EDS spectrum is displayed in j and n for TOCNF
and CNC, respectively. (h, i) and (l, m) represent the carbon and oxygen EDS maps on the TOCNF and CNC tips, respectively. The white broken lines indicate the
location of the visible nanofibers attached on the tip surface. (For interpretation of the references to colour in this figure legend, the reader is referred to the web
version of this article).
for the shorter CNC segments (less than 300 nm). This is clearly visible
in Fig. 1a-b where the diameters of a few representative TOCNF and
CNC samples are marked. The broad range of values appearing there,
testifies the well-known size distribution scenarios that are essentially
due to the processing procedures and sample preparation routes (Isogai
et al., 2011; Mathew et al., 2014).
The research was conducted focusing on two major stages: i) chemical functionalization methods to modify the AFM tips with the abovementioned cellulose nanofiber and cellulose nanocrystal, ii) investigation of the interactions between the AFM probes and metal ions/dyes.
on the supports in connection with experiments.
The examined descriptors are mainly atom-atom radial distribution
functions (RDFs), spatial distribution functions (SDFs) and hydrogen
bonds. However, visual inspection of the trajectories was fundamental
to understand the adsorption scenarios and evidence the different adsorption characteristics.
3. Results and discussion
3.1. Cellulose nanofiber and nanocrystal
3.2. Functionalization of AFM tips
The cellulose nanofibers (TOCNF, Fig. 1a) and nanocrystals (CNC,
Fig. 1b) decorated with carboxyl functional groups, displayed in Fig. 1,
were selected as representative species for tip functionalization. The
carboxyl group content in TOCNF (1.0 mmol/g) is twice that observed
in CNC (0.5 mmol/g). Beside the presence of carboxyl groups, which
are responsible for the greater adsorption capacity of TOCNF in relation
to CNC, major distinctions are found in the structural organization:
TOCNF are in the form of fibrils, composed of both ordered and disordered regions, whereas CNC are short and rod like chains, containing
only ordered structures (Nobile et al., 2008).
The nanocellulose diameters, determined from the height images (to
avoid the tip broadening effect), were in the range 1 to 3 nm for the
long TOCNF filaments (hundreds of nm to μm) and approximately 5 nm
Considering that surface interaction measurements require a sharp
AFM tip with a nanoscale apex, we have chosen a probe (SNL-10,
Bruker) with theoretical tip radius in a range between 2 and 12 nm,
which can be considered an ideal option. However, the tips are quite
easily worn and could become less sharp after scanning with force set
point even in nN range. Furthermore, the spring constant of the probes
varies among different batches. Therefore, we first calibrated the cantilevers to obtain a proper spring constant, and then examined them by
SEM (top and side view in Fig. 1c-e) to check the quality of the tip apex.
After calibration, the tip radius was around 15 nm as shown in Fig. 1e.
The parameters for each tip were collected and used for force
4
Carbohydrate Polymers 229 (2020) 115510
C. Zhu, et al.
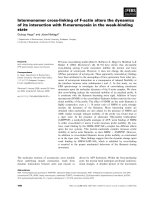
Fig. 3. Scheme of the probe functionalization and force measurement by indirect method. (a) AFM tip functionalization with TOCNF and CNC anchored using APTES.
(b) The force measurements using TOCNF/CNC probes on the mica substrates in a solution of Cu(II); The adsorption of Cu(II) by TOCNF/CNC-functionalized tips
through electrostatic interaction. The colour change of nanocellulose in b indicates that the Cu(II) ions were adsorbed on the surface of TOCNF/CNC.
functionalization with nanocellulose (Fig. 2j and n), in comparison with
the unmodified case (Fig. S1b and S1f), suggesting that nanocellulose
was attached on the tip apex (red cross). Indeed, the corresponding
carbon and oxygen EDS maps resulted in dense and homogeneous
distributions of these two elements (Fig. 2h–i and L-m) larger than those
obtained for the tip coated with APTES, (Fig. S1d-e). Thus, both SEM
images and EDS spectra indicate that the functionalization of the tips
with nanocellulose chains had taken place.
It is worth mentioning that from an operational point of view the
chemical functionalization procedure was simpler and more reproducible than the gluing method we have attempted (data not shown)
where the constant presence of impurities affected frequently the
quality of the results (Wildling et al., 2011). With the chemical method
the tip contamination was almost absent and the potential damage of
the tip apex could be avoided because the technique did not require tipsubstrate contacts. Furthermore, the unbound nanocellulose could be
removed from the surface by rinsing with MQ water after functionalization, leaving possibly a monolayer of TOCNF/CNC on the tip surface
as evidenced by the measure of the tip radius after modification. Taking
into account all these positive results, the probe modification by chemical functionalization is appropriate for investigating surface interaction/adhesion and performing force measurements.
measurements by the built-in software - Nanoscope Analysis 1.5
(Bruker, USA). The pull off forces were recorded and normalized by the
tip radius for the discussion of the adhesion force.
3.2.1. Chemical functionalization of probes
[(3-aminopropyl) triethoxysilane] (APTES) is being routinely used
for the chemical modification of the AFM tips. The modification is made
in the gas phase by silanization where only one ethoxy group reacts
with Si3N4 on the tip, whereas the other two are connected to the adjacent -OeSieOe groups and extend the -NH2 moieties far from the
surface (Chtcheglova & Hinterdorfer, 2018). On the basis of the characteristics of the surrounding environment, three types of reactions
between the tip anchored APTES and nanocellulose groups may be
expected: i) in weak acidic solution, the eOeSieOe chain could form
SieOH groups and bind the eOHs of nanocellulose ii) the Si−OH
groups could react with eCOOH of nanocellulose iii) the eNH2 groups
could form hydrogen bonds with eCOOH groups of nanocellulose.
These kinds of interactions can be all present in different proportions
depending on local conditions.
Fig. 2 displays the top and side views of both probes and tips after
functionalization with TOCNF/CNC. Fig. 2 shows the tip apex covered
with nanoscaled TOCNF and CNC which is expected to facilitate the
force measurements at the nanoscale. The tip apex with a diameter of
around 19 nm after functionalized with CNC is shown in Fig. 1f.
SEM in combination with Energy Dispersive X-Ray Spectroscopy
(SEM-EDS) was used to determine qualitatively/semi-quantitatively the
elemental composition of the tip apex and to prove its functionalization
with nanocellulose. Fig. S1a-f show the SEM-EDS spectrum, the maps of
the clean tip and the maps of the tip functionalized with APTES, while
Fig. 2g-n exhibit the data for the tip functionalized with TOCNF and
CNC. As expected, inspection of the EDS spectrum of the clean tip (Fig.
S1b) reveals that mainly silicon and nitrogen were present, being the
components of the used Si3N4 tip. The occurrence of oxygen is due to
the rapid decomposition and oxidation at room temperature on exposure of the silicon nitride surface to air (Fig. S1b). The spectrum
clearly shows the increased intensity of carbon and oxygen after
3.3. Surface interaction studies
Before starting the discussion, it is worth pointing out that in the
case of copper ions, the interaction between nanocellulose and the
substrate was evaluated indirectly by measuring the changes induced
on the modified tips by the adsorption of copper ions(indirect method),
whereas in the case of the dye (Victoria blue B) the interaction between
nanocellulose and dye could be directly detected because of the larger
size of the dye, its self-assembly ability and its anchoring to the substrate(direct method).
The interactions between the nanocellulose and amine head groups
from APTES on the Si3N4 tip surface stabilize the probe as shown by
similar studies found in literature (Corno et al., 2015; Dhamodharan &
5
Carbohydrate Polymers 229 (2020) 115510
C. Zhu, et al.
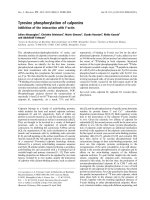
Fig. 4. Force spectroscopy data of the interaction of the metal ions with the nanocellulose functionalised probes and SEM images of the probes after force measurements. The representative force curves for the interaction between TOCNF probe and mica surface (a), zoom of the rectangular area (a1) and the representative
force curves between the CNC probe and mica surface (b), the zoom of the rectangular area (b1) are given. SEM images of the tip from TOCNF (a2) and CNC probes
(b2) after force measurements (top view) are shown. The histogram of the distribution of pull off forces for TOCNF probes before (c) and after (d) Cu(II) adsorption
and the corresponding normalized average adhesion force value (e);, the histogram of the distribution of pull off forces for CNC probes before (f) and after (g) Cu(II)
adsorption and the corresponding normalized average adhesion force (h).
the changes in interaction between nanocellulose functionalized probe
and a mica surface is measured in aqueous medium without and with
Cu(II) ions. The representative force curves are shown in Fig. 4a, a1, b,
b1 for the TOCNF and CNC cases, separately. To further evaluate the
stability of the functionalization, a cross-check of the TOCNF/CNC
probes was carried out by using SEM after force measurements. It was
found that the TOCNF/CNC particles remained on tip and tip apex
(Fig. 4a2 and b2). This confirms that the nanocellulose is anchored
strongly on the AFM probe through APTES and the interaction with
mica surface or the metal ions in the water do not detach them during
measurement.
As was shown in Fig. 4a1, the TOCNF probe cantilever approaches
the mica surface from point A and contacts the surface at point B with a
McCarthy, 1999; Wildling et al., 2011). Essentially, TOCNF/CNC engage their hydroxyls and/or carboxyl groups in hydrogen bonding interactions/salt bridges with the amine moieties of APTES. It was considered that tip modification involved only a small fraction of the
functional groups present on the TOCNF/CNC surface and thus the
groups sterically available after the initial functionalization process (see
Fig. 3a) could be reached by other “complementary” species dispersed
in the surrounding environment, which actively play the key role of
surface interaction towards the water pollutants.
3.3.1. Surface interactions between nanocellulose and copper(II)
The Cu(II) interaction with both TOCNF and CNC probes was experimental designed based Schematic representation in Fig. 3b where
6
Carbohydrate Polymers 229 (2020) 115510
C. Zhu, et al.
as the noise is usually more pronounced during interaction with micro
sized, round particles (Zhu, Dobryden et al., 2015) and some large
molecule-functionalized probes (Kumar et al., 2015; Möller et al.,
2000). This is because microparticles have a larger contact area, which
makes pull off more complex and delayed than a sharp tip; furthermore,
the micro sized cellulose particles are more prone to swelling in the
liquid medium and change of stiffness. This induces a deformation
when the particles are in contact with the surface, leads to longer separations and produces considerable noise during pulling off from the
surface.
repulsive force until it reaches point C. Then the tip starts to retract
from the surface but still remains in contact with the surface due to
attractive forces until point D, which shows the maximum pull off force.
Finally, the tip leaves the surface and loses the contact at point E. The
pull off forces were collected and converted to adhesion forces by
normalizing them with respect to the tip radius (Fig. 4a2 and b2).
The TOCNF probe interacting with mica in the aqueous medium
(Fig. 4a and a1) shows low repulsion forces at distances around 2 nm,
which are much shorter than the ones considered in an earlier study at
the micro scale (separation distance around 100 nm) (Zhu, Dobryden
et al., 2015) and could be ascribed to the presence of the week doublelayer repulsion (higher than the Van der Walls attraction) arising from
negative charges on the mica surfaces and the TOCNF chains on the
probe. The retraction curve was very clear and sharp, showing an
average adhesion force around 6.7 mN/m (Fig. 4i). We could speculate
that the main interactions of TOCNF and CNC with the mineral surface
are between the oxygens/K+ ions on mica and the hydroxyl/carboxyl
groups of the TOCNF/CNC chains (Das & Bhattacharjee, 2005; Pezron,
Pezron, Claesson, & Malmsten, 1991), leading to the adhesion force.
In the presence of Cu(II) ions, no repulsive forces were measured
during the approach path except for a large snap-in at a separation of
about 7 nm (Fig. 4a), indicating an attractive force of approximately
1 nN, which is the combination of electrostatic attraction and Van der
Walls attraction. The pull off forces mainly fall in the range of 1–2 nN,
which is much lower compared with the forces (2–6 nN) measured by
us using cellulose microsphere probes in a similar experimental setup
(Zhu, Dobryden et al., 2015). After normalization, the adhesion force
between the nanocellulose probe and the mica surface observed after
adsorption of Cu(II) (Fig. 3) increased from 7.3 to 15.1 mN/m (Fig. 4e).
This difference could be mainly ascribed to electrostatic interactions
between the positively charged Cu(II) and the negatively charged surface of mica (Sides, Faruqui, & Gellman, 2009). It could be inferred that
after adding Cu(II) to the system, the copper ions quickly migrate onto
the nanocellulose probe (Fig. 3) and re-modulated the total charge of
TOCNF on the tip (Zhu, Liu, & Mathew, 2017). It is also important to
consider that, mica (muscovite) with K+ ions (Monti, Alderighi, Duce,
Solaro, & Tiné, 2009) can strongly interact with Cu(II) ions in mild
acidic water solutions through various mechanisms, such as outer- and
inner-sphere complexation, ion exchange, precipitation, that could also
occur in combination (Farquhar, Vaughan, Hughes, Charnock, &
England, 1997). Moreover, copper ions can induce the release of K+
ions from mica in solution and also replace them. The measured retraction curve was close to the baseline at zero force, and showed a low
noise levels after pull off. This suggests that the Cu(II) adsorption
forming Cu(II) clusters on the surface of TOCNF (Zhu et al., 2018) led to
a softer tip apex and a weaker elastic force between the interacting
chains.
Similar interactions were observed for the CNC system and the representative force curves were displayed in Fig. 4b. A repulsive phenomenon is observed during approach in the TOCNF case (Fig. 4a1),
whereas a snap in was observed in the approaching curve in the case of
CNC (Fig. 4b1). As mentioned, the carboxyl group content in TOCNF is
twice as much as that present in the CNC. Thus, the double layer repulsive force is lower in the CNC case, whereby the van der Walls attraction dominates the interaction, leading to the jump to contact effect. It is apparent that the normalized adhesion force between the CNC
probe and the mica surface increases from 3.3 to 6.2 mN/m due to the
adsorption of Cu(II) (Fig. 4h). This is attributed to the intermolecular
interactions between CNC with captured Cu(II) ions and the negatively
charged mica surface. Instead, in the case of CNC, which contained a
lower number of carboxyl groups, the adhesion strength was lower. No
significant noise could be detected from the retract curve indicating
that the adsorption of Cu(II) and the Cu(II) clusters was lower than that
observed in the TOCNF case. Owing to the sharp tip apex even after
modification with nanocellulose, the noise level was almost avoided in
all the subsequent measurements. This was a significant improvement
3.3.2. Molecular dynamics simulations
The molecular modeling description at the atomic level was very
helpful and capable of giving a more complete view of the characteristic
features of the nanocellulose materials responsible for the capturing
process of ions/dyes, which is usually due to the cooperation of the
carboxyl and hydroxyl groups of the biopolymers’ chains.
A first interesting data emerging from the simulations, was the
confirmation of the negatively charge character of the TOCNF/CNC
matrices, obtained through the evaluation of the individual atomic
charges of the interfaces and their sums in the final average configurations. It was found that in response to the environment, i.e. to the
adsorption of metal ions and dyes, all the matrices were negatively
charged with TOCNF three times more negative than CNC due to the
presence of the carboxyl groups. In addition, all the models were well
solvated by the surrounded water and showed the tendency to inflate or
swell. This was confirmed by the increasing root mean squared deviations of the carbon atoms of the chains in relation to the more compact
arrangements of the starting configurations. Indeed, the average final
values were stabilized in 8–11 Å range. Regarding TOCNF/CNC interactions with the Cu(II) ions, it was observed that cation adsorption took
place effectively, as confirmed by the sharp peaks at short distances
visible in all the plots of the radial distribution functions (RDFs) between the Cu(II) ions and the oxygen atoms of the supports (Fig. 5).
Although at the beginning of the simulations all the metal ions were
wandering in solution, relatively far from the cellulose interface, during
the simulations they had the tendency to migrate toward the substrates
and, at the end of the simulations, they were found in contact with the
nanocellulose chains, accommodated on top of the surface and strongly
connected to the carboxyl groups of TOCNF or entrapped by the concerted action of the different oxygen species of the CNC chains (Fig. 5).
Essentially, they were stably adsorbed and could also be organized in
small clusters of various sizes and shapes depending on their relative
locations. Further evidence was obtained by inspecting the spatial
distribution functions that testified the permanence of the ions in their
final locations.
3.3.3. Surface interactions between nanocellulose and Victoria blue B
Moving to the investigation of the adsorption of the VBB dye on
TOCNF and CNC, we performed a series of surface interaction studies
that consisted in measuring directly the forces between nanocellulose
and the dye.
The height images of the modified VBB-mica surfaces showed that
the VBB molecules were aggregated in very small nanoparticles and
were anchored onto mica (Fig. 6(d)). After surface modification, the
average surface roughness increased from 0.11 to 0.18 nm (Fig. 6(d)),
indicating that a layer of VBB was anchored on the mica substrate. This
resulted in a relatively homogenous positively charged surface for force
measurements. In parallel, MD simulations, in the complex environment described in the Materials section, were carried out to reproduce
the dynamics of the dye in relation to binding modes on the substrate as
well as the nanocellulose for comparison with the experiments. Interestingly, it was found that the dye could self-assemble and form stacked
and T-shaped complexes, both in solution and when in contact with the
support. The model also suggested that the dye aggregates contain a
great variety of mixed stacked-T-shaped complexes with a positively
7
Carbohydrate Polymers 229 (2020) 115510
C. Zhu, et al.
Fig. 5. Top Left. Normalized atom-atom Radial Distribution Functions of the adsorption of the Cu(II) ions on CNC and TOCNF. Cu ions are represented by orange
spheres; oxygen, hydrogen and carbon atoms are rendered through red, white and grey sticks, respectively. CNC and TOCNF (bottom left and right) supports are
represented by means of solvent accessible surfaces (solid or mesh contours) colored according to the atom type. All the oxygen atoms of the supports have been
considered and also Cu(II) - Cu(II) RDFs have been calculated to have an idea of the ion clustering tendency. This is apparent in the case of TOCNF where low peaks at
shorter distances are present. Right hand side: A few arrangements of the adsorbed Cu(II) ions are shown for the CNC (top) and TOCNF (Bottom: left and right)
supports. A few water molecules are displayed to underline the fact that the ions could be partially solvated. In the case of TOCNF they can be entrapped by the
concerted action of hydroxyl and carboxyl groups. Water molecules, counterions and portions of CNC and TOCNF substrate have been undisplayed for clarity. (For
interpretation of the references to colour in this figure legend, the reader is referred to the web version of this article).
Fig. 6. Scheme of the force measurement by direct method (a) showing Victoria Blue B(VBB) anchored on the substrate (mica) surface and the force measurement
between TOCNF and CNC modified probes and VBB on mica surface in MQ water. The interaction between TOCNF/ CNC and VBB is represented in the image (b). (c)
and (d) are the AFM images of mica and dye modified surface on mica, respectively. Ra stands for average surface roughness. e) Molecular structure of Victoria Blue B
in water. (For interpretation of the references to colour in this figure legend, the reader is referred to the web version of this article).
8
Carbohydrate Polymers 229 (2020) 115510
C. Zhu, et al.
Fig. 7. Force spectroscopy of the interaction of the dye with the nanocelluose functionalised probes and SEM images of the probes after force measurements.
Representative force curves between TOCNF probe with clean mica surface and VBB surface (a), is the zoom of the rectangular area (a1), representative force curves
between CNC probe with clean mica surface and the VBB surface (b), (b1) is the zoom of the rectangular area. SEM images of the tip from TOCNF (a2) and CNC
probes (b2) after force measurements are shown. The histograms of the distribution of pull off forces of TOCNF functionalised probe with mica (c) and VBB surface
(d) and the corresponding average adhesion force value after normalization (e) and the histograms of the distribution of pull off forces of CNC functionalised probes
toward mica (f) and VBB surface (g). Corresponding average adhesion force value after normalization (h).
layer and van der Walls attractions could contribute for the snap-in
phenomenon.
During retraction, the forces between probes and surfaces are of
different nature and include electrostatic, hydrophobic and van der
Waals interactions, which could play concertedly important roles in
attracting the probe during retraction. The VBB dye has not only a
cationic character but also a hydrophobic nature (Steele, Wright,
Nygren, & Hillier, 2000). In the case of TOCNF, the average normalized
adhesion force increased from 1.3 to 11.0 mN/m (Fig. 7e), indicating a
strong electrostatic attraction of the probe to the substrate surface
(Fig. 7a1, retract curve). The same mechanism occurred with the CNC
system, where the average adhesion force (normalized) increased from
3.7 to 9.2 mN/m (Fig. 7h). The reduced magnitude of the adhesion
force for the CNC case is caused by the lower content of functional
charged character and had the tendency to orient the nitrogens, towards the solvent (Fig. 6 and Fig. S2).
Once VBB was anchored on mica, the direct interaction of VBB with
nanocellulose (Fig. 6(a)(b)) was demonstrated by the force curves displayed in Fig. 7(a),(b). The SEM images of the probes after force
measurements shown in Fig. 7a2 and b2 indicate that the cellulose
nanoparticles remained on the tip, confirming the stability of the probes
functionalized by the chemical method.
Compared with the force curves recorded for the interaction between nanocellulose and mica, the separation distance increased from 1
to 3 nm, and a clear snap-in is shown in the approach curve. This indicates that the electrostatic attraction between the negatively charged
nanocellulose and positively charged dye dominated the interaction
and attracted the tip towards to the surface. However, both double
9
Carbohydrate Polymers 229 (2020) 115510
C. Zhu, et al.
contours located close to the supports) in both cases but seems more
mobile when in contact with TOCNF. This could be due to the increased
negative charge of the substrate and its redistribution on the interface
that perturbs not only the molecular orientation but also the locations
of the counterions. Indeed, it is well apparent in the pictures that due to
these cooperative effects not only the molecules are driven towards
different locations on the surface but also the ions escape far from the
support into the solvent (green areas extending into the solvent).
Besides lying on the CNC or TOCNF interfaces the dyes can be found in
perpendicular arrangements self-interacting by means of their stacked
or T-shaped rings. These types of orientation contribute to the formation of molecular aggregates (displayed in Fig. S5) and also agrees well
with the findings of VBB aggregates showed in Fig. 6d. Thus, the simulation results well reflect and confirm the discussion of the experimental counterpart.
groups in relation to TOCNF.
To the best of our knowledge, only a few AFM studies on surface
interactions and adhesion force measurements through cellulose based
materials were reported in the literature. For example, a pull-off force
of around 2–3 nN in dilute salt solutions was first measured between
silica and cellulose in the presence of 20 ppm poly[[2-(propionyloxy)
ethyl]trimethylammonium chloride] by Holmberg et al in 1997
(Holmberg, Wigren, Erlandsson, & Claesson, 1997). In 2013, the procedure was modified and improved by Saimi et al to measure the adhesion force (in the range of 1–7 mN/m) between a cellulose microsphere and flat cellulose thin film (Olszewska, Valle-Delgado,
Nikinmaa, Laine, & Österberg, 2013). Nanocellulose, coated on a
spherical carrier, was recently employed to study the adhesion between
carbon based materials (1–8 mN/m) (Hajian, Lindström, Pettersson,
Hamedi, & Wågberg, 2017) and wood biopolymers (80 mN/m)
(Gustafsson et al., 2012). Interaction studies of cellulose based materials with water contaminants were reported only by our group and in
2015 (Shrivastava, 2009) where we disclosed cellulose microspheres
surface interactions with Ag(I) ions. In the current work we have
greatly improved the method by functionalizing the probes with nanocellulose using chemical method and expanded the application to
other metal ions and dyes to derive reliable and quantitative data.
It may be noted that during the force measurements there is the risk
that, the copper ions adsorbed on nanocellulose and dye adsorbed on
mica may desorb into the aqueous solution, or the positively charged
dye molecules might transfer to the negatively charged probe during
contact. However, this was prevented by adequately rinsing the system
during sample preparation, removing all of the free and loosely attached metal ions and dyes on nanocellulose and mica. All data presented here are based on the assumption that the anchored layers are
stable during the measurements.
4. Conclusions
To advance the growing interest to use nanocellulose in water
purification as a sustainable technology and to increase the understanding on the adhesion forces and interaction mechanisms between
nanocellulose and water pollutants we used colloidal probe technique
and molecular dynamics simulation methods. Two representative nanocelluloses with carboxyl surface groups have been successfully
functionalized on the sharp AFM probe tips with tip radius below 20 nm
by a chemical modification method. In the case of metal ions and dyes
the normalized adhesion force was higher for tempo CNF compared to
CNC, which was expected due to higher functional group content in the
former and in turn confirms the applicability of the nanocellulose
functionalized probe for force spectroscopy. The highly promising AFM
probes functionalized with nanocellulose could open new possibilities
for colloidal probe force spectroscopy technique and could be further
employed for recognition imaging and diagnostics (Barattin & Voyer,
2008; Senapati & Lindsay, 2016) in nano and biotechnology.
The interactions with metal ions were further explained by MD simulations, which reproduced the recognition and adsorption mechanism dominated by electrostatic interactions. The simulations
identified characteristic arrangements where the molecules of the dyes
were aligned perpendicular to the substrates and organized in cluster
structures. The surface interactions between the nanocellulose disclosed
a flat orientation of the dye on the TOCNF/CNC, adopted to maximize
the adsorption and also promote stacking. In the case of metal ions as
well as dyes the clustering or aggregation directed by functional sites on
nanocellulose was in perfect agreement with the experiments. We aim
to extend this approach of employing colloidal probe technique combined with MD simulation to study nanocellulose interactions with
other water contaminants (pesticides, drugs, other potentially charged
and uncharged entities), foulants (bovine serum albumin, humic acid),
bio-species (DNA, protein, blood cells) and polymers (PLA, chitosan)
etc.
3.3.4. Molecular dynamics simulations
Starting from random arrangements of the dye molecules in solution
relatively close to the supports, migration, adsorption on the interfaces
and a marked tendency to self-assemble was observed. The final adsorbed structures were identified through visual inspection and distance evaluations. Also, in this case, RDFs were useful to disclose preferential interactions of the various groups of the molecules in relation
to carboxyl and hydroxyl moieties of CNC and TOCNF. The adsorption
on all the substrates was confirmed by the presence of sharp peaks at
short distances in the RDFs (Fig. 8). The broad peaks reflect the range of
nearest-neighbor distances between the selected atoms. The broad
trend indicates little inter-atomic ordering, whereas the sharp peaks at
short-distances testify the tendency to local coordination, that is hydrogen bonds between N and OH groups or NH and O atoms. Examining
the RDF plots of the VBB nitrogen atoms (Fig. 8) it can be noticed that
these were hydrogen bonded to the hydroxyl groups of the supports
(black peaks centered at around 2.8 Å) both in the CNC and TOCNF
models but also solvated by water molecules as demonstrated by in blue
plots in Fig. 8 indicating water molecules directly hydrogen bonded to
the VBB nitrogens (peaks at 2.8 Å). A second water shell is also visible,
is located at about 4.7 Å and solvent exchange between the two shells is
active.
Three dimensional iso-surfaces identifying regions most probably
occupied by the nitrogen, atoms of the dye (spatial distribution functions - SDFs) during the production simulations are shown in Figs. S3
and S4. The contour density (1.5 times larger than the average solvent
density) was chosen in such a way that from those scenarios could
emerge a clear picture of the adsorbate behaviour at the cellulose
based-material interface and it was visualized on an average configuration calculated from the last portion (100 structures) of the production trajectories. Due to averaging the model can be in some sections unphysical.
The comparison of the SDFs of VBB on CNC and TOCNF (Figs. S3
and S4) indicates that the dye is stably adsorbed on the matrices (N
Declaration of Competing Interest
The authors declare no competing financial interest.
Acknowledgements
The authors gratefully acknowledge the financial support of the
Swedish research council (VR, grant No: 621-2013-5997 and 201704254) and Knut and Alice Wallenberg Foundation under Wallenberg
Wood Science Centre (WWSC). We thank Liu, Y. and Naseri, N. who
kindly provided the TOCNF and CNC, respectively, from Stockholm
University, Sweden. Zhu, C. is especially grateful to Fielden, M. at the
Royal Institute of Technology (KTH) Sweden for his technical support
and fruitful discussion on force spectroscopy measurements. The Nano
lab in AlbaNova university center is also acknowledged for providing
10
Carbohydrate Polymers 229 (2020) 115510
C. Zhu, et al.
Fig. 8. Left hand side: Normalized RDFs of the adsorption of VBB on the two support types. Only the nitrogen atom of the dye has been considered and its RDFs with
all the oxygen types included in the systems have been calculated. Right hand side: Representative configurations where the dyes have maximum interactions with
the support lying flat on them. The molecules could be interconnected through stacked or T-shape interactions. VBB are rendered with sticks; nitrogen, oxygen,
hydrogen and carbon atoms are blue, red, white and grey, respectively. CNC and TOCNF supports are represented by means of solvent accessible surfaces (solid
contours) colored according to the atom type. Water molecules, counterions and portions of CNC and TOCNF substrate have been undisplayed for clarity. (For
interpretation of the references to colour in this figure legend, the reader is referred to the web version of this article).
the AFM facilities.
Dufrêne, Y. F. (2017). Microbial nanoscopy: Breakthroughs, challenges, and opportunities. ACS Nano, 11(1), 19–22.
Dufrêne, Y. F., Evans, E., Engel, A., Helenius, J., Gaub, H. E., & Müller, D. J. (2011). Five
challenges to bringing single-molecule force spectroscopy into living cells. Nature
Methods, 8, 123–127.
Baerends, E. J., et al. (2016). (n.d.) In E. J. Baerends (Ed.). 106 SCM, theoretical chemistry.
Amsterdam, The Netherlands: Vrije Universiteit.
Ebner, A., Wildling, L., Kamruzzahan, A. S. M., Rankl, C., Wruss, J., Hahn, C. D., et al.
(2007). A new, simple method for linking of antibodies to atomic force microscopy
tips. Bioconjugate Chemistry, 18(4), 1176–1184.
Farquhar, M. L., Vaughan, D. J., Hughes, C. R., Charnock, J. M., & England, K. E. R.
(1997). Experimental studies of the interaction of aqueous metal cations with mineral
substrates: Lead, cadmium, and copper with perthitic feldspar, muscovite, and biotite. Geochimica et Cosmochimica Acta, 61(15), 3051–3064.
Frisbie, C. D., Rozsnyai, L. F., Noy, A., Wrighton, M. S., & Lieber, C. M. (1994). Functional
group imaging by chemical force microscopy. Science, 265(5181), 2071–2074.
Green, J. B. D., Idowu, A., & Chan, S. S. F. (2003). Modified tips: Molecules to cells.
Materials Today, 6(2), 22–29.
Groom, C. R., Bruno, I. J., Lightfoot, M. P., & Ward, S. C. (2016). The Cambridge structural database. Acta Crystallographica Section B, Structural Science, Crystal Engineering
and Materials, 72(2), 171–179.
Gustafsson, E., Johansson, E., Wågberg, L., & Pettersson, T. (2012). Direct adhesive
measurements between wood biopolymer model surfaces. Biomacromolecules, 13(10),
3046–3053.
Hajian, A., Lindström, S. B., Pettersson, T., Hamedi, M. M., & Wågberg, L. (2017).
Understanding the dispersive action of nanocellulose for carbon nanomaterials. Nano
Letters, 17(3), 1439–1447.
Herman, D., & Walz, J. Y. (2015). Forces and force-scaling in systems of adsorbing nanoparticles as measured using colloidal probe atomic force microscopy. Colloids and
Surfaces A, Physicochemical and Engineering Aspects, 482, 165–176.
Holmberg, M., Wigren, R., Erlandsson, R., & Claesson, P. M. (1997). Interactions between
cellulose and colloidal silica in the presence of polyelectrolytes. Colloids and Surfaces
A, Physicochemical and Engineering Aspects, 129, 175–183.
Isogai, A., Saito, T., & Fukuzumi, H. (2011). TEMPO-oxidized cellulose nanofibers.
Nanoscale, 3(1), 71–85.
Kada, G., Kienberger, F., & Hinterdorfer, P. (2008). Atomic force microscopy in bionanotechnology. Nano Today, 3(1–2), 12–19.
Kappl, M., & Butt, H.-J. (2002). The colloidal probe technique and its application to
adhesion force measurements. Particle & Particle Systems Characterization, 19(3),
Appendix A. Supplementary data
Supplementary material related to this article can be found, in the
online version, at doi: />References
Abou-Saleh, R. H., Peyman, S. A., Critchley, K., Evans, S. D., & Thomson, N. H. (2013).
Nanomechanics of lipid encapsulated microbubbles with functional coatings.
Langmuir, 29(12).
Alessandrini, A., & Facci, P. (2005). AFM: A versatile tool in biophysics. Measurement
Science & Technology, 16(6), R65–R92.
Barattin, R., & Voyer, N. (2008). Chemical modifications of AFM tips for the study of
molecular recognition events. Chemical Communications, 13, 1513–1532.
Beaussart, A., El-Kirat-Chatel, S., Sullan, R. M. A., Alsteens, D., Herman, P., Derclaye, S.,
et al. (2014). Quantifying the forces guiding microbial cell adhesion using single-cell
force spectroscopy. Nature Protocols, 9(5), 1049–1055.
Berendsen, H. J. C., Postma, J. P. M., Van Gunsteren, W. F., Dinola, A., & Haak, J. R.
(1984). Molecular dynamics with coupling to an external bath. The Journal of
Chemical Physics, 81(8), 3684–3690.
Chtcheglova, L. A., & Hinterdorfer, P. (2018). Simultaneous AFM topography and recognition imaging at the plasma membrane of mammalian cells. Seminars in Cell &
Developmental Biology, 73, 45–56.
Corno, M., Delle Piane, M., Monti, S., Moreno-Couranjou, M., Choquet, P., & Ugliengo, P.
(2015). Computational study of acidic and basic functionalized crystalline silica
surfaces as a model for biomaterial interfaces. Langmuir, 31(23), 6321–6331.
Das, P. K., & Bhattacharjee, S. (2005). Electrostatic double layer force between a sphere
and a planar substrate in the presence of previously deposited spherical particles.
Langmuir, 21(10), 4755–4764.
Dhamodharan, R., & McCarthy, T. J. (1999). Adsorption of alginic acid and chondroitin
sulfate-A to amine functionality introduced on polychlorotrifluoroethylene and glass
surfaces. Macromolecules, 32(12), 4106–4112.
Ducker, W. A., Senden, T. J., & Pashley, R. M. (1992). Measurement of forces in liquids
using a force microscope. Langmuir, 8(7), 1831–1836.
11
Carbohydrate Polymers 229 (2020) 115510
C. Zhu, et al.
Senapati, S., Manna, S., Lindsay, S., & Zhang, P. (2013). Application of catalyst-free click
reactions in attaching affinity molecules to tips of atomic force microscopy for detection of protein biomarkers. Langmuir, 29(47), 14622–14630.
Shrivastava, A. K. (2009). A review on copper pollution and its removal from water
bodies by pollution control technologies. Indian Journal of Environmental Protection,
29(6), 552–560.
Sides, P. J., Faruqui, D., & Gellman, A. J. (2009). Dynamics of charging of muscovite
mica: Measurement and modeling. Langmuir: The ACS Journal of Surfaces and Colloids,
25(3), 1475–1481.
Steele, H. M., Wright, K., Nygren, M. A., & Hillier, I. H. (2000). Interactions of the (001)
surface of muscovite with Cu(II), Zn(II), and Cd(II): A computer simulation study.
Geochimica et Cosmochimica Acta, 64(2), 257–262.
Valotteau, C., Prystopiuk, V., Pietrocola, G., Rindi, S., Peterle, D., De Filippis, V., et al.
(2017). Single-cell and single-molecule analysis unravels the multifunctionality of the
staphylococcus aureus collagen-binding protein Cna. ACS Nano, 11(2), 2160–2170.
Voisin, H., Bergström, L., Liu, P., & Mathew, A. (2017). Nanocellulose-based materials for
water purification. Nanomaterials, 7(3), 57–69.
Wada, T., Yamazaki, K., Isono, T., & Ogino, T. (2017). Characterization of local hydrophobicity on sapphire (0001) surfaces in aqueous environment by colloidal probe
atomic force microscopy. Applied Surface Science, 396, 1206–1211.
Weisenhorn, A. L., Hansma, P. K., Albrecht, T. R., & Quate, C. F. (1989). Forces in atomic
force microscopy in air and water. Applied Physics Letters, 54(26), 2651–2653.
Wildling, L., Unterauer, B., Zhu, R., Rupprecht, A., Haselgrübler, T., Rankl, C., et al.
(2011). Linking of sensor molecules with amino groups to amino-functionalized AFM
tips. Bioconjugate Chemistry, 22(6), 1239–1248.
Wilson, N. R., & MacPherson, J. V. (2009). Carbon nanotube tips for atomic force microscopy. Nature Nanotechnology, 4(8), 483–491.
Wong, S. S., Harper, J. D., Lansbury, P. T., & Lieber, C. M. (1998). Carbon nanotube tips:
High-resolution probes for imaging biological systems. Journal of the American
Chemical Society, 120(3), 603–604.
Zhu, C., Dobryden, I., Rydén, J., Öberg, S., Mathew, A. P., & Holmgren, A. (2015).
Adsorption behavior of cellulose and its derivatives toward Ag(I) in aqueous medium:
An AFM, spectroscopic, and DFT study. Langmuir, 31(45), 12390–12400.
Zhu, C., Liu, P., & Mathew, A. P. (2017). Self-assembled TEMPO cellulose nanofibers:
Graphene oxide-based biohybrids for water purification. ACS Applied Materials &
Interfaces, 9(24), 21048–21058.
Zhu, C., Monti, S., & Mathew, A. P. (2018). Cellulose nanofiber-graphene oxide biohybrids: Disclosing the self-assembly and copper-ion adsorption using advanced microscopy and ReaxFF simulations. ACS Nano, 12(7), 7028–7038.
Zhu, H., Fang, Z., Wang, Z., Dai, J., Yao, Y., Shen, F., et al. (2015). Extreme light management in mesoporous wood cellulose paper for optoelectronics. ACS Nano, 10(1),
1369–1377.
129–143.
Karim, Z., Mathew, A. P., Grahn, M., Mouzon, J., & Oksman, K. (2014). Nanoporous
membranes with cellulose nanocrystals as functional entity in chitosan: Removal of
dyes from water. Carbohydrate Polymers, 112(0), 668–676.
Kim, M. S., Choi, J. H., Kim, J. H., & Park, Y. K. (2010). Accurate determination of spring
constant of atomic force microscope cantilevers and comparison with other methods.
Measurement, 43(4), 520–526.
Kumar, R., Ramakrishna, S. N., Naik, V. V., Chu, Z., Drew, M. E., Spencer, N. D., et al.
(2015). Versatile method for AFM-tip functionalization with biomolecules: Fishing a
ligand by means of an in situ click reaction. Nanoscale, 7(15), 6599–6606.
Ma, H., Hsiao, B. S., & Chu, B. (2011). Ultrafine cellulose nanofibers as efficient adsorbents for removal of UO22+ in water. ACS Macro Letters, 1(1), 213–216.
Mathew, A. P., Oksman, K., Karim, Z., Liu, P., Khan, S. A., & Naseri, N. (2014). Process
scale up and characterization of wood cellulose nanocrystals hydrolysed using
bioethanol pilot plant. Industrial Crops and Products, 58, 212–219.
McNamee, C. E., Pyo, N., & Higashitani, K. (2006). Atomic force microscopy study of the
specific adhesion between a colloid particle and a living melanoma cell: Effect of the
charge and the hydrophobicity of the particle surface. Biophysical Journal, 91(5),
1960–1969.
Möller, R., Csáki, A., Köhler, J. M., & Fritzsche, W. (2000). DNA probes on chip surfaces
studied by scanning force microscopy using specific binding of colloidal gold. Nucleic
Acids Research, 28(20).
Mönig, H., Hermoso, D. R., Arado, O. D., Todorovic, M., Timmer, A., Schüer, S., et al.
(2016). Submolecular imaging by noncontact atomic force microscopy with an
oxygen atom rigidly connected to a metallic probe. ACS Nano, 10(1), 1201–1209.
Monti, S., Alderighi, M., Duce, C., Solaro, R., & Tiné, M. R. (2009). Adsorption of ionic
peptides on inorganic supports. The Journal of Physical Chemistry C, 113(6),
2433–2442.
Nobile, C., Ashby, P. D., Schuck, P. J., Fiore, A., Mastria, R., Cingolani, R., et al. (2008).
Probe tips functionalized with colloidal nanocrystal tetrapods for high-resolution
atomic force microscopy imaging. Small, 4(12), 2123–2126.
Nugroho, R. W. N., Pettersson, T., Odelius, K., Höglund, A., & Albertsson, A. C. (2013).
Force interactions of nonagglomerating polylactide particles obtained through
covalent surface grafting with hydrophilic polymers. Langmuir, 29(28), 8873–8881.
Olszewska, A., Valle-Delgado, J. J., Nikinmaa, M., Laine, J., & Österberg, M. (2013).
Direct measurements of non-ionic attraction and nanoscaled lubrication in biomimetic composites from nanofibrillated cellulose and modified carboxymethylated
cellulose. Nanoscale, 5(23), 11837–11844.
Pezron, I., Pezron, E., Claesson, P. M., & Malmsten, M. (1991). Temperature-dependent
forces between hydrophilic mica surfaces coated with ethyl hydroxyethyl cellulose.
Langmuir, 7(10), 2248–2252.
Senapati, S., & Lindsay, S. (2016). Recent progress in molecular recognition imaging
using atomic force microscopy. Accounts of Chemical Research, 49(3), 503–510.
12