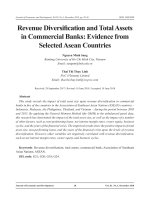
Income diversification and profitability of Vietnamese commercial banks
Bạn đang xem bản rút gọn của tài liệu. Xem và tải ngay bản đầy đủ của tài liệu tại đây (338.63 KB, 6 trang )
74
Nguyen Thanh Dat, Cao Thi Linh
INCOME DIVERSIFICATION AND PROFITABILITY OF VIETNAMESE
COMMERCIAL BANKS
Nguyen Thanh Dat*, Cao Thi Linh
The University of Danang - University of Economics
*Corresponding author:
(Received: July 31, 2022; Accepted: August 19, 2022)
Abstract - The paper aims to investigate the impact of income
diversification on commercial banks’ profitability in Vietnam.
Using a panel data set of 33 Vietnamese commercial banks during
the period from 2006 to 2020, the empirical analysis shows the
more diverse in revenue sources, the higher banks’ financial
performance. The research provides some recommendations that
banks should look forward to diversifying their income,
particularly income from non-traditional activities, in order to
improve competitiveness, reduce risk, and raise profitability and
policies that encourage banks to diversify their incomes should be
enacted. This will not only be beneficial for banks but also helps
to mitigate the risk for banking industry and maintain its stability.
The main results are robust to a different measure of financial
performance and controlling for the period of economic crisis.
Key words - Income diversification; financial performance;
commercial banks; Herfindahl Hirschman index; non-interest
income
1. Introduction
Nowadays, the operations of Vietnamese commercial
banks are plentiful and diversified. Commercial banks are
facing an increasingly competitive business climate.
Therefore, the development of new operations besides the
traditional borrowing and lending activities are necessary
in order to increase profits. Typical non-interest income
sources include trust activities, service fees on deposit
accounts, service fees and insurance commissions,
investment income, credit fees, securities trading, profit on
loan and rental trading accounts… Especially, due to the
impact of Covid-19 pandemic on the traditional banking
activities, the new trend of obtaining revenues from noninterest activities is getting more and more traction.
This study aims to investigate the impact of the bank's
income diversification on bank financial performance. In
term of diversification, previous studies define this concept
as following. [1] have observed that when the interests of
the studies are different, the term "diversification" will
have different meanings. [2] define diversification as an
activity that is functionally realized by combining into a
corporation, such as securities trading activities, insurance,
and other financial services. On the other hand, [3] assert
that diversification is the formation of a consortium of
multiple banks through a bank's parent company or
banking groups. In this study, diversification refers to nontraditional banking activities. Traditional operations are
those that focus on bank interest income. Therefore,
diversification is the bank's focus on activities to increase
non-interest income.
In terms of the relationship between banks’ income
diversification and their financial performance, previous
literature yields mixed findings. According to [4], noninterest income is becoming increasingly important,
accounting for 40% of operating income in the US
commercial banking industry. A study by [5] argue that in
order to survive and succeed in generating revenue and
profits, banks are becoming increasingly reliant on noninterest revenue. On the one hand, some studies ([6], [7], [8],
[9], [10], [11] and [12]) find that diversification is beneficial
to banks because they can take advantage of economies of
scope. Diversification, on the other hand, has been shown in
certain studies to have a negative impact on bank
profitability. It results from the lack of bank management
experience ([13] and [14]) when banks expand their
activities to non-traditional sectors. These studies are done
primarily in the United States and developed countries. The
number of researches on this issue in emerging economies is
limited, especially, fewer studies have been conducted
specifically for commercial banks in Vietnam.
A variety of hypotheses are put forward regarding to
the influence of revenue diversification on bank
profitability. Some theories suggest that banks should
diversify their income so that it can bring many benefits.
Others believe that banks should only focus on traditional
activities and limit diversification. In addition, some
studies do not advocate income diversification or
specialization. They believe that diversification depends on
the environment and conditions of each bank. Therefore,
research on the influence of income diversity on bank
profitability in Vietnam is required. A comprehensive
understanding of the impact of diversification on
profitability is critical to a bank’s success, especially, in an
increasingly competitive business environment. Moreover,
knowing this relationship also helps the policymakers to
formulate directional policies for developing and
maintaining the banking system's stability.
Using a data set that includes 33 Vietnamese
commercial banks from 2006 to 2020, our analysis results
show that a stronger income diversification results in
higher banks’ financial performance. The main results are
still valid when using a different measure of financial
performance, namely ROE, and controlling for the period
of economic crisis.
2. Hypothesis development and literature review
2.1. Hypothesis development
This study assesses whether income diversification
benefits commercial banks in Vietnam. The research
motivation is driven by the "not putting all your eggs in one
basket". This theory suggests that instead of focusing only
ISSN 1859-1531 - THE UNIVERSITY OF DANANG - JOURNAL OF SCIENCE AND TECHNOLOGY, VOL. 20, NO. 12.1, 2022
on developing traditional lending activities, banks should
expand their services and diversify their revenue sources to
achieve high efficiency. [15] and [16] mention this theory
in their research. [15] suggest that a combination of
different banking activities can lead to increased returns
and diversification of risks. In addition, [16] study of 266
listed banks in 11 countries finds that diversification can
add value to banks.
Another theory that explains the effect of
diversification on commercial bank performance is the
resource-based theory developed by [17], [18] and [19].
The theory suggests that firms can achieve higher
performance if they can exploit the potential synergies
between resources. This helps banks being able to share
functions, resources and competencies, hence they can
reduce cost and improve financial performance [20].
Some studies suggest that banks can enjoy an increasing
return to scale by diversifying their revenues. According to
[21], banks can collect information on clients who have used
one service in order to make other financial services more
accessible. Following that, [22] also finds similar results
when he suggested that banks would rely on customer
information to provide guarantees, insurance, and securities
services. So, if the bank engages in more and more different
activities, they may achieve better operational efficiency.
From the above discussion, the following research
hypothesis is proposed:
H1: Income diversification improves commercial bank
performance.
2.2. Literature review
Many studies have investigated the impact of income
diversification on bank financial performance. However,
there is no consensus conclusion regarding to this topic.
A number of studies find that revenue diversity helps
banks reducing risk of bankruptcy and other risks, such as
[2], [4], [23], [24], [25], [26], [27], [28], [29], [30] and [31].
At the international level, the research by [28] uses
commercial bank statistics from 29 nations in Asia in a
period of 15 years from 1995 to 2009 also finds the positive
impacts of non-interest income on bank systems. Similarly,
research by [33] also suggests that banks can share inputs
in joint production or cross-selling, which will help banks
take advantage of the diversification of sources of bank
earnings through economies of scale.
On the opposite direction, some studies report that
although income diversifying improves efficiency but it
simultaneously increases the risk for the bank, resulting in
a decrease in profitability. [34] suggested that the decrease
in bank profitability and the rise in risk are related to the
increase in non-interest income. Similarly, [35] analyze
bank income structure and risk by using data from 723
European banks over the period 1996–2002. They find that
non-credit income can reduce bank performance by
increasing profitability and also increase the risk for banks.
[36] used data from the Indonesian banking sector and
show that income diversification increases the risk of largesized banks. Similarly, subsequent literature finds that an
expansion of non-interest income may harm banks’
75
profitability, see [37], [38], [39], [40] and [41].
In Vietnam, a few studies have been carried to
investigate the impact of income diversification on banks’
performance, for example, [42], [43] and [44]. All of these
studies find a positive effect of diversification on banks’
profitability. This study contributes to the current literature
by using a larger and updated data set as well as using
multiple income diversification proxies in order to
investigate the impact of income diversification on
commercial banks’ profitability.
3. Research methodology
3.1. Data
This paper employs a data set includes 33 commercial
banks in Vietnam from 2006 and 2020. The variables using
in this paper and their descriptions are listed in Table 1.
Table 1. List of variables
Variables
Defining Variables
ROA
Return On Asset (%) is measured by Net Income
divided by Total Assets.
ROE
Return On Equity (%) is measured by Net Income
divided by Shareholder Equity.
HHI
Herfindahl
GNII
Non-interest income growth of the bank (%).
NNII
Net non-interest income (%), calculated by the
proportion of non-credit net income to the total net
operational income of each bank.
NII
Non-interest income to interest income (%) as a
percentage of bank’s interest income.
Hirschman index, measure by
𝑛𝑜𝑛 − 𝑖𝑛𝑡𝑒𝑟𝑒𝑠𝑡 𝑖𝑛𝑐𝑜𝑚𝑒 2
𝐻𝐻𝐼 = 1 − [(
)
𝑡𝑜𝑡𝑎𝑙 𝑏𝑎𝑛𝑘′𝑠 𝑖𝑐𝑜𝑚𝑒
𝑛𝑒𝑡 𝑖𝑛𝑡𝑒𝑟𝑒𝑠𝑡 𝑖𝑛𝑐𝑜𝑚𝑒 2
+(
) ]
𝑡𝑜𝑡𝑎𝑙 𝑏𝑎𝑛𝑘′𝑠 𝑖𝑛𝑐𝑜𝑚𝑒
EQUITY The equity-to-asset ratio (%) is the amount of equity
the bank has when compared to the total assets
owned by the bank.
NPL
The non-performing loans to loans ratio (%)
SIZE
The natural logarithm of banks’ total assets
GDPS
The size of the domestic market measured by the
natural logarithm of Gross domestic product.
INF
Annual inflation rates (%)
The data of banks’ specific characteristics includes the
dependent variables, ROA and ROE, four income
diversification proxies, HHI, GNII, NNII and NII, and the
control variables, including EQUITY, NPL and SIZE are
collected from FIINPRO. The second set of data is
macroeconomic variables, including GDPS and INF, are
also taken from World Bank Data. Only observations that
have data for all variables are included in our data set. The
final data set includes a total of 456 bank-year observations.
3.2. Regression model
Following the previous literature (see [2] and [34]), we
employ a multivariate regression model as followed:
𝑃𝑟𝑜𝑓𝑖𝑡𝑎𝑏𝑖𝑙𝑖𝑡𝑦𝑖,𝑡 = 𝛼 + 𝛽𝐷𝑖𝑣𝑒𝑟𝑠𝑖𝑓𝑖𝑐𝑎𝑡𝑖𝑜𝑛𝑖,𝑡
+𝛾𝐶𝑜𝑛𝑡𝑟𝑜𝑙𝑖,𝑡 + 𝜀𝑖,𝑡
(1)
76
Nguyen Thanh Dat, Cao Thi Linh
Where, i and t are individual bank index and year index,
respectively. The dependent variable is bank profitability
ratio proxied by return on assets ratio (ROA) which is
widely used in previous literature (see [45] and [46]). In the
robustness test section, an alternative proxy of bank
profitability, namely return on equity (ROE), is used. Our
mail variable of interest is Diversification represents the
level of income diversification of commercial banks. In
this paper, we use four variables to proxy for bank income
diversification, namely Herfindahl Hirschman index
(HHI), non-interest income growth (GNII), net noninterest income (NNII) and non-interest income to interest
income ratio (NII). Our regression model is also controlled
for bank specific characteristics and macroeconomic
variables, including equity to total assets, non-performance
loan, bank size, the size of the domestic market and
inflation rate. Moreover, the empirical results are also
controlled for bank fixed effect. The robust standard errors
are also used to correct for the potential heteroscedasticity.
4. Results and discussions
4.1. Descriptive statistics and correlation test
The summary statistics of the variables are shown in
Table 2. From the result shows that traditional banking
remains the primary source of income for banks in the
Vietnamese market, as evidenced by an average noninterest income ratio (the proportion of net income from
non-credit activities compared to the total net.
Table 2. Descriptive Statistics Results
Variable
Obs
Mean
Std. Dev.
Min
Max
ROA
456
0.011
0.008
-0.004
0.06
ROE
456
0.106
0.075
-0.046
0.445
HHI
456
0.3
0.129
0
0.5
GNII
456
0.905
5.317
-25.923
74.275
NNII
456
0.202
0.176
-0.945
0.989
NII
455
0.555
4.166
-0.486
86.83
EQUITY
456
0.107
0.066
0.027
9.463
NPL
456
0.017
0.016
0
0.114
SIZE
456
31.921
1.402
27.441
34.955
GDPS
456
25.791
0.408
24.919
26.326
INF
456
0.072
0.059
0.006
0.231
Over the sample period, return on assets (ROA) of
commercial banks in Vietnam ranges from the minimum
value of -0.4% to the maximum value of 6% and the
average value of 1.1%. The return on equity (ROE) ranges
from a minimum value of -4.6% to a maximum value of
44.5% and a mean equal to 10.6%.
In terms of the income diversification proxies, we
observe a significant variance across different banks and
years in our sample period. The HHI variable ranges
between the minimum value of 0 to a maximum value of
0.5 and has a mean equal to 0.3. In addition, the standard
deviation of the HHI is 0.129.
Table 3. Correlation Matrix
Variables
HHI
GNII
NNII
NII
EQUITY
NPL
SIZE
GDPS
HHI
1.000
GNII
0.048
1.000
NNII
0.634
0.032
NII
-0.065
0.010
0.330
1.000
EQUITY
0.014
0.044
-0.068
-0.008
1.000
NPL
-0.060
0.026
0.016
-0.003
-0.112
1.000
SIZE
0.134
-0.095
0.142
0.000
-0.696
0.132
1.000
GDPS
-0.013
-0.093
0.017
-0.056
-0.353
0.159
0.553
1.000
INF
-0.090
0.046
-0.091
0.011
0.292
-0.029
-0.320
-0.575
INF
1.000
Table 3 presents the pairs of correlation coefficients
between variables. We can see that there is no pair of
independent variables has the correlation coefficient that is
higher than 0.8, so there is no serious multicollinearity
problem in our regression results.
4.2. Regression results
Table 4 reports the panel regression results for (1)
where the return of asset ratio ROA is regressed against
diversification variables, namely HHI, GNII, NNII, and
NII respectively. We report some noteworthy results. First,
all independent variables (HHI, GNII, NNII, and NII) are
found to have statistically significant effects on ROA.
Secondly, all of these coefficients are positive. It means
that the higher the value of HHI, GNII, and NNII variables
are, i.e. higher degree of diversification toward non-interest
income, the greater the return on assets of the banks is. In
detail, HHI has a coefficient value of 0.0060, GNII has a
1.000
coefficient value of 0.0002, NNII has a coefficient value of
0.0056 and NII has a coefficient value of 0.00000882. The
results imply that banks that focus on income
diversification will achieve higher returns than banks that
practice a lower degree of income diversification or focus
only on traditional activities, i.e. interest income related
activities.
In terms of control variables expressing bank specific
characteristics, the results show that EQUITY, SIZE have
statistically significant effect on ROA at least 5% level
across four regression models. An increase in bank size is
associated with an increase in bank profitability. These
results are similar to that of [45] and [47]. When
considering macroeconomic variables, the size of the
domestic market (GDPS) is statistically significant in all
four models at 5% confident level. the relationship with the
ROA dependent variable. However, the direction of impact
ISSN 1859-1531 - THE UNIVERSITY OF DANANG - JOURNAL OF SCIENCE AND TECHNOLOGY, VOL. 20, NO. 12.1, 2022
is the opposite of the performance of Vietnamese banks.
The coefficients range from -0.0188 to -0.0185 and are
significant at the 5% level. Moreover, the value of adjusted
R2 is ranging from 62.8% to 64.4%. These results infer the
appropriateness of the control variables using in our
regression model.
Table 4. Fixed effects model (FEM) regressions of the impacts
of HHI, GNII, NNII and NII on ROA
Variables
(1)
(2)
(3)
(4)
ROA
ROA
ROA
ROA
0.0121***
HHI
[3.8936]
0.0002***
GNII
0.0091
diversification are found to have statically significant
impacts on banks’ profitability, except HHI. Moreover, all
coefficients are positive. In detail, the GNII has a coefficient
value of 0.0006 and it is significant at the 5% level, NNII has
a coefficient value of 0.0265 and is significant at the 10%
level and NII has a coefficient value of 0.0000441 and is
significant at the 10% level. It means non-interest income
increases returns to shareholders. These results, again,
support our research hypothesis that a higher income
diversification degree help banks to improve their financial
performance. In terms of the control variables, EQUITY,
SIZE and GDPS are statistically significant in our four
models reported in Table 4-4. In addition, the adjusted R2
has values between 64.0% to 65.2%.
Table 5. Robustness test: Fixed effects model (FEM) regressions
of the impacts of HHI, GNII, NNII and NII on ROE
[3.4857]
NNII
***
[3.7859]
0. 00001***
NII
[4.8712]
EQUITY
NPL
SIZE
GDP
INF
Constant
Observations
2
Adjusted R
77
0.0795***
0.0848***
0.0823***
0.0806***
[7.4463]
[6.9512]
[7.2223]
[7.2654]
-0.0465**
-0.0500***
-0.0505***
-0.0460**
[-2.4601]
[-2.8944]
[-2.8649]
[-2.5443]
0.0082***
0.0080***
0.0077***
0.0079***
[6.4294]
[6.3464]
[6.4094]
[6.5978]
-0.0176***
-0.0174***
-0.0169***
-0.0171***
[-7.5749]
[-7.4173]
[-7.7672]
[-7.9472]
0.0075
-0.0001
0.0036
0.0054
[1.0527]
[-0.0187]
[0.5799]
[0.8699]
0.1913***
0.1937***
0.1901***
0.1884***
[6.8091]
[6.7060]
[7.0008]
[7.0935]
423
456
456
456
0.596
0.559
0.572
0.581
Variables
HHI
(1)
(2)
(3)
(4)
ROE
ROE
ROE
ROE
0.1013***
[3.9752]
0.0010***
GNII
[3.1149]
0.0615***
NNII
[3.1822]
0.0001***
NII
[4.6116]
EQUITY
NPL
SIZE
GDP
***, **,
and * denotes the significant level at 1%, 5%, and 10%
respectively.
INF
4.3. Robustness tests
To consolidate the results from the main regression
model, some robustness tests are implemented. First, an
alternative measure of bank profitability is used, namely
return on equity (ROE). Second, we control our regressions
for the period of crisis from 2007 to 2009 to see whether
the impact of income diversification on banks’ profitability
remains significant.
4.3.1. Using ROE
Previous studies by [6] and [24] also use ROE to
measure the bank's performance. Therefore, in the first
robustness test we replace return on asset ratio by return on
equity ROE as the proxy for banks’ profitability in
equation (1). Besides ROA, ROE is well-known as a
measure for profitability performance not only in banking
industry but also in other businesses.
The results of the first robustness test are reported in
Table 5. It is noticed that when using an alternative
measurement, the results are largely consistent with the main
ones. In particular, three out of four proxies for income
Constant
0.0906
0.1306**
0.1144*
0.0990
[1.3778]
[1.9884]
[1.8131]
[1.6011]
-0.4190**
-0.4704***
-0.4798***
-0.4480**
[-2.1716]
[-2.6612]
[-2.7071]
[-2.4831]
0.0747***
0.0712***
0.0692***
0.0703***
[7.5001]
[7.4998]
[7.4435]
[7.5124]
-0.1599***
-0.1554***
-0.1519***
-0.1529***
[-8.2190]
[-8.0903]
[-8.2639]
[-8.3713]
0.1134*
0.0478
0.0738
0.0911*
[1.9153]
[0.9282]
[1.4214]
[1.7849]
1.8051***
1.8318***
1.7925***
1.7692***
[6.9899]
[7.0540]
[7.1663]
[7.2155]
Observations
423
456
456
456
Adjusted R2
0.567
0.538
0.550
0.561
Note ***, **, and * denotes the significant level at 1%, 5%, and
10% respectively.
Similar to the results with the ROA dependent variable,
the model shows a significant negative effect of market
size on bank profitability. The larger the market size, the
smaller the return on equity, which adversely affects the
bank's performance.
4.3.2. Controlling for economic crisis
To further strengthen the main results, following [25],
the study continues to test whether the relationship between
income diversification and banks’ profitability is held
when controlling for the economic crisis. Particularly, a
dummy variable of CRISIS and its interaction with
diversification variables are added into (1). CRISIS has a
value of 1 for the year of 2007, 2008 and 2009 and 0
otherwise.
78
Nguyen Thanh Dat, Cao Thi Linh
Table 6. Robustness test: FEM regressions of the impacts of
HHI, GNII, NNII and NII on ROA.
Variables
HHI
(1)
ROA
(2)
ROA
(3)
ROA
0.0120***
[3.4001]
0.0001**
[2.0624]
GNII
0.0070**
[2.3397]
NNII
0. 000013***
[3.7424]
NII
CRISIS
HHI*
CRISIS
(4)
ROA
0.0029
[1.1731]
0.0017*
[1.7148]
0.0002
[0.1934]
0.0003
[0.1815]
-0.0037
[-0.5063]
GNII*
CRISIS
0.0001
[0.6342]
NNII*
CRISIS
0.0050
[1.1742]
NII*
CRISIS
REFERENCES
0.0000
[0.5064]
NPL
0.0802***
[7.6404]
-0.0403**
0.0853***
[7.0573]
-0.0428**
0.0837***
[7.5083]
-0.0447**
0.0814***
[7.4530]
-0.0422**
SIZE
[-2.1554]
0.0083***
[-2.4508]
0.0081***
[-2.5422]
0.0078***
[-2.3583]
0.0079***
GDP
[6.4899]
-0.0171***
[6.4163]
-0.0168***
[6.3950]
-0.0162***
[6.5137]
-0.0166***
INF
[-6.8489]
0.0054
[-6.9091]
-0.0020
[-6.8456]
0.0029
[-7.0320]
0.0042
Constant
[0.7632]
0.1723***
[-0.3212]
0.1748***
[0.4701]
0.1699***
[0.6927]
0.1738***
Observations
Adjusted R2
[5.0905]
423
0.598
[5.1990]
456
0.561
[5.1315]
456
0.575
[5.3584]
456
0.581
EQUITY
2006 to 2020. The analysis shows that a higher degree of
income diversification is beneficial to banks and results in
higher banks’ financial performance. Our main results are
held when using a different measure of financial
performance, namely ROE, and controlling for the period
of economic crisis.
These results suggest that banks should look forward to
diversifying their revenue streams, particularly income
from non-traditional activities, in order to improve
competitiveness, reduce risk, and raise profitability. In
particular, banks should exploit the current technology
development in providing products and services. In order
to ensure the effectiveness of the diversification, a research
department dedicated to product development should also
be established. In addition, commercial banks need to
diversify their products and improve the added values by
increasing the ability to synergize between products and
services in order to maximize benefits for customers.
At the macroeconomic level, policymakers also should
implement some policies in order to encourage banks to
diversify their incomes. This will not only be beneficial for
banks but also helps to mitigate the risk for banking
industry and maintain its stability.
Note ***, **, and * denotes the significant level at 1%, 5%, and
10% respectively
The results of the robustness test are presented in
Tables 6. In summary, the conclusion about the effect of
income diversification on banks’ profitability are not
changed when controlling for the effect of economic crisis.
HHI, GNII, and NII have all been shown to have a
statistically significant positive effect on ROA. It means
that banks with a high degree of diversification enjoyed
higher returns and achieved better performance.
5. Conclusion
The study examines the influence income
diversification, proxied by HHI, GNII, NNII and NII, on
commercial banks’ profitability. The research employs a
panel data set of 33 Vietnamese commercial banks from
[1] Reed, R., and Luffman, G. A., “Diversification: The growing
confusion”, Strategic Management Journal, 7(1), 1986, 29-35.
[2] Baele, L., De Jonghe, O., and Vander Vennet, R., “Does the stock
market value bank diversification?”, Journal of Banking & Finance,
31(7), 2007, 1999-2023.
[3] Kahloul, I., and Hallara, S., “The impact of diversification on firm
performance and risk: An empirical evidence”, International
research journal of finance and economics, 35(35), 2010, 150-162.
[4] DeYoung, R., and Rice, T., “Noninterest income and financial
performance at US commercial banks”, Financial review, 39(1),
2004, 101-127.
[5] Bian, W. L., Wang, X. N., and Sun, Q. X., “Non‐interest income, profit,
and risk efficiencies: Evidence from commercial banks in China”, Asia‐
Pacific Journal of Financial Studies, 44(5), 2015, 762-782.
[6] Chiorazzo, V., Milani, C., and Salvini, F., “Income diversification
and bank performance: Evidence from Italian banks”, Journal of
financial services research, 33(3), 2006, 181-203.
[7] Cornett, M. M., Ors, E., and Tehranian, H., “Bank performance
around the introduction of a Section 20 subsidiary”, The Journal of
Finance, 57(1), 2002, 501-521.
[8] Deng, S. E., Elyasiani, E., and Mao, C. X., “Diversification and the
cost of debt of bank holding companies”, Journal of Banking &
Finance, 31(8), 2007, 2453-2473.
[9] Klein, P. G., and Saidenberg, M. R., “Diversification, organization,
and efficiency: Evidence from bank holding companies”,
Organization, and Efficiency: Evidence from Bank Holding
Companies, 1998, Available at SSRN: />or />[10] Landskroner, Y., Ruthenberg, D., and Zaken, D., “Diversification
and performance in banking: The Israeli case”, Journal of Financial
Services Research, 27(1), 2005, 27-49.
[11] Mester, L. J., “Scale economies in banking and financial regulatory
reform”, The Region, 24(3), 2010, 10-13.
[12] Morgan, D. P., and Samolyk, K., “Geographic diversification in
banking and its implications for bank portfolio choice and
performance”, Unpublished paper, Federal Reserve Bank of New
York, 2003.
[13] Acharya, V. V., Hasan, I., and Saunders, A., “Should banks be
diversified? Evidence from individual bank loan portfolios”, The
Journal of Business, 79(3), 2006, 1355-1412.
ISSN 1859-1531 - THE UNIVERSITY OF DANANG - JOURNAL OF SCIENCE AND TECHNOLOGY, VOL. 20, NO. 12.1, 2022
[14] Berger, A. N., Hasan, I., and Zhou, M., “The effects of focus versus
diversification on bank performance: Evidence from Chinese banks”
Journal of Banking & Finance, 34(7), 2010, 1417-1435.
[15] Gamra, S. B., and Plihon, D., “Revenue diversification in emerging
market banks: Implications for financial performance”, arXiv
preprint arXiv:1107.0170, 2011.
[16] Sanya, S., and Wolfe, S., “Can banks in emerging economies benefit
from revenue diversification?”, Journal of Financial Services
Research, 40(1), 2011, 79-101.
[17] Wernerfelt, B., “A Resource Based View of the Firm”, Strategic
Management Journal, 5, 1984, 171-180.
[18] Barney, J., “Firm Resources and Sustained Competitive”,
Advantage, Journal of Management, 17(1), 1991, 99-120.
[19] Teece, D.J., Pisano, G. and Shuen A., “Dynamic Capabilities and
Strategic Management”, Strategic Management Journal, 18(7),
1997, 509-533.
[20] Mulwa, J. M., Tarus, D., and Kosgei, D., “Commercial bank
diversification: a theoretical survey”, International Journal of
Research in Management & Business Studies, 2(1), 2015, 45-49.
[21] Saunders, A., and Walter, I., “Universal banking in the United
States: What could we gain? What could we lose?”, Oxford
University Press, 1994.
[22] Stein, J. C., “Information production and capital allocation:
Decentralized versus hierarchical firms”, The journal of Finance,
57(5), 2002, 1891-1921.
[23] Boot, A. W., and Schmeits, A., “Market discipline and incentive
problems in conglomerate firms with applications to banking”,
Journal of financial intermediation, 9(3), 2000, 240-273.
[24] Laeven, L., and Levine, R., “Is there a diversification discount in
financial conglomerates”, Journal of financial economics, 85(2),
2007, 331-367.
[25] Elsas, R., Hackethal, A., and Holzhäuser, M., “The anatomy of bank
diversification”, Journal of Banking & Finance, 34(6), 2010, 12741287.
[26] De Jonghe, O., “Back to the basics in banking? A micro-analysis of
banking system stability”, Journal of financial intermediation,
19(3), 2010, 387-417.
[27] Chronopoulos, D. K., Girardone, C., and Nankervis, J. C., “Are there
any cost and profit efficiency gains in financial conglomeration?
Evidence from the accession countries”, The European Journal of
Finance, 17(8), 2011, 603-621.
[28] Nguyen, M., Skully, M., and Perera, S., “Market power, revenue
diversification and bank stability: Evidence from selected South
Asian countries”, Journal of International Financial Markets,
Institutions and Money, 22(4), 2012, 897-912.
[29] Gurbuz, A. O., Yanik, S., and Aytürk, Y., “Income Diversification
and Bank Performance: Evidence from Turkish Banking Sector”,
BDDK Bankacılık ve Finansal Piyasalar Dergisi, 7(1), 2013, 9-29.
[30] Köhler, M., “Does non-interest income make banks more risky?
Retail-versus investment-oriented banks”, Review of financial
economics, 23(4), 2014, 182-193.
79
[31] Meslier, C., Tacneng, R., and Tarazi, A., “Is bank income
diversification beneficial? Evidence from an emerging economy”,
Journal of International Financial Markets, Institutions and Money,
31, 2014, 97-126.
[32] Lee, C. C., Yang, S. J., and Chang, C. H., “Non-interest income,
profitability, and risk in banking industry: A cross-country analysis”, The
North American Journal of Economics and Finance, 27, 2014, 48-67.
[33] Jouida, S., “Diversification, capital structure and profitability: A
panel VAR approach”, Research in International Business and
Finance, 45, 2018, 243-256.
[34] Stiroh, K. J., and Rumble, A., “The dark side of diversification: The
case of US financial holding companies”, Journal of Banking &
Finance, 30(8), 2006, 2131-2161.
[35] Lepetit, L., Nys, E., Rous, P., & Tarazi, A., “Bank income structure
and risk: An empirical analysis of European banks”, Journal of
Banking & Finance, 32(8), 2008, 1452-1467.
[36] Hidayat, W. Y., Kakinaka, M., and Miyamoto, H., “Bank risk and
non-interest income activities in the Indonesian banking industry”,
Journal of Asian Economics, 23(4), 2012, 335-343.
[37] Mercieca, S., Schaeck, K., and Wolfe, S., “Small European banks:
Benefits from diversification?”, Journal of Banking & Finance,
31(7), 2007, 1975-1998.
[38] Pozsar, Z., Adrian, T., Ashcraft, A., and Boesky, H., “Shadow
banking”, New York, 458(458), 2010, 3-9.
[39] Li, L., and Zhang, Y., “Are there diversification benefits of
increasing noninterest income in the Chinese banking industry?”,
Journal of Empirical Finance, 24, 2013, 151-165.
[40] DeYoung, R., and Torna, G., “Nontraditional banking activities and
bank failures during the financial crisis”, Journal of financial
intermediation, 22(3), 2013, 397-421.
[41] Delpachitra, S., and Lester, L., “Non‐Interest Income: Are
Australian Banks Moving Away from their Traditional
Businesses?”, Economic Papers: A journal of applied economics
and policy, 32(2), 2013, 190-199.
[42] Vo, X. V., “Bank lending behavior in emerging markets”, Finance
Research Letters, 27, 2018, 129-134.
[43] Hao, N. Q., Long, L. K., Ky, P. C., and Nguyen, T. T., “The impact
of non-interest income to the profitability of joint-stock commercial
banks in Viet Nam”, ICFE 2020, 2020, 469.
[44] Dang, V. D., “Non-interest income, credit risk and bank stability:
Evidence from Vietnam”, Institutions and Economies, 2021, 97-125.
[45] Almazari, A. A., “Financial performance evaluation of some
selected Jordanian commercial banks”, International Research
Journal of Finance and Economics, 68(8), 2011, 50-63.
[46] Edirisuriya, P., Gunasekarage, A., and Dempsey, M., “A ustralian
Specific Bank Features and the Impact of Income Diversification on
Bank Performance and Risk”, Australian Economic Papers, 54(2),
2015, 63-87.
[47] Bashir, A. H. M., “Determinants of profitability in Islamic banks:
Some evidence from the Middle East”, Islamic economic studies,
11(1), 2003.