ASTM D8460 2022 Standard Test Method for Quantification of Volatile Organic Compounds Using Proton Transfer Reaction Mass Spectrometry
Bạn đang xem bản rút gọn của tài liệu. Xem và tải ngay bản đầy đủ của tài liệu tại đây (363.65 KB, 15 trang )
This international standard was developed in accordance with internationally recognized principles on standardization established in the Decision on Principles for the
Development of International Standards, Guides and Recommendations issued by the World Trade Organization Technical Barriers to Trade (TBT) Committee.
Designation: D8460 − 22
Standard Test Method for
Quantification of Volatile Organic Compounds Using Proton
Transfer Reaction Mass Spectrometry1
This standard is issued under the fixed designation D8460; the number immediately following the designation indicates the year of
original adoption or, in the case of revision, the year of last revision. A number in parentheses indicates the year of last reapproval. A
superscript epsilon (´) indicates an editorial change since the last revision or reapproval.
standard. Reporting of test results in units other than SI shall
not be regarded as nonconformance with this standard.
1. Scope
1.1 This test method describes a technique of quantifying
the results from measuring various volatile organic compound
contents using a chemical ionization mass spectrometer resulting in the production of positively charged target compound
ions. Depending on the nature of production of so-called
primary ions, the associated instruments having the capability
to perform such analyses are either named Proton Transfer
Reaction Mass Spectrometers (PTR-MS), Selected Ion Flow
Tube Mass Spectrometers (SIFT-MS) or, in the most generic
term, Mid-pressure chemical ionization mass spectrometers
(MPCI-MS). Within this standard, the term PTR-MS is used to
represent any of these instrumentations.
1.5 All observed and calculated values shall conform to the
guidelines for significant digits and rounding established in
Practice D6026.
1.5.1 The procedures used to specify how data are collected/
recorded or calculated in the standard are regarded as the
industry standard. In addition, they are representative of the
significant digits that generally should be retained. The procedures used do not consider material variation, purpose for
obtaining the data, special purpose studies, or any considerations for the user’s objectives; and it is common practice to
increase or reduce significant digits of reported data to be
commensurate with these considerations. It is beyond the scope
of this standard to consider significant digits used in analysis
methods for engineering data.
1.6 This standard may involve hazardous materials,
operations, and equipment. This standard does not purport to
address all of the safety concerns, if any, associated with its
use. It is the responsibility of the user of this standard to
establish appropriate safety, health, and environmental practices and determine the applicability of regulatory limitations
prior to use.
1.7 This international standard was developed in accordance with internationally recognized principles on standardization established in the Decision on Principles for the
Development of International Standards, Guides and Recommendations issued by the World Trade Organization Technical
Barriers to Trade (TBT) Committee.
1.2 Either of the instrument types can be used with the two
main mass analyzers on the market, that is, with either
quadrupole (QMS) or time-of-flight (TOFMS) mass analyzer.
This method relates only to the quantification portion of the
analysis. Due to large differences in user interfaces and
operating procedures for the instruments of the main instrument providers, the specifics on instrument operation are not
described in this method.
1.3 Details on the theoretical aspects concerning ion production and chemical reactions are included in this standard as
far as required to understand the quantification aspects and
practical operation of the instrument in the field of vapor
intrusion analyses. Specifics on the operation and/or calibration
of the instrument need to be identified by using the user’s
manual of the individual instrument vendor. A comprehensive
discussion on the technique including individual mass-line
interferences and in-depth comparison with alternate methods
are given in multiple publications, such as Yuan et al. (2017)
(1) and Dunne et al. (2018) (2)2.
2. Referenced Documents
2.1 ASTM Standards:3
D653 Terminology Relating to Soil, Rock, and Contained
Fluids
D1357 Practice for Planning the Sampling of the Ambient
Atmosphere
D3740 Practice for Minimum Requirements for Agencies
1.4 Units—Values stated in SI units are to be regarded as
standard. No other units of measurement are included in this
1
This test method is under the jurisdiction of ASTM Committee D18 on Soil and
Rock and is the direct responsibility of Subcommittee D18.21 on Groundwater and
Vadose Zone Investigations.
Current edition approved May 1, 2022. Published June 2022. DOI: 10.1520/
D8460-22
2
The boldface numbers in parentheses refer to a list of references at the end of
this standard.
3
For referenced ASTM standards, visit the ASTM website, www.astm.org, or
contact ASTM Customer Service at For Annual Book of ASTM
Standards volume information, refer to the standard’s Document Summary page on
the ASTM website.
Copyright © ASTM International, 100 Barr Harbor Drive, PO Box C700, West Conshohocken, PA 19428-2959. United States
1
D8460 − 22
3.3.5 FEP—fluorinated ethylene propylene
3.3.6 GC—gas chromatography
3.3.7 ICAL—initial multipoint calibration
3.3.8 IMR—ion molecule reactor
3.3.9 LCS—laboratory control sample
3.3.10 MDL—method detection limit
3.3.11 MS—mass spectrometer
3.3.12 NIST—National Institutes of Standards and Technology
3.3.13 PEEK—polyetheretherketone
3.3.14 PFA—polyfluoroalkoxy alkane
3.3.15 PTFE—polytetrafluoroethylene
3.3.16 PTR-MS—proton transfer reaction - mass spectrometer or spectrometry
3.3.17 QMS—quadrupole mass spectrometer
3.3.18 SDS—safety data sheet
3.3.19 SIFT-MS—selected ion flow tube - mass spectrometer or spectrometry
3.3.20 TOFMS—time-of-flight mass spectrometer
3.3.21 VI—vapor intrusion
3.3.22 VOC—volatile organic compound
Engaged in Testing and/or Inspection of Soil and Rock as
Used in Engineering Design and Construction
D5314 Guide for Soil Gas Monitoring in the Vadose Zone
(Withdrawn 2015)4
D5730 Guide for Site Characterization for Environmental
Purposes With Emphasis on Soil, Rock, the Vadose Zone
and Groundwater (Withdrawn 2013)4
D6026 Practice for Using Significant Digits and Data Records in Geotechnical Data
D8408/D8408M Guide for Development of Long-Term
Monitoring Plans for Vapor Mitigation Systems
E2600 Guide for Vapor Encroachment Screening on Property Involved in Real Estate Transactions
3. Terminology
3.1 Definitions:
3.1.1 For ease of reading, the term PTR-MS is used to
reflect any variations of instrumentation as described in 1.1 and
1.2.
3.1.2 For definitions of common technical terms used in this
standard, refer to the guidelines in Practice D1357 and Terminology D653.
3.2 Definitions of Terms Specific to This Standard:
3.2.1 gas analysis, n—involves multiple gas measurements
including calibration and zero gas background subtraction,
therefore involves multiple gas measurements.
3.2.2 gas measurement, n—an analysis performed with a
PTR-MS without calibration nor zero gas background subtraction.5
3.2.3 ion molecule reactor, n—the instrument part within the
PTR-MS where ionization reactions of the target molecules
using primary ions happen
3.2.4 ZeroAir, n—a gas determined to be free of any
interfering substances at the reporting limit of the project.
3.2.4.1 Discussion—For example, the PTR-MS can be used
to perform the analysis or an equivalent methodology or the
certificate can be used in case of a certified cylinder.6
3.4 Symbols Used in Equations:
3.4.1 A—a target compound (analyte)
3.4.2 AH+—a protonated target compound
3.4.3 R—reagent ion (primarily hydronium)
3.4.4 CVN(A)= [A]—number concentration (molecules/mL)
of a neutral A in the ion molecule reactor
3.4.5 CVV(A)—mixing ratio or concentration of a constituent ion sample air (mL/L)
3.4.6 I(AH+)—signal intensity, that is, ion count rates
(ions/s)
3.4.7 E(AH+)—ion transmission efficiencies through the
mass spectrometer
3.4.8 k—ion–molecule reaction rate constant (molecules
mL–1 s–1)
3.4.9 t—reaction time (s)
3.4.10 τ—dwell time (s)
3.4.11 [air]R—CVN (air) number concentration of air in the
ion molecule reactor (molecules/mL)
3.4.12 Ccal—calibration concentration (nL/L)
3.4.13 pR—pressure of the ion molecule reactor (mbar)
3.4.14 TR—temperature of the ion molecule reactor (K)
3.4.15 UR—voltage of the ion molecule reactor (V)
3.4.16 µ—ion mobility (m2 V–1 s–1)
3.4.17 µ0—reduced ion mobility (cm2 V–1 s–1) at standard
conditions of p0 and T0
3.4.18 p0—air pressure in standard conditions (mbar)
3.4.19 T0—temperature in standard conditions (K)
3.4.20 NA—Avogadro constant
3.3 Abbreviations:
3.3.1 CI-MS—chemical ionization - mass spectrometer or
spectrometry
3.3.2 DOD—United States Department of Defense
3.3.3 DOE—United States Department of Energy
3.3.4 EPA—United States Environmental Protection Agency
4
The last approved version of this historical standard is referenced on
www.astm.org.
5
Background—Signal is caused by contaminations in the sampling system and
the ionizer. This is different from the base line signal, which is caused by electronic
noise, stray ions, and/or peak tails of very abundant compounds.
6
In practice this means that a gas mixture can have 20 components present at 10
nL/L (ppb) each. These components shall not produce interfering signals or
contribute significantly to the consumption of the reagent ion. Commercially sold
ZeroAir cylinders and generators usually guarantee the content to have <0.1 nL/L
hydrocarbons. The actual amount of hydrocarbons within a given air needs to be
identified separately. In case of the use of a ZeroAir generator, the feedline might
require additional scrubbers. Despite of these aspects, a ZeroAir generator is
preferred over bottled air for the system blank (see Chapter 12) since the ambient
humidity can be an important factor for the calibration in some systems. Zero
Nitrogen is an option, with the same conditions as described above.
2
D8460 − 22
valve allow different sample flows from discreet, separate
locations to be programmatically measured at a single instrument location.
3.4.21 l—length of the ion molecule reactor (m)
3.5 Quantities, their symbols and SI units, non-SI units
accepted with the SI and equivalent non-SI units are often used
in the scientific literature of this field. In this standard we try to
use SI units where possible and indicate scientific jargon units
in parenthesis. An overview of the quantities and units used in
this field is listed in Table 1.
4.2 The instrument is calibrated either from manual input of
calibration standards and zero air or through the use of an
automated calibration and zero system. Automatic systems are
commercially available and can be linked to the PTR-MS
through inert tubing. Such systems usually produce zero air for
blanks and use a calibration mixture through dynamic dilution
of that calibration standard into the zero air. Whether manual or
automatic, the concept of calibration remains the same, and is
described in detail later in this method.
4. Summary of Test Method
4.1 This method describes the practical aspects of quantification of a proton transfer reaction - mass spectrometer
(PTR-MS) in quantifying various volatile organic compounds
in ambient air samples. Ambient air samples are drawn through
inert tubing and routed to the PTR-MS for analysis. Sampling
can be performed either through direct input of the sample gas
into the instrument or by using a secondary pump system for
sampling from more distant areas by using PTFE, PFA or
equivalent sampling tubing; by using the latter approach,
distances between sampling spot and instrument of several
hundred feet can be achieved. Limitations in terms of distance
are described in Sears, et. al. (2013) (3). The inlet can be set up
to handle either continuous sampling or for discreet sample
intake of previously acquired air samples in, for example,
canisters or bags. Instruments configured with a multiport
4.3 This method is used to quantify the concentration of
VOCs in the gas phase using ambient air as the carrier gas. In
the standard case this method will draw VOCs into the
PTR-MS using air as the carrier gas, but gasses that are inert to
the method can be substituted as the carrier gas (N2 or noble
gasses). Calibrations and blanks are either conducted automatically using an appropriate calibration system or manually using
auxiliary standards.
5. Significance and Use
5.1 Vapor intrusion testing has been performed traditionally
using multiple canister samples or thermal desorption tube
TABLE 1 Comparative Listing of SI and Common Units as Applicable to PTR-MS Analyses
Quality
Concentration
Volumetric
Concentration
Mixing
Ratio
Number
Concentration
Pressure
Independent
Gas Flow
Symbol
CVV
CNN
SI
m3 / m3
non-SI
ppmV, ppbV, or pptV
CVN
mL–1
molecules
F
mL ⁄ min
hPa
L ⁄ min
sccm
bar mL ⁄ min
mbar L ⁄ min
Mass/charge
m/z
Mass-to-charge
Chargic mass
m/Q
M
Signal
Signal intensity,
ion count rate
SensitivityA
S
I
Resolving
powerB
R
Th/Th
Resolution
∆M
Th
Scan speed
M/t
Th/s
Comments
C
s
mL
Th = u ⁄e
mL/min is confusing, because
it is pressure dependent. It
should be called standard
mL/min, which is not an SI
unit. At the standard pressure
of 1.013 bar, all these units
are the same.
Th = thomson =
unified atomic mass unit
=
atomic charge unit
In PTR-MS, the charge is
predominantly +1, therefor
m/z is equivalent to the
atomic mass unit of the
charged molecule.
ions
Hz
ion ⁄ s
Hz / (nL ⁄ L)
A
counts
cps
cps/ppb
all three units are common
s = I ⁄C usually in cps/ppb in
the literature
R = (m ⁄Q) ⁄∆(m ⁄Q) is
sometimes also referred to as
resolution
∆M = ∆(m/Q) = the mass
difference at which two
neighboring peaks can be
distinguished
for QMS, which scan the
mass range
Sensitivity s = signal intensity I per concentration C of a compound = I/C.
Mass resolving power R = M ⁄∆M50%: for an isolated peak, observed mass divided by the peak width at 50 % height (FWHM, or full-width-at- half-maximum).
B
3
D8460 − 22
obscured from view by floor coverings, furniture or walls,
which in itself can be a large source of VOC. The current
methods of choice require the use of time-discreet monitoring
or time-averaged monitoring of a specific sampling spot.
Real-time monitoring provides a method to assess the spatial
distribution of vapor concentrations, which may help to rapidly
and efficiently identify the location of vapor entry points.
samples. These discontinuous measurements have been shown
to be snapshots and provide averages of exposure. In many
cases a higher temporal resolution is desirable to identify peaks
of emissions due to specific occupancy or environmental
changes. For these cases, a continuous real-time monitoring
solution is desirable. These continuous monitoring setups can
be either short-term or be part of a long-term monitoring plan
as described in ASTM guide “Standard Guide for the development of LongTerm Monitoring Plans for Vapor Mitigation
Systems” (E2600).
5.5 Real time assessment is valuable as a component of a
program of assessment with two or more supporting lines of
evidence and can be used to:
5.5.1 Provide support for real-time decisions such as where
and when to collect long-term samples for fixed laboratory
analysis using canisters or sorbent tubes;
5.5.2 Verify data quality (for example, monitoring the efficacy of soil gas probe purging prior to sampling, providing
leak checks; and
5.5.3 Measure changes in VOC vapor concentrations in
response to changes in building pressure, temperature, solar
irradiation, or other weather conditions and factors affecting
vapor fate and transport, including secondary chemistry occurring within the building.
5.5.4 Identify alternative pathways based on prior identified
intrusion compounds or based on emissions within such
pathways, such as stormwater drains.
5.2 The PTR-MS provides real-time measurement of multiple VOCs at ultra-trace levels, that is, in the µL/L (ppm) to
less than pL/L (ppt) range. Its strengths lie with the ability to
measure VOCs in real-time and continuously (that is, ~1 Hz or
faster, using time-of-flight analyzers), and with limited sample
pre-treatment, compared to a gas chromatograph (GC) system,
which is commonly the method of choice to measure VOCs
using a variety of detectors. In case of PTR-MS with quadrupole analyzers, the terms would be nearreal-time and semicontinuous. The high temporal resolution of the PTR-MS
measurement in the range of second(s) is often desired when
studying the atmospheric chemistry or source emissions that
result in unpredictable, sudden, and short-term fluctuations.
For a detailed description on the design and theory and
practical aspects of operation for the different types of PTRMS, please refer to Yuan et al. (2017)(1).
5.6 Screening of a property prior to a real estate transaction
based on site specific potential sources of concern. The option
for voluntary investigative assessments of potential VI in the
real estate business is described in ASTM method E2600-15.
5.3 For ambient air measurements, such as vapor intrusion
(VI) related emission testing, the PTR-MS can be used in three
different modes of operation: (1) in scanning mode to identify
sources and VI entry points within buildings; (2) in variation
identification mode, as a continuous monitoring instrument
with seconds to minutes of temporal resolution covering a large
number of VOCs; (3) in source tracking mode, as a scanner of
indoor and outdoor sources and as a rapid tracking device for
external emissions; this requires the instrument to be mounted
on a moveable platform, such as on an (autonomous) vehicle or
trolley. The same operation can be used to identify various
other constituents in air, depending on the application—be it
fugitive emissions from toxic materials or illicit materials, or
metabolic reactions to infections expressed in different breath
emissions.
NOTE 1—The quality of the result produced by this standard is
dependent on the competence of the personnel performing it, and the
suitability of the equipment and facilities used. Agencies that meet the
criteria of Practice D3740 are generally considered capable of competent
and objective testing/sampling/inspection/etc. Users of this standard are
cautioned that compliance with Practice D3740 does not in itself assure
reliable results. Reliable results depend on many factors; Practice D3740
provides a means of evaluating some of those factors.
6. PTR-MS Instrument
6.1 This chapter only describes the steps necessary for
understanding the quantification of PTR-MS generated data.
For general description of the instrument, please refer to Yuan
et al. (2017) (1) and Dunne et al. (2018) (2).
5.4 Spatial and temporal variability are two common challenges with ambient air measurements and source assessments.
Within a given building, the sources for vapors can be few or
many and are generally irregularly spaced; they may be
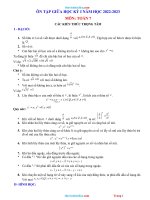
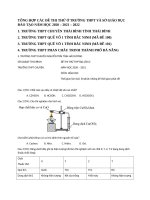
6.2 A mass spectrometer is usually considered as consisting
of a sampling system, an ionizer, a mass analyzer and data
analysis electronics. This is illustrated in Fig. 1.
FIG. 1 Definition of Mass Spectrometer (Hardware View) and Analysis (Procedural View) and Their Correspondence
4
D8460 − 22
6.3 A gas analysis consists of the following procedures:
ionizing the sample gas, mass analysis of the ions, quantifying
the mass peaks, correcting for transmission differences of ions
with different mass/charge, assigning fragment ions to their
parent ions and assigning isotopes to their compound. Those
processes are also illustrated in Fig. 1. The last three procedures are not always required. For example, if a measurement
of isotope ratios is to be done, the de-isotoping procedure will
be omitted.
A1R 1 →AR 1
6.7.4 The chemical ionization reaction takes place within
the ion molecule reactor (IMR), that is, where the sample air
stream interacts with the reagent ions produced by the reagent
ion source (Fig. 1). The ion molecule reactor (IMR) is pressure,
temperature and voltage adjusted to control reaction kinetics.
6.7.5 The IMR gas pressure determines the reaction dynamics. We differentiate three different pressure regimes:
6.7.5.1 Low pressure chemical ionization (LPCI): pR < 0.01
mbar: in this pressure regime, ion molecule reactions are rare.
Therefore, secondary reactions are very unlikely. This is the
purest form of chemical ionization, but also not very sensitive.
6.7.5.2 Medium pressure chemical ionization (MPCI): 0.01
mbar < pR < 10 mbar: in this pressure regime collision energies
are sufficiently high to allow disintegrate water clusters;
therefore, the medium pressure regime is used for H3O+
ionization. However, some secondary reactions do happen,
especially with samples of high VOC loads.
6.7.5.3 High pressure chemical ionization (HPCI): 10 mbar
< pR: In this pressure regime secondary ionization is very
likely and the highest sensitivities are achieved since the
reaction collisions are very numerous. This is best suited for
very clean air measurements.
6.4 Gas sampling is usually done with inert tubes, mostly
made of PTFE, PFA, PEEK or equivalent. These tubes are
usually temperature controlled. When measuring semi-volatile
organic compounds (SVOC) the temperature should be above
100 in order to minimize condensation. It is preferable to
keep the sampling lines short and move the mass spectrometer
to the sample.
6.5 Chemical ionization (CI) is chosen in this method
because it is soft, selective and sensitive.
6.5.1 Soft ionization means that only a small number of
fragments are produced from a target compound and a higher
likelihood of production of the charged complete molecule.
This results in simpler spectra and therefore is key for direct
mass spectrometry, for example, analysis without chromatographic separation.
6.5.2 Selective ionization means the main gases (N2, O2) of
the atmosphere are not ionized. This is important to reach low
detection limits. Without selective ionization, the mass spectrometer would be overwhelmed and saturated by the highly
abundant air compounds.
6.5.3 Sensitive ionization means that the signal intensity I
per concentration C of a compound A is large. This allows for
fast measurements and reduces signal-to-noise.
6.8 Mass analyzers come in different varieties with different
properties:
6.8.1 Quadrupole mass analyzers (QMA) are the “traditional” analyzers in PTR-MS. Their resolving power is limited
to “unit mass,” which means isobars cannot be resolved, which
usually is important for CI-MS due to the lack of chromatographic separation. PTR-MS with QMS are ideally deployed
when the monitoring duration is over multiple days or weeks
and a temporal resolution of multiple minutes is acceptable.
6.8.1.1 Quadrupole MS—Analyte ions are measured sequentially in a measurement cycle. In a multiple ion detection
cycle the measurement cycle consists of measuring the reagent
ion (H3O+), other diagnostic ions (O2+, NO+, (H2O)2 H+), and
up to 50 analyte ions. The instrument repeats this cycle
indefinitely storing the data to file.
6.8.1.2 The dwell time (τ) is the length of time the mass
spectrometer spends measuring an ion and can be varied to
improve signal to noise; typically, dwell time is 1 second for
analyte ions. A measurement cycle is the sum of the dwell
times of all analytes being measured, which ultimately determines the time resolution of measurements.
6.8.2 Time-of-flight mass analyzers (TOF) have widely
replaced the QMA in chemical ionization mass spectrometry.
The key differences of TOF-MS instrumentation are the mass
resolution7 of 1 Th (nominal mass) meaning that no elemental
composition identification can be performed; and the staggered
(nonconcurrent) measurement of individual analyte ions. They
can reach high resolving power (R > 10,000) which allows
separation of many isobars which is very useful to compensate
the lack of chromatographic separation. Their high mass
6.6 Chemical ionization means that a compound A is ionized via the chemical reaction with a reagent R. In most cases
the reagent is an ion, which is indicated as Rz where z is the
charge state of the reagent. In some cases, the reagent can be a
neutral, metastable molecule or element, which is indicated as
R●.
6.7 The reaction can be of many different types. Common
reaction types are proton transfer ionization, electron transfer
ionization, or adduct ionization.
6.7.1 PTR-MS uses the reagent ion H3O+ and therefore
ionizes organic analytes (A) via the following proton transfer
reaction:
A1H 3 O 1 →AH 1 1H 2 O
6.7.1.1 Only compounds that have a proton affinity greater
than that of water (693 kJ/mol) can be ionized when using the
hydronium mode of ionization.
6.7.1.2 This reaction may also take place with water cluster
ions (H2O)nH3O+ as reagent ions or adduct ions, which can be
helpful in untargeted analytical approaches.
6.7.2 Electron transfer ionization (ETI) can also result in
positive ionization:
A1R 1 →A 1 1R
7
Mass resolution: ∆M50% = peak width at 50% height, which is approximately
the smallest difference between two peaks M1 and M2 so that they can be identified
as separate signals.
6.7.3 Adduct chemical ionization is sometimes preferred to
H3O+ because it is even “softer”:
5
D8460 − 22
6.9.3.2 De-isotoping means accounting for the mass spectral
signal of the various isotopes of a given compound during peak
integration, and potentially assigning the integrated signal of
less-abundant isotope ions to the monoisotopic ion pertinent to
that compound.
accuracy enables identification of compounds without fragment libraries. They measure all masses simultaneously and
therefore are quite sensitive. In addition, they can be quite
compact and robust.
6.8.2.1 TOF analyzers require a pulsed and cyclic ion
extraction into the field free region of the MS. All ions are
measured in each extraction cycle which repeat at a rate of
typically 10 to 50 kHz dependent upon instrument specifics.
Data from multiple extractions are accumulated into spectra for
predefined time periods (typically 0.01 to 10 seconds) to
improve signal to noise in the spectra.
6.10 Based on reaction kinetics, the number concentration
(in molecules/mL) of neutral VOC [A], in the IMR can be
determined by the following equation:
1 I ~ AH 1 ! E ~ H 3 O 1 !
@ A # 5 kt I H O 1 E AH 1
~ 3 ! ~
!
(1)
where k is the ion—molecule reaction rate constant
(molecules/mL s–1), t is the reaction time (s), I(AH+) and
I(H3O+) are the respective ion counts rates (ions/s), and
E(AH+) and E(H3O+) are the ion transmission efficiencies
through the ion optics and the mass spectrometer. The mixing
ratio or concentration of the organic A in the sample air is then
determined by the following equation:
6.9 The PTR-MS with TOF analyzers are ideal when rapid
changes (bolus events, fugitive emissions) in vapor concentrations are anticipated which require high temporal resolution.
Other mass analyzers such as Fourier transform ion cyclotron
resonance mass analyzers are used primarily in academic
research settings and are not used in field deployments. Data
acquisition system (DAQ) usually includes electronics for
recording the signals from the mass analyzer and a computing
unit.
6.9.1 The recording electronics can be either a time-todigital converter (TDC) or an analog-to-digital converter
(ADC). Whereas TDCs count the ions individually, ADCs
measure the current produced by the ions. TDCs are faster, less
expensive but have a limited dynamic range. With ADCs
becoming faster and mimicking TDC properties, the ADCs
gradually replace the TDCs. Modern ADCs have on-board
processing, which means some data analysis can be done
on-board.
6.9.2 The main processing steps done in the computing unit
are listed in Fig. 1:
6.9.2.1 Peak selection can be done in two different ways:
• Peaks are selected from a pre-defined peak list. This is
referred to as “targeted analysis.”
• Peaks are selected using a peak finder algorithm in
addition to the pre-defined peak list or from scratch. This is
referred to as “non-targeted analysis.”
Many standards include a list of compounds to be measured,
which amounts to a “targeted analysis.”
In many cases, the “peak finding” of peaks that are not in the
peak list is done in post-processing and even manually. The
new peaks can then be added to the predefined list and the
complete data analysis can be repeated. This blurs the line
between targeted and non-targeted analysis.
6.9.2.2 Peak integration collects all signal of an ion species
into a single intensity for that species. This process includes
mass calibration, integration of a signal peak sometimes using
peak fitting, and massspectral baseline correction. These processes can be done either real-time during recording or in
postprocessing.
6.9.3 Transmission correction means accounting for the fact
that the total ion transmission depends on the mass/charge of
an ion. This step does not need to be done when a compound
is quantified using a calibration gas with a known concentration of the compound.
6.9.3.1 De-fragmenting means assigning the signal of multiple fragment ions to their precursor ion.
X~A! 5
@A#
@A#
@A#
5
109 nL⁄L 5
109 ppb
@ A I R # IMR @ A I R # IMR
@ A I R # IMR
(2)
where [AIR]IMR is the number concentration of air
(molecules/mL) in the IMR; this equation may also be adjusted
to take water cluster ion reactions into account.
6.11 In practice the sensitivity of the PTR-MS to various
VOCs is determined by using multicomponent compressed gas
standards to establish the sensitivity s = I/S (signal intensity per
concentration); this sensitivity s is measured in (ions/s)/(nL/L)
= cps/ppb.
6.12 In practice, due to differences in ion-molecule reaction
rate constant and transmission efficiency, and different degree
of fragmentation, different species have different sensitivities.
For example, sensitivities are typically larger for polar oxygenated compounds.
7. Special Skills
7.1 This method aims at post-analytical quantification
aspects. Personnel must be competent in the operation of the
PTR-MS instrument, calibration and blank procedure.
7.2 The user must be educated in the steps to calculate the
normalized sensitivity of VOCs using data collected from the
PTR-MS and calibration and zero system. Ultimately, this
requires the knowledge to determine ambient concentrations of
VOCs from the calculated sensitivities. Personnel should also
be able to estimate the concentrations of tentatively identified
compounds (TIC’s) using calculated sensitivities and proton
transfer reaction rate constant data.
8. Safety
8.1 Components of the PTR-MS are at a high voltage and
protected from accidental human contact. However, care
should be taken to avoid contact with energized parts and only
qualified PTR-MS technicians should attempt repair or maintenance within potentially energized areas of the instrument.
8.2 The multi-component VOC blend is stored inside a
pressurized aluminum bottle with an attached regulator. Before
6
D8460 − 22
movement of the bottle from the security straps, the regulator
should be removed and the bottle head should be covered with
the supplied cap. Safety Data Sheets (SDS) for chemicals, such
as analytes and solvents, should be consulted before use. The
user of this test method should also be aware of the hazards
associated with the operation of the multicomponent VOC
blend that contains many toxic compounds. Therefore, the
exhaust of the calibration and zero system and PTR-MS should
be vented outside the analytical workspace to avoid contamination of the air with the compounds of the multi component
VOC mixture. In case of primary ion sources other than
hydronium, such as O2, standard safety procedures are to be
consulted for handling gas cylinders with such content.
8.3 Turbomolecular vacuum pumps can fail catastrophically
if suddenly exposed to high pressure while they are operating,
which could present a hazard to humans or property. Turbomolecular pumps should be turned off and allowed to come to a
complete stop before the instrument is vented.
9. Setup, Sample Collection, and Handling
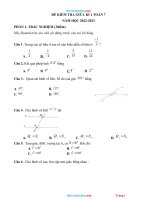
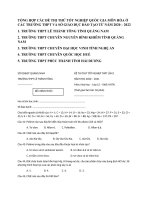
9.1 Fig. 2 illustrates the schematic layout of a basic
PTR-MS system. Due to the connection with ZeroAir, a
dilution of the actual sample can be performed in case of large
amounts of VOC emissions that can overwhelm the instrument.
An example could be the investigation of alternative pathways.
For calibration the 2-way valve is switched to the calibration
gas, while for measurements the valve is switched to the
sample inlet side. The sample inlet side can be either a single
line of tubing or could be a multi-valve that switches between
multiple sampling lines. Due to the relatively low flow rate of
the PTR-MS, which is in the range of 100 sccm, it is usually
beneficial to use a secondary pump and subsample from that
main flow.
9.2 More sophisticated setups have been shown to be
adequate for specific problem settings, such as GC-PTR-MS.8
FIG. 2 Basic Configuration of a Calibration and Sampling System
for PTR-MS Analysis
9.3 The PTR-MS does not require any pre-conditioning of
the sample. While filters can be used to remove larger dust
particles, these can also interfere with the vapor content of a
sample. A virtual-impactor setup is recommended, in which the
PTR-MS samples a small flow orthogonally from a much
larger flow supplied by an external pump (see Fig. 2). Depending on the ambient air conditions, some advantages can also be
gained through different sampling techniques such as the use of
cold traps, nafion dryers, thermal desorption or sample dilution
using either a mass flow controller or flow orifices, however,
this is not a requirement for general indoor sampling and
analyses.
9.5 To provide the optimal sample to the instrument guidelines are provided by several ASTM standards, such as, D5314
and D5730. Minimal calibration requirements are shown in
Table 2.
9.6 The sampling line is to be kept at a stable temperature
into the instrument, ideally with increasing temperature from
the point of sampling to the IMR. This avoids the so-called
cold spots, which are areas within the sampling line colder than
the ambient temperature and which potentially produce false
results due to condensation on the walls. However, due to the
pressure difference between the ambient pressure and in the
IMR, the temperature within the chamber can be reduced up to
20°C in comparison to the inlet tube temperature while still
preventing condensation of sampling constituents. This is
beneficial to further reduce the amount of fragmentation for
labile compounds during ionization.
9.4 The sampling line can be extended to the length required
by location. Standard tubing diameters in the U.S. are 1⁄4 in.
(6.4 mm) or 3⁄8 in. (9.5 mm) OD; PFA or FEP are materials with
a very good (that is, low) retention and price. Sampling lines of
up to 100 feet (30.5 m) can be set up.
10. Operating Procedure
8
Such systems have a reduced ability for real-time monitoring but an additional
layer of separation which can be beneficial in tracking very low concentrations of
target analytes; a side benefit is that this setup would fulfill the criteria to apply U.S.
EPA method 18. For comparison of such methods see Warneke et al. (2015) (4).
10.1 Startup and Operating Steps—The individual steps on
how to setup a PTR-MS run are highly dependent on the
7
D8460 − 22
calibrant gas with a larger flow of zero air, such that the signals
for the ions pertinent to the compounds in the calibrant mixture
dominate any neighboring interferences. As delineated in the
chapter on mass calibration, two points or more are to be used,
in the low (21.0232 Th for H3O+ isotope or NO+ at 29.9987
Th) and upper range (for QMS, alpha-pinene at 137 Th, for
TOFMS 203.9940 Th from the fragmentation of 1,3-diiodobenzene if present or an equivalent standard in the range of
analysis); a simple validation is to briefly breathe into the inlet
and check for the mass of protonated acetone, which is 59.0865
Th.
individual instrument’s operating software. The general steps
described below serve to assure quality control. For details on
how to start the instrument and how to setup the parameters for
analysis, such as IMR temperature, pressure, and voltage,
sample inlet temperature, characteristics of the detectors and
ion optics modules (if present) and of the output files are to be
identified using the manufacturer’s guidelines.
10.2 Leak Detection—Upon start-up it is necessary to tune
the ion source and identify the presence of a leak in the
instrument. Leaks should not occur during normal use of the
instrument. In case the vacuum chamber pressure doesn’t reach
the appropriate range within regular time frames of initial
startup (typically 15-45 minutes for QMS, 1-3 hours for
TOFMS), a vacuum leak is the cause for such a delay. Should
the system fail to pump to the required vacuum, the leak must
be found and corrected.
11. Interferences
11.1 The PTR-MS identifies compounds as the molecular
mass of the chemical species plus the mass of one proton when
using hydronium ions for ionization. The technique is therefore
limited by isobaric interferences for PTR-QMS and isomeric
interferences for PTR-TOFMS with higher than mass unit
resolution. One approach to identify interferences is to use
different reagent ions, such as O2+ or NO+ and use the
potentially different reaction mechanisms in the IMR as a
separator. Also, some species fragment upon ionization. Another way to separate isomers is to use GC, see 9.2).
10.3 Tune Ion Source—The ion source is tuned to optimize
the H3O+ count rate and keep the O2+ count rate less than 2 %
of the H3O+ count rate by using dry VOC-free air. To tune the
ion source the following ions are measured: H3O+, O2+, NO+,
H2O+, (H2O)2 H+. The ion source is tuned by adjusting the H2O
flow through the ion source, by adjusting the ion source
current, and by adjusting the voltages of the secondary IMR
lenses. At this point the detector voltage can be increased to get
H3O+ count rates into the desired range (actual rates of ions/s
depend on the individual instrument model and are usually
provided by the manufacturer). Equivalently, the ion ratios of
O2+ to H3O+, (H2O)2 H+ / H3O+, and NO+ / O2+ are
performance indicators, but the actual numbers of these ratios
are instrument-dependent and vary between manufacturers.
11.2 An important contributor to analyte fragmentation is
the reaction with O2+; this ion is produced along with the
hydronium ion (H3O+), but the IMR is tuned to increase the
concentrations of the hydronium ion and reduce the concentrations of the O2+ ion. As the ion source ages, the abundance
of interference ions such as O2+ slowly increases (see 10.3 on
tuning of the source). O2+ ionizes the VOCs of interest mainly
through charge transfer reactions. The reaction is a form of
hard ionization and typically fragments the VOCs of interest
which can lead to either overestimation of some compound
concentrations through the interference by fragment ions or the
underestimation of some VOC concentrations due to the loss of
the primary ion. The O2+ concentration should be monitored
and recorded at a minimum daily and if found out of control
based on the manufacturer’s specifications, the IMR retuned
according to the manufacturer’s guidelines.
10.4 Tuning of Alternative Ion Sources—If an ion source
different to hydronium is chosen, the source ion needs to be
optimized. Due to the large number of potential source ions,
only hydronium is specifically described within this guideline.
An individual optimization protocol shall be developed within
the sampling plan. In addition, many of these ion sources
ionize the analyte by reactions other than proton-transfer.
These include the use of NO+ and O2+ as reagent ion.
10.5 Mass Calibration (Internal Standard)—Before measurements are to be made, the mass-scale calibration must be
verified. The mass calibration verifies that the ion peaks are
centered over the correct value of the ion mass.
11.3 NO+ is also produced in the source, but to a lesser
extent than O2+. This ion undergoes soft ionization reaction
with several common analytes resulting in detectable interferences. The ion can also fragment some VOC species resulting
in further interferences.
10.6 Mass drift can occur for various reasons, the most
important being temperature changes and vibrations during
transportation. A good practice is to perform a quick mass
calibration verification check after every transport. Several
instruments provide internal “continuous” mass calibration. By
injection of an inert substance such as 1,3-Di-iodobenzene into
the IMR a permanent signal is generated that the instrument
can target. With such an omnipresent signal, software algorithms can validate the accuracy of the peak center every
minute or less; these autocorrection features have limitations.
11.4 Water dimers and larger clusters formed through the
hydration of the reagent ion can also positively interfere with
the quantification of polar species such as ketones, aldehydes
and organic acids. If a species has a proton affinity greater than
the water dimer, then the organic compound will be ionized
through proton transfer reaction from the water dimer. Polar
species can also be ionized through ligand switching reactions
with the water dimers. Because the basic calculation of the
sample compounds is a function of the reagent ion only and not
from ionization from any other means, the quantification of the
sample compound will be positively biased due to the presence
of water dimers. The formation of water dimers is controlled
through tuning the IMR voltage across the IMR. The drift
10.7 In case the calibration is off by more than one mass in
the target region, the algorithms usually cannot identify the
appropriate peak. In this case, a manual calibration with a
known standard gas mix is advised by mixing a small flow of
8
D8460 − 22
voltage controls the velocity the ions travel down the IMR. The
water dimers break apart through random collisions with other
molecules in the flight path. Increasing the voltage results in a
lower abundance of water dimers through forced fragmentation
but may also decrease the abundance of ionized sample VOCs
through loss of the proton by random collisions. The IMR
voltage is tuned to minimize the water dimer interference while
maintaining the sensitivity to VOCs.
12. Quality Control Measures
12.1 Table 2 provides the recommended quality control
TABLE 2 Quality Control Protocol for Continuous Monitoring with PTR-MS
Activity
Ion source tune
Initial Multipoint Calibration (ICAL)
Frequency
Prior to ICAL and prior to each 24-hour period of
sample analysis
After movement of the instrument to the test site
At the beginning of a sampling campaign
Initial Calibration Verification (ICV)
Once after each ICAL to verify source standard.
Continuing Calibration Verification (CCV)
Daily before sample analysis, if continuous, after
every 24 hours of analyses, and at the end of the
batch run.
System (Method) Blank
Once after the first CCV, and prior to starting field
analysis.
In addition, after sampling gasses of high
concentration or high humidity.
Mass Calibration (represents the internal standard)
Continuous
Ionization Softness (based on fragmentation of
alphapinene/isoprene)
Daily
9
Comments
See 10.3.
Minimum of 5 concentrations, one of them being at
the CCV level and the lowest being at or below the
LOD. Acceptable if linear least square regression for
each analyte is $0.99.
If ICAL fails, rerun, if still fails, check dilution
apparatus, check if zero air source is functional,
verify there is no leak in the system (that is, no
diluting with ambient air).
Analytes should cover as many targets as possible,
however reaction kinetics approach does not require
all analytes being present in calibration (see
14.2.1.3).
All reported analytes of the laboratory control
sample (LCS) within ±30 % of certified value (either
certified gas cylinder or pre-made canister).
If ICV fails, rerun ICV, if still fails, repeat ICAL.
Concentration of the mid-point level of ICAL. All
analytes within ±30 % of the true value.
If CCV fails, analyze two consecutive samples of at
least 5 seconds each. If both pass in comparison
with last CCV but fail with ICV, check for drastic
changes in humidity. Some analytes have strong ties
to humidity levels, such as formaldehyde.
If humidity had drastic changes, explain in Case
Narrative. In any case, since measurements are
continuous and cannot be repeated, apply Q-flag to
all results for the specific analytes for the duration of
failure. Data can be reported but must be explained
in the Case Narrative.
The method blank is zero air – either provided
through a certified canister/cylinder or through
generator system.
No analytes shall be detected higher than 1⁄2 LOQ or
1⁄10 of the amount measured in any sample or 1⁄10
the regulatory limit, whatever is greater. Common
interferences must not be detected larger than LOQ.
If it fails, perform investigation on source and take
appropriate corrective actions. In some cases,
running the instrument overnight, capped, under
high vacuum is sufficient to remove contamination
from the IMR. If contamination is found in sampling
system, exchange tubing if feasible; pull zero air at
elevated temperatures through sampling system to
clear out.
If MB fails and reanalysis cannot be performed,
report data with a “B”-flag to all results.
Continuous mass calibration verification is performed
by monitoring the masses that always exist within
the mass spectra, such as the primary ions 19 Th,
21 Th, or 55 Th or by using the instrument specific
sources as continuous internal standard, such as
di-iodobenzene or chlorinated fluorocarbons.
For pass, the area response must be within 40 % of
the mean area response.
The ionization softness is reflected by the
fragmentation ratio of selected substances such as
isoprene or alphapinene. The recommended
fragmentation ratio of alphapinene should not be
greater than 55 % for the ratio of ions/s at 81 Th/(81
Th + 137 Th). In case the fragmentation ratio is too
high, the results shall be flagged with “IS.”
D8460 − 22
measures for continuous monitoring.9
TABLE 3 Calibration Gas Mixture Recommended for Ambient Air
Measurements (each analyte ~200 nL/L = 200 ppb)
13. Calibration and Standardization
Molecular ID
CH4O
C2H3N
C3H6O
C2H3Cl
C4H8O
C6H6
C7H8
C2H2Cl2
C8H8
C8H10
C9H12
C2HCl3
C10H14
C2Cl4
13.1 Blanks are used for background subtraction. Performing routine analytical blanks is important for quantifying the
ion counts in the absence of analyte VOCs. A blank can be
performed by overflowing the inlet with zero air, which is
typically provided from a generator or from a zero air gas
cylinder. Sometimes zero gas requires additional cleaning from
remaining VOCs using a scrubber/filter that contains activated
carbon.
13.2 Analytical blanks are conducted before and after a
sample is taken, after sampling gasses of high concentration
(causing saturation), high humidity variations and after the first
CCV. When conducting continuous sampling, analytical blanks
are conducted every eight hours at a minimum. More frequent
analytical blanks should be conducted when sampling gasses
with high concentrations of volatile compounds such as acetone are anticipated or experienced. An analytical blank must
contain 10 sampling points (10 cycles for QMS or 10 seconds
for TOFMS) or, after a saturation event, one continues until
background count rates have returned to the original levels.
Saturation is determined by the lack of primary ions in the
spectrum, so for the hydronium one uses peak intensity of m/z
= 21.0224 (O18 isotope of H3O+).
Name
Methanol
Acetonitrile
Acetone
Vinyl Chloride
2-Butanone
Benzene
Toluene
1,2-Dichloroethylene
Styrene
p-Xylene
1,3,5-Trimethylbenzene
Trichloroethylene
1,2,3,5 Tetramethylbenzene
Tetrachloroethylene
provide the vapor that is then mixed with zero air for dynamic
or static dilutions. The LCS is used for the initial and
continuing calibration verification (ICV and CCV).
13.5 An instrument calibration curve is typically derived
from a zero-calibration-zero sequence; this sequence begins by
sampling five sampling points or more of zero air followed by
sampling 5 sampling points or more of the calibration gas with
decreasing concentrations. The starting point of the calibration
gas mix shall be around the anticipated maximum concentration of analytes and gradually diluted to 100-fold or more; to
achieve the needed concentrations an appropriate standard gas
mixture has to be used and gradually diluted with zero air. The
example contents of one such standard are shown in Table 2.
The sequence ends by sampling an adequate volume of zero air
to flush the instrument and calibration system.
13.3 The timescale of the zero measurement should be
timed with the timescale of variability required of the
measurement, as zeroing the instrument disrupts the equilibrium between the instrument surfaces and the sample air flow.
It follows that after long timescales of measuring clean air, the
instrument is “cleaner” (has lower background) than shortly
after measuring a polluted air sample. For example, measurements of a vapor intrusion hot spot, which requires 1 second
measurements should not base the background on 1 hour zero
measurements as the background will be measured systematically low.
13.6 The sensitivity s is calculated using the following
equation:
s~A! 5
I cal ~ AH 1 ! 2 I zero ~ AH 1 ! I cal ~ AH 1 ! 2 I zero ~ AH 1 !
5
C cal ~ A !
C cal ~ A !
3 109 ppb ~ nL ⁄ L !
13.4 Calibrations are used to determine the sensitivities of
compounds. They can be performed by producing a laboratory
control sample (LCS) from a metered flow of a NIST traceable
multi component gas standard and a metered flow of the zero
air mixed through dynamic dilution using an apparatus as
sketched in Fig. 1. A calibration mixture at various concentrations is produced by altering the flow rates of the calibration
mixture and/or zero air; see Table 2 for the composition of a
recommended calibration mixture for ambient measurements.
For the composition of a typical calibration gas mixture to be
used in the dilution series, see Table 3. The two gas flows are
metered using mass flow controllers. This mixture is introduced to the PTR-MS at various concentrations to conduct a
multipoint calibration; a minimum of 5 calibration points shall
be performed. The concentration range should bound the
expected concentration of the analytes under evaluation.
Alternatively, liquid calibration systems (LCS) are available
that use liquid standards and nebulizers of various kinds to
(3)
13.7 The sensitivity of analyte A is calculated by taking the
difference between the instrument’s response Ical(AH+) and the
instrument’s background Izero(AH+) and dividing it by the
calibration concentration (Ccal). The sensitivity for each compound A should be calculated using the average of multiple, at
least 5, known concentrations from diluting a gas standard (for
example, the LCS). The range of the selected concentrations
during the calibration should be selected in order to span the
range of expected analyte concentrations.
13.8 The transmission function describes the mass dependent efficiency between the transfer system, the actual mass
separation and the detector. The transmission is a function of
the mass/charge, therefore E = E(m/Q). For the transmission
calculation a gas standard mixture is used. The compounds of
the gas mixture must be selected in order to cover a wide range
of masses and not to interfere with each other. The QMS
system has a higher transmission in the low masses while the
TOFMS system has higher transmission in the higher masses.
In some instances, multiple transmission curves need to be
prepared if there are optional ion funnel settings. Such settings
can immensely increase the sensitivity, however, in some cases
9
This table is based on common laboratory practices, such as laid-out in (and
adapted from) Table B-21 of the U.S. DOD/DOE QSM 5.3, Appendix B, 2019.
10
D8460 − 22
such increases cause the need for severe dilution of common
VOC concentrations in indoor air.
14.1.2 There are many other possible definitions of
concentration, including any permutation of the three quantities used to measure mass m, volume V, abundance (= number)
N.
14.1.3 The signal S can also be defined or measured several
ways. It can be a voltage, a current, or a number of events. In
the case of mass spectrometers, the signal is usually transformed into number of ions, and because PTR-MS is usually
recording data continuously in a cyclic method, the signal is
actually regarded as a signal intensity I = signal per time (S/t)
with units ions/s.
14.1.4 Accordingly, the sensitivity can also come in many
different forms. For the purpose of this standard:
13.9 Method Detection Limits—The method detection limits
(MDL) are determined from zero air. The detection limit is
different per compound A. Limiting factors on precision and
detection limits of PTR-MS measurements are the counting
statistics of analyte ions, which follow a Poisson distribution:
the 1-σ error of counting S ions is =s . Thus, a compound A
will have signal (S) equal to:
S 5 I ~ AH 1 ! ·t c 2 I zero ~ AH 1 ! ·t c
the noise or error N will be:
N 5 =S 5 =I ~ AH 1 ! ·t c 2 I zero ~ AH 1 · t c !
s~A! 5
where tc is the time of each measurement cycle. The limit of
detection (LOD) of the analyte A will be I(AH+) when S/N = 3
can be found by solving:
S⁄N 5
I LOD ~ A ! ·t c 2 I zero ~ AH 1 ! ·t c
=I LOD ~ A ! ·t c 2 I zero ~ AH 1 ! ·t c
53
(4)
14.2 Signal Intensity—Even though PTR-MS provides real
time qualitative measurements to the user, QC/QA validated
data need to be thoroughly analyzed and validated for customer
reporting. This can be performed within automated software
approaches and the real time data can thus be reported
quantitatively. The signal intensity is evaluated from the mass
spectra in two steps:
• Sample gas measurement, which includes all processing
indicated in Fig. 1.
• Background subtraction.
14.2.1 A sample gas measurement, as shown in Fig. 1,
includes several processing steps which are usually done
automatically.
14.2.1.1 Mass Calibration—Although this step is performed
during analysis, inspection of the resulting data can identify
issues that are based on incorrect mass calibration. The
following step, peak integration, relies on a good mass calibration.
14.2.1.2 Peak Integration—This step is only necessary
when using TOFMS. The QMS provides nominal mass data.
The raw data of the PTR-TOF are consecutive mass spectra
14.1 The quantification of PTR-MS data always uses the
same basic principle, expressed in Eq 5. The concentration of
a substance A is calculated from the signal S of this substance
and the sensitivity s of this substance:
S~A!
s~A!
(7)
14.1.4.1 The unit of the sensitivity is either cps/ppb which is
commonly used, but not SI compliant. The SI compliant
equivalent is (ions/s) / (nL/L) or Hz / (nL/L).
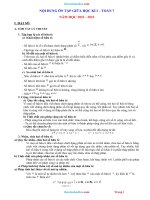
14.1.5 In the following steps, the signal intensity I and the
sensitivity s are determined in order to find the concentrations
C using Eq 5. This is illustrated in Fig. 4.
14. Quantification Procedure
C~A! 5
I~A!
I~A!
5
C NN ~ A ! C VV ~ A !
(5)
(see Fig. 3)
14.1.1 Eq 5 is a reversal of the definition of sensitivity,
which is: sensitivity = signal / concentration:
S~A!
(6)
C~A!
NOTE 2—The concentration C can have many different meanings in this
case, it can be: of A.
• A number density CVN (A) = N(A) / V where N(A) is the number of
particles of A and V is the total volume.
• A particle concentration CNN = N(A) / N(air) where N(air) is the total
number of particles.
• A volumetric concentration CVV = V(A) / V where V(A) is the partial
volume of A.
Note that for ideal gases CNN = CVV, this is why the non-SI unit ppb can
be replaced by the SI unit m3/m3.
s~A! 5
FIG. 3 Basic Workflow of a Quantitative Measurement to be Refined in Fig. 4
11
D8460 − 22
FIG. 4 Workflow of a Quantitative Gas Analysis Using Zero Air Measurement as a Blank for Background Subtraction and Calibration
Gas Measurement to Retrieve the Sensitivities
shall be taken. In case of large variations, the source for these
variations needs to be identified within the time sequence and
separate background values identified. For instance, a previously sampled material could have been retained in either the
sampling lines or even within the instrument due to cold spots
and condensation effects. In such cases, the replacement of the
sampling lines is normally the only way to successfully remove
the contamination.
that contain, depending on the mass resolution, multiple peaks
per each nominal mass, representing isobars (= molecules with
the same number of nucleons but different chemical composition). The signal of each peak (representing compounds) has to
be integrated in order to extract quantitative information. Some
software programs offer an automatic integration, but the
analyst should have a validating approach to such algorithms to
ensure appropriate deconvolution of overlapping peaks. Various peak fitting options are typically available; for details the
instrument guidelines need to be consulted. The peak fitting or
integration process also includes a mass spectral baseline
correction which accounts for signal from electronic noise,
stray ions and peak tails.
14.2.1.3 Ion Transmission Correction—The transmission
function E(m/Q) describes the mass dependent efficiency
between the transfer system, the actual mass separation and the
detector. For the transmission calculation the same gas standard mixture is used as for general calibration of the instrument. The mixture contains multiple compounds (>10 preferably) in the mid nL/L (ppb) concentration range (see Table 2).
These compounds shall be selected in order to cover a wide
range of masses and not to interfere with each other (Table 3).
The mixture is then diluted with zero air in ratios ranging from
1/10 to 1/100 and introduced to the PTR-MS. Based on the
response signal the transmission calculation can be performed.
I m ~ AH1 !
I ~ AH ! 5
E ~ AH1 !
1
14.3 Sensitivity—PTR-MS offers multiple different ways to
retrieve the sensitivity:
14.3.1 Sensitivity by Direct Calibration—the concentration
of the compound of interest is evaluated using a calibration gas
analysis of the compound with a known concentration, and a
zero-gas analysis, according to Eq 3. This is the official method
of this standard.
14.3.1.1 Compound specific sensitivities are measured using a gas standard with the compounds of interest as mentioned
in 11.2. In order to achieve reasonable precision on the
sensitivities, a calibration curve with 4 to 5 points of dilution of
the gas standard is recommended.
14.3.1.2 The sensitivity is the slope of the calibration
function:
I ~ A ! 5 s ~ A ! ·C NN ~ A !
(9)
This method is the most accurate, but it is limited to the
compounds contained within the gas standard used for calibration. For this method there is no need for the calculation of the
transmission efficiency of the instrument or the definition of the
reaction rate constant. The same approach can be used when a
reagent ion different from H3O+ is used, such as O2+ or NO+.
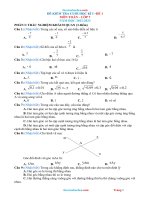
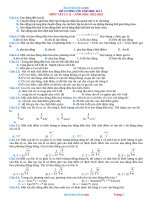
14.3.2 Sensitivity by Interpolation to a Fitted Curve—If a
compound needs to be quantified that is not in the calibration
gas cylinder, but its reaction rate constant k is known, its
sensitivity s can be estimated based on an interpolation
between the measured sensitivities of the calibrant compounds.
This is illustrated in Fig. 5. This interpolation is not very
precise. However, the reaction rate values fall within a narrow
range (within a factor 2), and so sensitivities also generally fall
within this range.
(8)
14.2.1.4 Some software allows for a multiplier to account
for potential fragmentation pathways, isotopes or by-products.
14.2.2 Background Subtraction—In this step, the zero gas
concentrations (blank) of the instrument is subtracted from the
sample gas concentrations. The background ion intensity for
any VOC being measured by PTRMS will usually be more
than zero due to electronic noise, sampling equipment contamination and instrument contamination. The background
signal differs per compound, instrument, and operational conditions. The amount is empirically determined by evaluating
the analytical blanks; if the concentrations of the targeted
species show small variations within the blanks, the average
12
D8460 − 22
FIG. 5 Sensitivity Curve for Different Compounds
(protonated) analyte. Based on reaction kinetics the concentration of the analyte A will be equal to:
14.3.2.1 The sensitivities of the calibration compounds are
plotted in a sensitivity versus reaction rate graph. This requires
that the reaction rate constants of the calibrants are known. The
sensitivity of compounds not present in the calibration gas can
then be interpolated based on their reaction constant k.
14.3.3 Kinetics Approach—This rather unique ability, in
comparison to other analytical techniques, is the calculation
based on reaction kinetics. No gas calibration is required. The
sensitivity is calculated using instrument parameters and reaction rates k. However, this method requires precise knowledge
about both the transmission function E(m/Q) and IMR operating conditions, as well as accurate measurement of the reagent
ion signals.
14.3.3.1 This quantification method relies on well-defined
conditions in the IMR and the previously determined kinetics
of proton transfer reactions. The great strength of this approach
is the ability to calculate mass concentration for any compound
for which the reaction rate constant is known or can be
estimated by established laboratory techniques. The mass
concentration is calculated based on the physical conditions in
and of the IMR (pressure, length, temperature, voltage, ion
mobility), which are continuously recorded during the instrument operation.
14.3.3.2 Based on the principle of operation, reagent ions
(H3O+, O2+, NO+) are produced in the ion source and introduced in the IMR where they undergo collisions with the
sample gas molecules. When a reagent ion collides with an
analyte A, the proton is transferred resulting in the ionized
C VN ~ A ! 5
and
1 C VN ~ AH 1 !
1 I ~ AH 1 !
I ~ AH 1 !
· N
·
1 5
1 5
k·t C V ~ H 3 O ! k·t I ~ H 3 O !
s~A!
(10)
I m~ H 3 O 1!
E ~ H 3 O 1!
(11)
s ~ A ! 5 k ~ A ! ·t ~ H 3 O 1 ! ·I ~ H 3 O 1 ! 5 k ~ A ! ·t·
where k(A) is the reaction rate of A with H3O+ (molecule
cm–3 s-1), t is the reaction time (s), I(AH+) and I(H3O+) are the
respective signal intensities (ions/s), and E(AH+) and E(H3O+)
are the ion transmission efficiencies.
14.4 Concentration—The concentration of a sample is then
calculated by dividing the background corrected ion signal of
the sample by the sensitivity:
C VN ~ A ! 5
I ~ AH 1 ! 2 I zero ~ AH 1 ! I ~ AH 1 ! 2 I zero ~ AH 1 !
5
3 109 ppb
s~A!
s~A!
(12)
14.5 Concentration Conversion—If the number concentration is required, it must be calculated using the following
equation:
C VN ~ A ! 5 C NN ~ A ! ·C VN ~ air!
(13)
N
14.5.1 The number concentration [air]R = CV (air) of air
(molecules per cubic centimeter) in the IMR is equal to:
N
T p
A
0
R
@ air# R 5 C VN ~ air! 5 V · T · p
m
R
0
13
(14)
D8460 − 22
16. Maintenance
where:
NA
= 6.022 × 10 23
molecules/mol = Avogadro
constant,
= absolute standard temperature = 273.15 K,
T0
= absolute temperature in the reactor (in K),
TR
= 1013 mbar = 1013 hPa = standard pressure,
p0
= pressure in reactor in hPa or mbar,
pR
Vm
= molar
volume = 22400
mL ⁄mol = 22.4
L/mol = volume per mol of gas at standard
conditions
CVN (air) = number concentration of air in the IMR (in
molecules/mL = molecules ⁄cm3)
16.1 Basic Maintenance—If hydronium ions are the primary
ion source, the hydronium source is fed from a water reservoir
that generates water vapor. Depending on the size of the water
reservoir it needs to be refilled every one to six months. The
water level can be either visually assessed, or by the inability
of the water vapor flow controller to reach its set value. This
can also happen when the operating temperature is too low, that
is, close to water freezing temperature. For refilling the water
reservoir follow the steps in the vendor’s maintenance manual.
In addition, the instrument needs regular cleaning with a
vacuum cleaner (once per two months or more frequently
depending on the deployment areas) to prevent dust accumulation at the cooling fans.
14.5.2 Therefore, the number concentration of compound A
becomes:
C VN ~ A ! 5 C NN ~ A !
NA T0 pR
· ·
Vm TR p0
(15)
16.2 Do not use antifreeze in the water source. The volatile
organic sources in antifreeze will highly interfere with the
primary ion production.
15. Report: Test Data Sheet(s)/Form(s)
15.1 Due to the nature of continuous monitoring the reporting requirements can vary highly. Independent of additional
regulatory requirements, record the following general information (data):
15.1.1 Project Identification/Location
15.1.2 Sample locations, sample types, sample
identifications, sample definition.10
15.1.3 Test Numbers, Testing Dates, Initials or names of
person(s) performing the test.
15.1.4 Sample preparation methods used (filters, length and
condition of sampling lines, GC in front, concentration on
adsorbent material).
15.1.5 Equipment Identification (quadrupole or time-offlight with mass resolving power).
15.1.6 Calibration Gas(es) used, along with batch or serial
numbers.
15.1.7 Humidity, temperature, barometric pressure, wind
direction and wind speed (in particular for outdoor measurements) or other conditions that could affect the test results such
as HVAC on/off, workday/weekend.
15.1.8 Results of QA/QC.
15.1.9 Results of the test (the data itself). This can be done
in the form of averaged concentrations over the defined
samples, or as required by the customer. The presentation of
these results can be in the form of the individual datapoints
over time or time averaged data depending on the definition of
a sample (see footnote).
15.1.10 Any sketches, maps or other graphic information
that would be useful for presentation or evaluation of the data.
16.3 The calibration gas cylinder needs to be checked
regularly to determine whether the working pressure is still
sufficient.
16.4 Advanced Maintenance—For continuing optimal performance several parts require periodic servicing: the ion
source, ion gauges, sampling lines, diaphragm pump, and
turbomolecular pumps; service kits for the respective devices
should be kept in stock. Such maintenance should be performed every 12-24 month timeframe, depending on the usage
of the instrument.
17. Precision and Bias
17.1 Bias—There is no accepted reference value for this test
method, therefore, bias cannot be determined to date. In an
effort to close this gap, the method is currently compared to
discontinuous analyses techniques using the same standardized
material. The results of these inter-method comparison of
PTR-MS with ASTM D5466 – 2, Standard Test Method for
Determination of Volatile Organic Compounds in Atmospheres
(Canister Sampling, Mass Spectrometry Analysis Methodology) will be used for a modification of this section upon
completion.
17.2 Precision—Test data on precision are not presented due
to the nature of this test method. It is either not feasible or too
costly at this time to have ten or more agencies participate in
an in-situ testing program at a given site. Subcommittee
D18.21 is seeking any data from the users of this test method
that might be used to make a limited statement on precision.
17.2.1 Peer reviewed published comparisons between PTRMS, GC-MS, GC-FID and other techniques are available, for
example as in Yuan et al. (2017) (1) and Dunne et al. (2018) (2)
and references therein; the latter reference also provides
in-depth explanations on interference corrections for
quadrupole-based measurements.
17.2.2 Currently an interlaboratory study is initiated,
ILS#1663, and results will be available in a published report
upon completion.
10
As for all continuous monitoring techniques, the definition of a “sample” in the
field is not clearly defined and driven by the circumstances of each project. The
amount of data from multiple hours of continuous monitoring with a PTR-MS can
be overwhelming information. Clearly identified data quality objectives for what
defines a sample by the customer need to be obtained prior to starting a sampling
campaign. Examples for definitions of samples include: (1) each room in a building,
(2) each potential alternative pathway, (3) each building on a multiplex unit, (4)
exceedance of specific internal temperature/pressure, (5) opening/closing of
windows, doors etc., (6) air conditioning system on/off, (7) workday operation
versus weekend, etc. Guidance on criteria to be considered can be found in
D8408/D8408M, Standard Guide for Development of Long-Term Monitoring Plans
for Vapor Mitigation Systems.
14
D8460 − 22
18. Keywords
18.1 air toxics; ambient atmospheric analysis; hazardous
vapors; mass spectrometry; proton transfer reaction; real-time
environmental monitoring; site characterization; vadose zone
gases; vapor intrusion; VOC
REFERENCES
and J. Conca, “Proton Transfer Reaction Mass Spectrometry as a
Real-Time Method for Continuous Soil Organic Vapor Detection,” in
Continuous Soil Gas Measurements: Worst Case Risk Parameters, ed.
L. Everett and M. Kram (West Conshohocken, PA: ASTM
International,
2013),
32-44.
/>STP157020130026.
(4) Warneke et al (2015) PTR-QMS versus PTR-TOF comparison in a
region with oil and natural gas extraction industry in the Uintah Basin
in 2013. Atmos. Meas. Tech., 8, 411-420.
(1) Yuan et al (2017) Proton-Transfer-Reaction Mass-Spectrometry: Applications in Atmospheric Sciences. Chem. Rev. 2017, 117, 1318713229.
(2) Dunne et al (2018) Comparison of VOC measurements made by
PTR-MS, adsorbent tubes-GC-FIDMS and DNPH derivatizationHPLC during the Sydney Particle Study, 2012 - a contribution to the
assessment of uncertainty in routine atmospheric VOC measurements.
Atmos Meas. Tech., 2018, 11, 141-159.
(3) J. Sears, T. Rogers, J. McCoskey, L. Lockrem, H. Watts, L. Pingel,
ASTM International takes no position respecting the validity of any patent rights asserted in connection with any item mentioned
in this standard. Users of this standard are expressly advised that determination of the validity of any such patent rights, and the risk
of infringement of such rights, are entirely their own responsibility.
This standard is subject to revision at any time by the responsible technical committee and must be reviewed every five years and
if not revised, either reapproved or withdrawn. Your comments are invited either for revision of this standard or for additional standards
and should be addressed to ASTM International Headquarters. Your comments will receive careful consideration at a meeting of the
responsible technical committee, which you may attend. If you feel that your comments have not received a fair hearing you should
make your views known to the ASTM Committee on Standards, at the address shown below.
This standard is copyrighted by ASTM International, 100 Barr Harbor Drive, PO Box C700, West Conshohocken, PA 19428-2959,
United States. Individual reprints (single or multiple copies) of this standard may be obtained by contacting ASTM at the above
address or at 610-832-9585 (phone), 610-832-9555 (fax), or (e-mail); or through the ASTM website
(www.astm.org). Permission rights to photocopy the standard may also be secured from the Copyright Clearance Center, 222
Rosewood Drive, Danvers, MA 01923, Tel: (978) 646-2600; />
15