a general equilibrium model for energy policy evaluation using gtap-e for vietnam
Bạn đang xem bản rút gọn của tài liệu. Xem và tải ngay bản đầy đủ của tài liệu tại đây (625.76 KB, 12 trang )
The 3
rd
IAEE Asian Conference
(International Association for Energy Economics)
A General Equilibrium Model for Energy Policy Evaluation using GTAP-E for Vietnam
Long Dodinh
1
, Suduk Kim
2*
1
Graduate School of Energy Studies, Ajou University, Suwon, Korea
*
Corresponding Author. Tel: 031-219-2689, Fax: 031-219-2969
E-mail:
1
,
2*
Abstract:
In this paper, a computable general equilibrium model (CGE) using GTAP-E for Vietnam is presented based on the GTAP
Data Base version 7. The model is developed following the original structure of GTAP-E model (Burniaux and Truong
2002) and the revised version of the GTAP-E model (Mc Dougall and Golub 2007). Further, as a second step, a dynamic
GTAP-E model is developed based on the theoretical structure of dynamic GTAP and the GTAP-E model for Vietnam for
the period of 2004-2025.The model is used to simulate the adoption of alternative carbon tax for Vietnam for the based year
of 2004 and for the period of 2008-2025. The economy-level and detailed sector-specific effects are also examined
considering energy intensive and non-intensive sectors. As a matter of fact, this is the first simulation of energy-
environmental policy for Vietnam using the updated version of the GTAP-E.
Key words: Computable General Equilibrium (CGE), GTAP, GTAP-E, Carbon Tax
1. Introduction
In the last ten years, several emerging countries including Vietnam experienced dramatic economic growth rate. As a
result, energy demand in these economies has been increasing rapidly, which leads to the concern of climate change and the
shortage of energy resources. In this context, energy system analysis has become an urgent issue due to the growing
concerns related to climate change, land use, differentiation of energy sources and energy prices. The issue related to
environmental and energy policies have attracted a lot of studies both in term of technological and economy-wide impacts.
There are two approaches to deal with the problem: bottom-up model and top-down model. The bottom-up approach
includes technologies in detail, both on the supply side and on the demand side. The top-down model represents micro-
economic responsiveness to policies and on this basis, addresses the consequences of policies in terms of public finance,
economic competitiveness and employment effect. Due to that difference, in the middle of 90s, a hybrid approach of the two
above models has started to emerge.
Among top-down models, Computable General Equilibrium (CGE) models have assumed particular importance. One of
the Computable General Equilibrium (CGE) models known as The Global Trade Analysis Project (GTAP) is a global
project aiming at facilitating high quality quantitative analysis of the global economic issues. The main products of the
GTAP are the global database (the GTAP Data Base) and the global economic model (the standard GTAP model) to
conduct policy simulations with the GTAP Data Base. The standard GTAP model is a comparative static multi-regional
computable general equilibrium model of the world economy written in the GEMPACK software that was developed by the
Centre of Policy Studies, MONASH University. The GTAP-E model is an extension of a standard GTAP model constructed
by the Global Trade Analysis Project (GTAP) team. The model incorporated energy substitution both for inter-fuel and fuel-
factor substitution into the Standard GTAP model. The new features allow the estimation of sectoral energy consumptions
by fuel type - one important step to estimate carbon emission from fuel combustion. The model assumes that capital and
energy composite are substitutable to a certain extent and form capital –energy composite. Different types of energy are
nested at several levels based on their substitutability. Aside from energy substitution modules, several others modules are
also presented.
Since the present of original GTAP-E model developed by Burniaux and Truong (2002), there are number of studies
utilized the structure of this model and the revised version for policy analysis of climate change. Nijkamp et al (2005)
analyzed the modeling strategies that go beyond the original structure of GTAP-E model in order to incorporate the three
climate change instruments
1
. Peterson and Schleich (2007) in their paper analyzed the economic and environmental effects
of alternative border tax adjustment (BTA) mechanism using an extended version of the GTAP –E model. The results show
that the implementation of a BTA has little effect on the marginal abatement costs of achieving the emission reductions in
the Kyoto Protocol and does little in reducing carbon leakage. Truong et al. (2007) revised the original paper of GTAP-E
model. By incorporating carbon emissions from the combustion of fossil fuels, this revised version of GTAP-E provides a
1
International Emission Trading (IET), Join Implementation (JI) and Clean development Mechanism (CDM)
The 3
rd
IAEE Asian Conference
(International Association for Energy Economics)
mechanism to trade these emissions internationally as well as domestically. The policy relevance of GTAP-E in the context
of existing debate about climate change is illustrated by some simulations of the implementation the European emission
trading scheme in 2005. Kemfert et al. (2006) analyzed the effects of emissions trading in European, with special reference
to Germany. The analysis is undertaken with a modified version of the GTAP-E using the GTAP version 6 data base. The
results shows that Germany, Great Britain and the Czech Republic are the main seller of emissions permits, while Belgium,
Denmark, Finland and Sweden are the main buyers. The welfare gains from regional emissions trading are largest for
Belgium, Denmark and Great Britain; smallest for Germany. Taking into account the economy-wide and terms –of-trade
effects of emissions trading, however, terms-of-trade effects can offset the allocated efficiency gains for the cases of the
Netherland and Italy, while all other regions end up with positive net welfare gains. All regions experienced increases in
real GDP as a result of regional emissions trading. Tommasino and Martini (2010) introduced carbon tax for Italy using a
modified version of GTAP-E with data taken from the GTAP 7 Data Base. The model then would be linked with a bigger
model named: Integrating bottom-up and top-down energy models, the case of GTAP-E and Markal – Italy. Niemi and
Honkatukia (2011) reported analyses the effects of EU emissions trading schemes on the Nordic energy intensive industries.
Based on the modified version of the dynamic GTAP and a long-run baseline, the analysis covers CO
2
mitigation costs and
their impacts on industry competitiveness, the risk of carbon leakage, and the combined effects from energy efficiency
improvements. The paper also evaluates the effect of subsidies allowed in the EU emission trading directive to industries for
compensation of the loss of competitiveness.
The literature survey shows the lack of using dynamic GTAP-E for carbon taxation studies, especially studies applied
for Vietnam. In this paper, a new version of GTAP-E model based on the latest GTAP data (GTAP 7, with the base year of
2004) is introduced. The new version is also constructed with a regional mapping where Vietnam is disaggregated. Further,
as a second step, a dynamic GTAP-E model is developed based on the theoretical structure of dynamic GTAP and the
GTAP-E model for Vietnam for the period of 2004-2025.The model is used to simulate the adoption of alternative carbon
tax for Vietnam for the based year of 2004 and for the period of 2008-2025. The economy-level and detailed sector-specific
effects are also examined considering energy intensive and non-intensive sectors.
2. The Standard GTAP model and the GTAP-E model
2.1. The Standard GTAP model
The standard GTAP model describes accounting relations and behavioral equations of households and firms in each
region as well as in hypothetical global sectors which are introduced to complete the model. In fact, the theory of GTAP
model is similar to other Applied General Equilibrium models. The systems of GTAP comprise of two different types of
equations. The first system covers the accounting relationship which ensures that receipts and expenditures of every agent in
the economy are balanced. The second system consists of behavioral equations based upon microeconomic theory which
specify the behavior of optimizing agent (production and demand function).
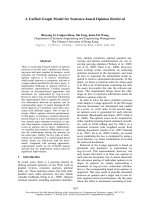
Figure 1 offers an overview of economic activity of the GTAP model. The regional household is assumed for each region. Its
behavior is described by an aggregate utility function. The regional household can earn factor income by providing factors (labor,
capital, land and natural resources) to the firms and receive net taxes. Then, it allocates the whole income to composite
government purchases, composite private consumption and savings. In the second level of allocation, government demands across
composite goods are specified as a Cobb-Douglas function, while private household demands are specified as a constant
difference of elasticities function. Company behavior is governed by the zero profit condition that results from profit maximization
under the competitive market assumption. Production technologies can be described as a production tree with several levels of
nesting. The model assumes two global sectors - the global transportation sector (not included in the figure) and the global
banking sector. The global transportation sector provides the international transport service that accounts for the difference
between the FOB (free-on-board) value and the CIF (cost, insurance and freight) value of traded commodities. Due to lack of
information about the price of international transport services of particular commodities and routes provided by a particular
region, the price of the global transport service is a blend of the
prices all transport services provided by all the regions. The
global banking sector
intermediates between global savings and investment. This sector receives net investment from all the
regions and offers composite investment at a common price to regional households corresponding to their savings demand.
In other word, this global banking sector represents neoclassical macroeconomic closure in which global investment is
allowed to adjust to maintain macroeconomic accounting identities at the global level.
The 3
rd
IAEE Asian Conference
(International Association for Energy Economics)
Figure 1. Multi Region Open Economy
Source: Brockmeier, 1996
SAVE
Net saving, by region
PRIVEXP
Private consumption expenditure in region r
TAXES
Different kind of taxes or subsidies
GOVEXP
Government consumption expenditure
VOA
Value of commodity i output in region r at agent price
NETINV
Regional net investment
VDPA
Domestic purchases, by household, at agent’s prices
VDGA
Domestic purchases, by government, at agent’s prices
MTAX
Tax on imports on good i from source r in destination s
XTAX
Tax on exports on good i from source r in destination s
VIPA
Import purchases, by households, at agent’s prices
VIGA
Import purchases, by government, at agent’s prices
VDFA
Domestic purchases, by firms, at agent’s prices
VIFA
Import purchases, by firm, at agent’s prices
VXMD
Non-margin exports, at market prices
2.2. The GTAP-E model
The GTAP-E model is an energy-environmental version of the standard GTAP model based on the GTAP version 5
data base. The main change in GTAP-E compared with the traditional GTAP model is given by including the possibility of
substitution of energy inputs in production and consumption. Energy substitution is incorporated in the structure of the
GTAP-E model both in the production and consumption structure. The revised version of the energy environmental
Rest of the World
Regional Household
Private Household
Government
Global Bank
Producer
PRIVEXP
SAVE
GOVERXP
VOA
VDPA
VDGA
REGINV
VDFA
VIFA
VXMD
VIPA
VIGA
MTAX
XTAX
TAXES
TAXES
TAXES
The 3
rd
IAEE Asian Conference
(International Association for Energy Economics)
extension of GTAP-E (Burniaux and Truong, 2002) is documented in Research Memorandum No.15 (Mc Dougall and
Golub, 2007). The revised model is not only improved but also is adapted to a wider range of energy-environmental policy
scenarios. Specifically, emission data, emission trading, carbon taxation, revenue from emission trading, production
structure and welfare decomposition are renewed. Those are related to the revisions of the solution program, data, stored
input and command files.
3. Using GTAP-E model for the case of Vietnam, the static model
3. 1. Methodology
The GTAP-E model for Vietnam utilizes the structure of the original paper of GTAP-E which is developed by
Burniaux and Truong (2002) and then revised by Mc Dougall and A. Golub (2007). In fact, the revised version of GTAP-E
is the modified version the original GTAP-E and it has several advantages. First, the emissions trading and emission
constrains has been modeled based on the newly created trading blocs. Then the CO
2
emissions are calculated following a
bottom up approach which is derived from energy consumption. This methodology is different from the way CO
2
emissions
are aggregated in the original GTAP-E (2002) which is not closely related to energy consumption. In the revised GTAP-E
model, carbon taxation is modeled by introducing trading bloc, nominal carbon tax and real carbon tax as well as the
relationship between them. The production structure in the 2007 version of GTAP-E is re-organized, grouping equations by
nest. Further, a more effective way to calculate the contribution of permit trading revenue to welfare change is presented in
the new version. Based on the arguments above, the revised version of GTAP-E is chosen for the analysis of Vietnamese
case.
The determination of the number of sectors and regions to be aggregated is another step in the process of building a
GTAP-E version. According to the GTAP-E approach, energy sectors should be presented, including coal, crude oil, gas
(natural gas and gas distribution and manufacture), petroleum and refined oil products, and electricity. Energy intensive
sectors, non-intensive sectors or sectors which might emit relatively more CO
2
as described on the IEA Energy Balances are
also categorized. Specifically, 57 old sectors are mapped over to 17 new sectors. As for regional aggregation, Vietnam is
disaggregated from the Data Base. Other regions are similar to the mapped regions in the original GTAP-E model. In fact,
113 old regions are mapped to 9 new regions.
3.2. Data
The data of the model are mainly taken from the GTAP 7 Data Base which is in the file named as BASEDATA.HAR
and GSDVOL.HAR. Since the data structure of GTAP-E are not similar to that of the Standard GTAP, GEMPACK
program is also utilized to create the aggregated data in addition to Flexagg7 or GTAPAgg7 program (used to make the
aggregated data for Vietnam case). As a matter of fact, users can use programs such as TABLO, MOHAR or VIEWHAR to
create the data. In this process, WIEWHAR is used to construct the data base for the GTAP-E Vietnam because of its
advantages. The most important issue for the GTAP-E model is the inclusion of the energy and CO
2
emission data, which
define the differences between standard GTAP and GTAP-E model. The energy data in the revised GTAP-E model bases on
the GTAP 6 Data base. It is necessary to update this IEA energy data expressed in MTOE (the base year was 1997) to the
more recent GTAP version 7 Data base (whose base year is 2004). The revised GTAP-E model contains the volume of
domestic energy production in MTOE for each region under data header named DVOL. In order to obtain the volume of
domestic energy production in MTOE using the GTAP Version 7 Data base (file name gsdvole.har), the difference between
the volume of energy demand in MTOE (volume purchases by firms and by household) plus the volume of energy
commodities export in MTOE minus the volume of import in MTOE for each region are calculated.
In terms of CO
2
emissions, the emissions data is prepared following Ludena (2007) approach, using two main data
sources: CO
2
emissions data from Lee (2008) and the GTAP Version 7 Data Base. Specifically, first, the emission data
related to consumption of imported energy commodities by firms and household not included in Lee (2008) Data Base is
calculated by applying the proportions of the imports and domestic volumes for each commodity. In fact, Lee's CO
2
emissions data are calculated from the energy volume data of the GTAP Version 7 Data Base, categorizing by fuels, region
and users (sectors) but with no distinction of emissions from energy consumptions of domestic good or imported good. In
this process, natural gas (gas) and gas manufacture and distribution (gdt) are combined in order to avoid the minus numbers
which are not possible in reality. Then, the WIEWHAR program in GEMPACK version 10 is utilized to build the data
which is suitable for the new version of GTAP-E. Finally, the data has been converted from Giga gram of CO
2
to millions
ton of carbon, as required by the GTAP-E revised version following the methodology as described in Lee (2008). The
regional and sectoral emissions can also be obtained to fit the requirements of the GTAP-E model.
3.3. Results
The 3
rd
IAEE Asian Conference
(International Association for Energy Economics)
The introduction of carbon taxation is simulated under different scenarios: at first the carbon taxation is 10 US dollars
per ton of carbon and then, the carbon taxation amounts to 20 US dollars per ton of carbon.
Table 1. Percentage Changes in the real energy price index for Vietnam
Energy commodities
Carbon tax 10 US
Carbon tax 20 US
Coal
13.89
27.77
Oil
3.16
5.62
Gas
5.43
10.86
Oil Products
1.88
3.78
Electricity
1.03
2.02
The results above show that for all scenarios, impacts are greater for coal followed by Gas, Crude Oil and Oil
products. Carbon taxation is not levied on electricity because electricity usage does not emit CO
2
while the impacts are
driven for the augmentation of fuel utilized in the electricity production from Coal, Oil-products and Natural Gas. Crude oil
causes small amounts of CO
2
emission mainly because of the refinery industry. The fact that there is no refinery plant in
Vietnam means the utilization of crude oil is for other industries which also emit insignificant amounts of CO
2
.
Table 2. Percentage changes in carbon dioxide emission for Vietnam
Energy commodities
Carbon tax 10 US
Carbon tax 20 US
Coal
-6.68
-12.24
Oil
-3.76
-6.42
Gas
-3.44
-6.60
Oil Products
-1.76
-3.45
The implementation of carbon tax impacts positively –as expected – on the reduction of CO
2
emissions. As the carbon
tax increases, the impacts are greater for all energy commodities. Impacts of carbon tax are greatest for coal, followed by oil,
gas and oil products for the case of carbon taxation 10 US dollars. When carbon tax sets to 20 US dollars, coal still reduces
the most, but followed by gas, oil and oil products. Moreover, the impact is relatively bigger with carbon taxation levied to
5 US dollars per ton of carbon
2
Table 3. Carbon dioxide emission of Vietnam in Million tons of Carbon
Energy commodities
No carbon tax
Carbon tax 10 US
Carbon tax 20 US
Coal
8.78945
8.202264
7.713202
Oil
0.00037
0.000362
0.000352
Gas
4.07900
3.938731
3.809617
Oil Products
10.77906
10.589793
10.407503
Total
23.64789
22.731150
21.930674
Reduction (%)
-
-3.88 %
-7.26 %
In terms of CO
2
emission reduction in million tons of carbon, CO
2
emission reduction is greatest for coal both in
percentage changes and in quantity for all three scenarios. However, the share of CO
2
emissions reduction from coal over
total emissions reduction decreases from 64.05 percent with carbon tax 10 US dollars to 62.7 percent with carbon tax 20 US
dollars
2
All results not included within this table format are available upon request
The 3
rd
IAEE Asian Conference
(International Association for Energy Economics)
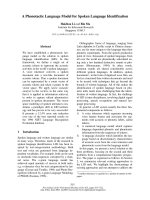
Figure 2. Sectoral emission reduction under carbon tax 20US dollars (M tons of carbon)
As for the sectoral contribution to the overall reduction for the 20US dollars carbon tax levied, the sector in which CO
2
emissions diminishes the most is electricity (-0.47 M tons of Carbon). It is followed by energy intensive sectors such as
Mineral Products, Chemical Rubber Plastic product and some of non energy sectors like Services and Other industries and
services sectors.
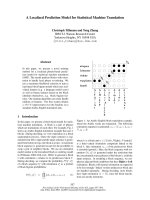
Figure 3. Carbon tax revenue (USD millions)
Figure 3 indicates that the main contribution to carbon tax revenue comes from oil products, followed by coal and gas. In
Vietnam’s energy production and consumption, coal and oil products account for most of primary energy production and
total energy consumption. Therefore, these energy commodities contributes the biggest share to the carbon tax revenue
Table 4. Percentage change of firm market price expenditure for Vietnam
Energy commodities
Carbon tax 10 US
Carbon tax 20 US
Coal
-7.16
-13.11
Oil
-3.08
-5.32
Gas
-3.18
-6.12
Oil Products
-1.87
-3.66
Both two scenarios imply significant decreases in coal expenditure, followed by gas expenditure, and the decline of oil
products and oil is also important. The decrease in coal expenditure is particularly high in energy intensive sectors such as
Metal Products, Paper Products. Non energy intensive sectors with significant decreases in coal expenditure are Services
sector, and electricity sector. In particular, with 20US dollars carbon tax, metal products reduces emission the most with
16.06 percent, followed by Mineral products, Chemical Rubber and Plastic, Paper products, Sea Transport, Air Transport all
around with 14 percent.
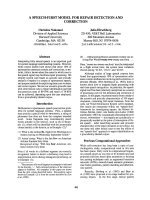
Figure 4 shows that output production diminishes the most are gas and oil and transportation sectors (Transport, Sea
transport and Air transport) when carbon tax is levied in energy commodities sectors. Gas sector in Vietnam suffers the
biggest impact, reducing by 6.58 percent of output. Transportation sectors and then Oil Products and Coal sector are also
impacted significantly by the adoption of carbon tax.
The 3
rd
IAEE Asian Conference
(International Association for Energy Economics)
Figure 4. Percentage change in industry output
Table 5 and table 6 show that the impacts on GDP of carbon taxation are significant with carbon tax 20 US dollars per
ton. The largest carbon taxation makes GDP decreased by 0.14 percent. Because the GDP of Vietnam is small in
comparison with other regions in the model, such percentage changes represent 61.15 and 12.5 million dollars reductions,
respectively.
Table 5. Changes of Vietnam's GDP
Scenarios
Percentage change
Changes in volume ( 2004 USD millions)
Carbon tax 10 US
-0.06
-27.07
Carbon tax 20 US
-0.14
-61.15
GDP decomposition indicates that the greatest reduction is observed for export and import as shown in table 6. Since
Vietnam’s economy still bases on export of domestic production and natural resources, carbon taxation may have bad
impacts on the whole economy. Aside from export and import, consumption, investment and government expenditure also
undergo significant decreases. The results show that carbon taxation induces negative influences on Vietnam’s economy
Table 6. Percentage changes in GDP decomposition
GDP Decomposition
Carbon tax 10 US
Carbon tax 20 US
Consumption
-0.07
-0.16
Investment
-0.06
-0.12
Government
-0.07
-0.15
Exports
-0.31
-0.61
Imports
-0.29
-0.57
4. Dynamic GTAP-E model
4.1. Methodology
There are two steps to develop a dynamic GTAP-E model for Vietnam. First the data represented the world economy
for the year 2008, 2015, 2020 and 2025 are produced based on the standard dynamic GTAP (Gdyn) model. Main
macroeconomic indexes are shocked to represent changes of the world’s economic in the future included Gross Domestic
Product (GDP) growth rate, population, skilled and unskilled labor growth rate. Second, those world’s economic data
mentioned above are used with the static GTAP-E model for each year in combination with new energy and CO
2
emission
data set to simulate for the adoption of carbon tax for Vietnam. In short, the dynamic model of Vietnam is in fact the
incorporation of dynamics towards 2025 by solving a series of static equilibria driving by the evolvement of some key
exogenous variables.
The dynamic GTAP model which is developed by Ianchovichina and McDougall (2001) is used to project the world’s
economy in the future. GTAP-Dyn is a recursive-dynamic extension of the standard GTAP, which is a multi region applied
general equilibrium model. The dynamic GTAP (GDyn) includes all the special features of the standard GTAP model such
as the sophisticated consumer demands and inter-sectoral factor mobility, incorporating a new treatment of investment
behavior and additional accounting relations to keep track of foreign ownership of capital.
The 3
rd
IAEE Asian Conference
(International Association for Energy Economics)
4.2. Data
4.2.1. The construction of baseline data
Macroeconomic data projection collected are GDP, population, skill and unskilled labor for 2005-2020 period. The
world’s data is mainly taken from Foure et al. (2010) and Samir et al. (2010) for a total of 128 countries. Data of Vietnam
are based on (GSO, 2010) and (GSO, 2011) which present Statistics data on national accounts of the year 2010 and 2011,
published by General Statistics Office of Vietnam (GSO) in combination with data from the Master Plan on Vietnam’s
energy (MOIT and JICA, 2008). The data are then, combined with the data in “Projections for World CGE Model
Baselines” which are collected by Chappuis and Walmsle (2011). Nine regions which are similar to regional aggregation in
the previous chapter are disaggregated from the baseline data. The data is then adjusted to be compatible with IEA
macroeconomic projection featured in World Energy Outlook 2010 and the master plan on Vietnam’s energy sector (MOIT
and JICA 2008). The GTAP Satellite data and its aggregation program are also utilized for the standard dynamic GTAP
3
.
Sectoral and Regional aggregation are similar to those of the static model. GTAP Satellite data is constructed by GTAP staff
to specially use with the dynamic GTAP model.
4.2.2. Energy and CO
2
emission data
Domestic energy production data for year 2008 are collected from Energy Balance of OECD countries and Energy
Balance of Non-OECD countries published by International Energy Agency (2011) for a total of 134 countries (IEA 2011a
and IEA 2011b). The data is then aggregated into 9 regions. Sectoral CO
2
emissions data for year 2008 are taken from “CO
2
emissions from fuel combustion” (IEA 2011c) for 146 countries. The data are also aggregated into regional and sectoral to
fit the requirements of the GTAP-E model. CO
2
emission is distinguished between imported and domestic sources following
the approach of Martini and Tommassino (2010) which is similar to the approach applied for the calculation of the year
2004. In order to do that, energy import and export are also collected both from Energy Balances of OECD and Non-OECD
countries 2011 for 138 countries, then the data are aggregated into 9 regions of the model.
Energy and CO
2
data projection for Vietnam from 2015-2025 are taken from Master Plan on Vietnam Energy Sector
which was conducted by Ministry of Industry and Trade of Vietnam (MOIT) and Japan International Cooperation Agency
(JICA) in 2008. Data of other regions are taken from World Energy Outlook 2010 for the United States, European countries,
China and India, Japan. Additional information from International Energy Outlook 2011 (EIA, 2011) and Oil Products
Balances (FGE, 2010) has been used for the estimation of energy and CO
2
emission data of the remaining regions.
4.3 Results
The analysis of percentage variations in energy price index values under the 20 US dollars of carbon taxation scenario
shows that for the periods of 2008 - 2025, impacts are greater for coal followed by gas and crude oil (table 7). Impacts on
real energy price index are smaller oil products and electricity. From the year 2008 to the year 2025, impacts are getting
smaller on all energy commodities, especially, decreasing from 32.47 percent to 15.32 percent for coal. Important decreases
can also be observed for gas and oil products.
Table 7. Percentage changes in the real energy price index for Vietnam
Energy commodities
2008
2015
2020
2025
Coal
32.47
25.03
19.25
15.32
Oil
4.89
3.05
2.15
1.60
Gas
5.77
3.30
2.73
1.86
Oil Products
2.81
1.85
1.56
1.24
Electricity
1.36
0.90
0.85
0.65
Table 8 displays the implementation of carbon tax impacts positively –as expected – on the reduction of CO
2
emissions. However, the impact on crude oil for the year 2008 is largest but greater decrease can be observed for coal, gas
and oil products since CO
2
emission from crude oil is insignificant. For the year 2015, 2020 and 2025, CO
2
emission from
gas reduce the most, followed by the emission reduction from coal and oil products. This is because household and imported
gas seems to be very sensitive to the changes of gas price index. Except for the case of natural gas, it can be observed that
impacts of carbon tax on energy commodities price index are smaller over time while CO
2
emission reduction are larger
from 2008 to 2025.
3
GTAP Satellite data is constructed by GTAP staff to specially use with the dynamic GTAP model. The main data of GTAP version 7
Satellite data base is similar to the GTAP version 7 data base but it incorporates some more data which are then utilized for the
standard dynamic GTAP
The 3
rd
IAEE Asian Conference
(International Association for Energy Economics)
Table 8. Percentage of carbon dioxide emission reduction
Energy commodities
2008
2015
2020
2025
Coal
-19.48
-17.04
-18.81
-27.18
Oil
-25.28
-3.80
-3.73
-4.06
Gas
-20.39
-20.76
-18.86
-33.98
Oil Products
-2.74
-15.44
-7.53
-3.75
Total
-13.04
-16.93
-14.27
-19.43
Table 9 presents carbon dioxide reduction in million tons of carbon. Emission from coal diminishes the most it is
because the carbon content of coal is the largest among energy commodities. Total carbon reduction from 3.6 million tons in
2008 amounts to approximately 18 million tons in 2025 of which coal accounts for 61.9 and 65.86 percent, respectively.
Even carbon dioxide emission of crude oil reduce greatly in terms of percentage, the amount of carbon reduction is
insignificant for 2008 – 2025 periods. The two tables show that impacts of carbon tax are greater for the year 2008 and the
year 2015, becoming smaller for the year 2020 and 2025.
Table 9. CO
2
emission reduction in million tons of carbon
Energy commodities
2008
2015
2020
2025
Coal
2.52
3.53
5.38
11.83
Oil
4
0.00
0.00
0.00
0.00
Gas
0.81
1.35
1.78
4.83
Oil Products
0.30
2.82
1.93
1.30
Total
3.63
7.70
9.09
17.96
Figure 5 presents sectoral emission reduction under carbon tax 20US dollars for 2008-2025 periods. The patterns are almost
the same as the year 2004. For the year 2008, the sector in which CO
2
emissions diminish the most is electricity (-0.66
million tons of Carbon). CO
2
emission reduction is reduced the most in Mineral Products, Chemical, Rubber and Plastic
sectors. Except for Forestry, Coal, Oil and Gas sectors (the emission reduction is small), CO
2
emission reduction is
significant for energy intensive sectors such as Paper Products, Mineral Products and non energy intensive sectors such as
Other industries and services sector and Services sector. The year 2015 and 2020 concern on Mineral Products sector as it
reduce the most CO
2
emissions (-1.5 million tons of carbon, followed by electricity sector and Other Industries and Services
sector (1.4 and 1.2 million tons of carbon, respectively). For the year 2025, electricity sector again, diminishes the most (-
5.7 million), almost doubled that of Mineral Products sector (-3.1 million tons of carbon). Important contribution to the
overall emission reduction are marked for Other industries and services sector, Chemical Rubber and Plastic sector, and
Services sector. It is worth noticing that sectoral emissions in 2025 is almost double that of the year 2020.
Figure 5. Sectoral emission reduction under carbon tax 20 US dollar for 2008 -2025 periods
Figure 6 indicates that the main contribution to carbon tax revenue comes from oil products, following by coal and
gas. The figure also shows that the contribution to carbon tax revenue from coal increase rapidly. This is compatible with
4
CO
2
emission reduction in million ton of carbon for crude oil is insignificant. The numbers are 0.000112, 0.00000237, 0.00000307,
0.00000327, 0.00000516 million tons of carbon for the year of 2008, 215, 2020 and 2025, respectively
-6 -5 -4 -3 -2 -1 0
1 Agriculture
4 Oil
7 Electricity
10 Met_Pcts
13 Sea_Transp
16 Dwellings
2025
2020
2015
2008
The 3
rd
IAEE Asian Conference
(International Association for Energy Economics)
0
100
200
300
400
500
600
700
coal
oil
gas
oil_pcts
2008
2015
2020
2025
-25 -20 -15 -10 -5 0 5
Agriculture
Coal
Gas
Electricity
Che_Rub_Pla
Pap_Pcts
Sea_Transp
Services
Oth_Ind_Ser
2025
2020
2015
2008
the fact that coal demand will take a bigger share in Vietnam primary energy demand in the future. Carbon tax revenue from
crude oil remains insignificant while revenue from gas is much smaller than that from coal and oil products.
Figure 6. Carbon tax revenue for 2008 – 2025 periods (million US dollars)
Table 10 presents percentage change of firm market expenditure on energy commodities for Vietnam. All the four
year imply significant decreases in coal expenditure, following by oil expenditure, the decline of oil products and gas is also
important. Towards the year 2025, the decreases of firm expenditures on energy commodities are smaller.
Table 10. Percentage change of firm market price expenditure for Vietnam
Year
Coal
Oil
Gas
Oil Products
2008
-13.22
-5.07
-3.24
-3.01
2015
-10.41
-5.34
-4.74
-1.89
2020
-8.42
-3.95
-3.79
-1.58
2005
-6.96
-2.99
-2.78
-1.30
As shown in Figure 7, for the case with carbon tax of US dollars 20 per ton of carbon, industrial output decreases are
getting bigger over time. However, the greater decrease can be seen for the year 2015 of which oil products and coal sectors
diminish the most with - 22.42 and -15.71 percent, respectively. Impacts of US 20 dollars of carbon taxation scenario seem
to be smaller for the year 2020 and 2025 for the two sectors. In general, output production diminishes the most after carbon
tax in energy commodities sectors such as oil products, coal, and gas. Important decreases can also be observed for
transportation sector such as transport, sea transport and air transport, especially for the year 2008.
Figure 7. Percentage changes in industry output for 2008-2025 periods
Table 11 and table 12 show that the impacts on GDP of carbon taxation are getting smaller from 2008 – 2025 with carbon
tax of 20 US dollars per ton. Toward the year 2025, impacts of carbon tax decreases from 0.14 percent in 2008 to 0.09
percent in 2025. Such small changes represents 68.27, 126.80, 174.81, 247.34 million US dollars reduction, respectively
The 3
rd
IAEE Asian Conference
(International Association for Energy Economics)
Table11. The changes of Vietnam’s GDP
Year
Percentage changes
Changes in 2004 US dollars millions
2008
-0.14
-82.70
2015
-0.11
-126.80
2020
-0.10
-174.81
2025
-0.09
-247.34
Percentage changes of GDP composition varies over time. Greatest changes can be observed for export and import in
2008, then they are for consumption, government expenditure and imports for the year 2025. The results indicate that the
adoption of carbon tax US dollars 20 US cause greater CO
2
emission reduction in the future, increasing in both percentage
and quantity (-13 percent of the year 2008 to 19.43 percent reduction in 2025). However, its impacts on the whole economy
is getting smaller, decreasing from -0.14 percent to - 0.09 percent reduction of GDP.
Table12. Percentage changes of GDP Decomposition
Scenarios
Consumption
Investment
Government
Exports
Imports
2008
-0.16
-0.11
-0.16
-0.45
-0.41
2015
-0.14
-0.05
-0.15
0.27
0.19
2020
-0.12
-0.06
-0.13
0.08
0.05
2025
-0.11
-0.08
-0.11
-0.07
-0.08
5. Conclusion
The results of dynamic GTAP-E model under 20 US dollars of carbon taxation scenario indicate some results: First,
percentage changes in real energy price index have the same pattern as those of the year 2004 such as coal price increase the
most, followed by gas, oil, oil products and electricity. Meanwhile, the increase in price of energy commodities is smaller
from the year 2004 to the year 2025. It shows that impacts of carbon tax are getting smaller in the future. Despite of this,
CO
2
emission reduction tends to increase over time. Actually, percentage change of CO
2
emission reduction is smaller for
the year 2020, but reaches the highest for the year 2025 (-19.43 percent). Second, carbon tax of 20 US dollars impacts
greatly on industry output for the year 2015
5
, the most contraction can be observed for oil products sector and coal sector.
However, its impact on GDP and GDP decomposition is smaller than that of 2004 - 2008 periods. The explanation is the
rapid expansion of Vietnam’s economy which mitigates the negative impact of carbon tax. Third, the results of dynamic
model for the period 2008-2025 shows that impacts of carbon tax on the GDP is smaller than that of the year 2004,
diminishing GDP to -0.09 percent in 2025 comparing to -0.14 percent of the base year. It seems the impact of carbon tax on
GDP reaches the highest point for the period of 2004-2008, and then it is decreasing towards the year 2025. In short, the
adoption of carbon tax of 20 US dollars per ton of carbon has strong impact on carbon dioxide emission reduction, reducing
carbon from 7.26 percent in 2004 to 19.43 percent in 2025 with a little negative impact on economic growth. It is worth
noticing that energy intensive sectors still account for larger reduce of carbon dioxide while oil products sector and coal
sector is the most vulnerable one among 17 sectors of the model in term of total output simply because using coal would
emit a lot of carbon dioxide compared with other energy commodities.
The results of this study show that in the future (toward the year 2025) impact of carbon tax policy on GDP and on
Investment, Consumption, Import and Export are relatively small, but the reduction of carbon taxation is relatively large.
The results suggest the carbon tax is an effective policy tool in mitigating CO
2
emission and ensure sustainable development
for Vietnam
Acknowledgement
This work was supported by the New and Renewable Energy Program of the Korea Institute of Energy Technology
Evaluation and Planning (KETEP) grant funded by the Korea government Ministry of Knowledge Economy (No.
20093021020020)
5
All results not included in this paper will be available upon request
The 3
rd
IAEE Asian Conference
(International Association for Energy Economics)
References
Brockmeier, M., 1996. A Graphical Exposition of the GTAP model. GTAP technical paper No 8 1996, Center for Global
Trade Analysis, Purdue University
Burniaux, M., Truong, T., 2002. GTAP-E: An Energy –Environmental Version of the GTAP model. GTAP technical paper
19, Center for Global Trade Analysis, Purdue University
Chappuis, T ., Walmsley, T., 2011. Projection for World CGE Model Baselines. GTAP Research memorandum No.22,
Center for Global Trade Analysis, Purdue University
EIA, 2011. International Energy Outlook 2011. Energy Information Administration (EIA)
FGE, 2010. Asia Pacific Data book 3: Oil Products Balances. Facts Global Energy (FGE)
Foure J et al. 2010. The World Economy in 2050: a Tentative Picture. CEPII Working Paper 2010
GSO, 2011. Statistics data on national accounts of the year 2010. General Statistics Office of Vietnam (GSO)
GSO, 2010. Statistics data on national accounts of the year 2009. General Statistics Office of Vietnam (GSO)
Hertel, T., Tsigas, M., 1999. Structure of GTAP: Global Trade Analysis Project. Center of Global Trade Analysis Project,
Purdue University
Ianchovichina, T., Mc Dougall, R., 2001. Theoretical Structure of Dynamic GTAP. GTAP Technical Paper No. 17. Center
of Global Trade Analysis Project, Purdue University
IEA, 2009. World Energy Outlook 2009. International Energy Agency (IEA)
IEA, 2010. World Energy Outlook 2010. International Energy Agency (IEA)
IEA, 2011a. Energy Balances of OECD countries 2011. IEA Statistics, International Energy Agency (IEA)
IEA, 2011b. Energy Balances of Non-OECD countries 2011. IEA Statistics, International Energy Agency (IEA),
IEA, 2011c. CO
2
emissions from fuel combustion 2011 - Highlights. International Energy Agency (IEA),
Itakura, K., Ianchovichina, E., Lakatos, C., Walmsley, T. 2005. Implementing the dynamic GTAP model in the
RUNDYNAM Software. Center of Global Trade Analysis Project, Purdue University
Kemfert, C., Kohlhaas, M., Truong, T., Protsenko, A. 2006. The environmental and economic effects of European
emissions trading. Climate Policy 6, 441-455
Lee, H.L., 2002. An emissions data base for integrated assessment of climate change policy using GTAP. Center for Global
Trade Analysis Project, Purdue University
Lee, H.L., 2008. The Combustion-based CO
2
Emissions Data for GTAP version 7 Data base. Center for Global Trade
Analysis Project, Purdue University
Ludena C., 2007. CO
2
Emissions in GTAP-E: Ready – for – Aggregation GTAP 6.0 data. Center for Global Trade Analysis,
Purdue University
Mc Gougall, R., Golub, A., 2007. GTAP-E: A Revised Energy –Environmental Version of the GTAP model. GTAP
research memorandum No.15, Center for Global Trade Analysis, Purdue University
Martini, C., Tomassino, M.C. 2010. General Equilibrium Modeling for Energy Policies Evaluation. ENEA 2010
MOIT and JICA, 2008. A Study on National Energy Master Plan. Industrial Strategy and Policy Institute (ISPI), Ministry of
Industry and Trade of Vietnam (MOIT) and Japan International Cooperation Agency (JICA)
Narayanan, B. G., Walmsley, T., 2008. Global Trade, Assistance, and Production: The GTAP 7 Data Base. Center for
Global Trade Analysis, Purdue University
Niemi, J., Honkatukia, J., 2011. Implications of EU emission trading in the Nordic countries. Government Institute for
Economic Research, VATT Policy Reports
Nijkam, P., Wang, S., Kremers H., 2005. Modeling the impacts of international climate change policies in a CGE context:
The use of the GTAP-E model. Economic Modeling Vol. 22, 955-974
Peterson, E.B., Scheich, J., 2007. Economic and Environmental Effects of Border Tax Adjustments. Working Paper
Sustainability and Innovation
Truong, T., Kemfert, C., Burniaux, J., 2007. GTAP-E An Energy –Envrionmental Version of the GTAP model with
Emission Trading. Dicussion Paper, Berlin
Truong, T. P., 2007. GTAP-E: An Energy –Environmental Version of the GTAP Model with Emission Trading. User
Guider 2007, Center for Global Trade Analysis, Purdue University
Samir K.C., et al. 2010. Projections of populations by level of educational attainment, age, and sex for 120 countries for
2005-2050. Demographic Research 22(15), 383-472
Walmsley, T.L., 2006. A Baseline Scenario for the Dynamic GTAP Model. GTAP application, Center for Global Trade
Analysis, Department of Agricultural Economics, Purdue University
Walmsley, T., Itakura, K., 2007. Hands-on Computing with RunGDyn: An Introduction to GDyn. Center for Global Trade
Analysis, Department of Agricultural Economics, Purdue University
Walmsley, T., Dimaranan, B., McDougall, R., 2000. A Base Case Scenario for the Dynamic GTAP model. Center for
Global Trade Analysis, Department of Agricultural Economics, Purdue University