The effects of pH on the precipitation of rice straw lignin from An Giang, Vietnam
Bạn đang xem bản rút gọn của tài liệu. Xem và tải ngay bản đầy đủ của tài liệu tại đây (991.23 KB, 5 trang )
Physical sciences | Chemistry
Doi: 10.31276/VJSTE.64(3).03-07
The effects of pH on the precipitation
of rice straw lignin from An Giang, Vietnam
Thuy-An Ngo*, Dao-Chi Vo Thi, Nhan-Tanh Nguyen Tran, Thien-Khanh Nguyen Tran,
Minh-Nguyet Doan Thi, Mai-Linh Duong, Lan-Tuyen Nguyen
An Giang University, Vietnam National University, Ho Chi Minh city
Received 7 July 2021; accepted 5 October 2021
Abstract:
This research aimed to extract lignin from rice straw and reveal the pH value of diluted acid at which the
most effective yield of lignin was precipitated. In this study, rice straw obtained from local fields in the An
Giang province of Vietnam and sodium hydroxide 2 M was employed to extract lignin from rice straw.
Hydrochloric acid was used to adjust the sample pH values to be in the range of 1.5-3.5. Fourier-transform
infrared spectroscopy (FTIR) analysis was used to characterize the functional groups of the lignin materials.
Thermogravimetric analysis (TGA) analysis was employed to supply information on the thermal decomposition
of the lignin samples. Herein, the results showed that lignin precipitated at different pH values affected its
thermal properties. At 700oC, the yield of the remaining lignin components were 56% at pH 2.0, but the weight
loss of lignin samples precipitated at pH 3.5 dropped to 85% because many non-lignin substances existed in the
samples. The yield of the crude lignin samples obtained were 16.51, 17.66, 15.27, 14.33 and 13.26% for pH of 1.5,
2.0, 2.5, 3.0 and 3.5 respectively. The crystallite regions played an important role in the lignin structures. The
spectrum peaks at pH 1.5, 2.0 and 2.5 were broader than the peaks at pH 3.0 and 3.5. The results demonstrated
the highest percentage of lignin precipitate was collected at pH 2.0.
Keywords: agglomerate, crystallinity region, decomposition, lignin, precipitate, redissolve, rice straw, thermal.
Classification number: 2.2
Introduction
Lignin is an aromatic organic polymer composed of
three precursor aromatic alcohols, namely, ρ-coumaryl,
syringyl, and guaiacyl [1, 2]. With an amorphous structure,
lignin performs the function of plant cell binding and cell
wall void filling along with cellulose, hemicellulose, and
pectin [3]. Lignin does not exist as an independent polymer
in plant cells but is always bound to carbohydrates (i.e.,
hemicellulose) to form lignin-carbohydrate complexes [2].
Due to stable binding with many functional groups, lignin
is widely found in resins, emulsifiers, dyes, paints, asphalt,
nutrients, and synthetic fuels [4, 5].
As a natural complex organic polymer with wide
applications in many fields, lignin can be extracted by
various methods depending on source material types (mainly
herbaceous) and lignin-chemical structure [2]. The first
lignin-carbohydrate complex was successfully extracted with
hot water in 1953 [2, 6]. After that, organic solvents, alkaline
solutions, acids, enzymes, microbiological methods, and
ultrasonic treatments were tested toward the improvement
of lignin purity and recovery [2-5]. Among those methods,
alkaline hydrolysis is proven to be a promising approach
that is non-toxic to the environment and has a high lignin
recovery rate [1, 4]. In this approach, α-ether bonds between
lignin-hemicellulose and ester bonds (between ligninhemicelluloses and hydroxycinnamic acids) are broken such
that the lignin can be separated from the alkaline soluble
complex mixture [1, 2]. More importantly, acids are also
believed to have an essential influence on lignin precipitation
from soluble mixtures with non-lignin components [2, 7].
However, when the concentration of H+ is too high, the
decomposition coefficient of lignin will increase, whereas,
a low concentration of H+ will affect the structure of the
obtained lignin because the non-lignin components are not
completely separated [7]. The differences in these structures
of lignin can be examined by the following methods: FTIR
spectroscopy, TGA, and X-ray diffraction analysis (XRD)
[1, 4]. Therefore, to recover lignin from herbaceous plants,
alkaline hydrolysis is considered efficient but depends upon
acid concentration and lignin structure [1, 4, 7].
Corresponding author: Email:
*
september 2022 • Volume 64 Number 3
3
Physical Sciences | Chemistry
Raw materials for lignin extraction are diverse and
include all woody plants of which the most important are
herbaceous plants because of their abundance. Rice straw,
an agricultural waste, is also considered an abundant lignin
source due to it consisting of the three main carbon-rich
components, namely, cellulose (32-47%), hemicellulose
(19-27%) and lignin (5-24%) [8]. Approximately 370520 million tons/year of this biomass source is generated
globally of which Vietnam generates approximately 50
million annually [9, 10]. Furthermore, much of this biomass
source is currently wasted due to policies allowing open
burning, which causes air pollution [9].
In this study, various pH values were tested (using alkaline
extraction) to determine which pH values would obtain a
high yield of precipitated lignin. Then, the characteristics
of the crude lignin were investigated using XRD, FTIR and
TGA.
Materials and methods
Materials
Rice straw was obtained from local rice fields in An
Giang Province, Vietnam. The rice straw was washed in
deionized water to remove impurities [11] and troublesome
elements like insect larvae, dust, soil, etc. After that, the
rice straw was sun-dried to reduce its moisture content to
4-5.5% and was then chopped into lengths of 1-2 cm. The
dry sample was ground to a fine powder using a commercial
blender (DFY-2000, Vietnam), and then sieved to the size
of 0.08 mm to achieve the so-called dried rice straw (DRS).
The DRS was stored in sealed polyethylene bags at ambient
temperature for future use. Then, 150 g of cleaned rice straw/
DRS was mixed with 3600 ml of acetone 5% to remove oils,
pigments, and wax [12, 13] to obtain dewaxed DRS.
The chemicals used for lignin extraction consisted of
perchloric acid, hydrochloric acid, toluene, ethanol, and
sodium hydroxide, which were obtained from Merck,
Germany.
Methods
In this study, a chemical method was used to extract
lignin from rice straw. Fifty grams of the dewaxed DRS
was added to 1000 ml of NaOH 2 M [5, 14]. This mixture
was sonicated in a S100-Elmasonic (Germany, 37 kHz)
ultrasonic bath for 30 min at 90oC. Then, it was refluxed
at 90oC for 90 min. After that, it was cooled to 40oC and
filtered to remove residual biomass [15]. Hydrochloric acid
6 M was added into the filtrate until the pH reached 4.0, then
it was stored at 4oC for 24h. Next, three volumes of ethanol
95% were added to the liquid and kept at 4oC for 6 h for
hemicellulose coagulation. Hemicellulose precipitates and
the filtrate were obtained by vacuum suction. Ethanol was
4
recovered and the liquid containing lignin was obtained.
According to the research of M.A. Hubbe, et al. (2019) [16],
the hydroxycarboxylic acids in lignin molecules can become
less soluble forms when pH is decreased to below 3.5.
Therefore, to optimize lignin precipitates from the filtrate,
the liquid’s pH was adjusted from 3.5 to 1.5 and the pH
values were measured by a pH meter (Extech 407228, USA).
The diluted solution of hydrochloric acid 6 M was added to
five samples containing 100 ml of the liquid to reach a target
pH ranging from 3.5 to 1.5 [17]. All the samples were left
for 24 h for lignin precipitation [15]. Each settled sediment
was collected by a filter and then dried at 80oC until constant
mass [4]. The yield of collected lignin was determined from
the difference between the initial weight of the rice straw
sample used for lignin extraction and the dried weight of
lignin collected.
Characterizations
FTIR, TGA, and XRD were used to evaluate the
fundamental properties of the lignin products. FTIR analysis
was conducted with an Alpha-Bruker FTIR spectrometer
using KBr powder to determine the absorbance of the
functional groups of lignin, and the measurements were
performed in the range of 500-4000 cm-1 with a resolution
of 4 cm-1 [18].
TGA was accomplished on a Q500-TA instrument
operating from temperature room (24-28oC) to 700oC with a
heating rate of 20oC/min under a nitrogen atmosphere. The
TGA presented the change in weight of the lignin samples
as a function of temperature. The TGA curves indicated the
rate of mass loss versus temperature, which was used to
recognize the thermal stability of lignin [15].
The evaluation of lignin crystallinity was carried out
using XRD on an Aeris Panalytical Diffractometer with
Cu Kα Ni-filtered radiation of λ=1.543 Å with a working
voltage of 45 kV. The diffraction patterns in the 2θ mode
between 10-50° were recorded with a step size of 0.019° and
a scan time of 43.00 s/step [15, 19].
Statistical analysis
All experiments were carried out in triplicate. The paired
t-test was performed to determine the statistically significant
effect of pH values on lignin yields by using the SPSS
package ver. 11-2018 (USA).
Results
The yields of raw lignin at different pH values
Table 1 shows the paired t-test results of the raw lignin
yields that were precipitated with hydrochloric acid at
different pH values in the range of 3.5-1.5.
september 2022 • Volume 64 Number 3
Physical sciences | Chemistry
Table 1. The Paired T-test result of raw lignin yields by pH.
Paired samples test
Pair 1
Pair 2
Pair 3
Pair 4
Pair 5
Pair 6
Pair 7
Pair 8
Pair 9
Pair 10
Mean
N
Standard
deviation
pH1.5
16.51
3
0.16
pH2.0
17.66
3
0.13
pH1.5
16.51
3
0.16
pH2.5
15.27
3
0.15
pH1.5
16.51
3
0.16
pH3.0
14.33
3
0.47
pH1.5
16.51
3
0.16
pH3.5
13.26
3
0.60
pH2.0
17.66
3
0.13
pH2.5
15.27
3
0.15
pH2.0
17.66
3
0.13
pH3.0
14.33
3
0.47
pH2.0
17.66
3
0.13
pH3.5
13.26
3
0.60
pH2.5
15.27
3
0.15
pH3.0
14.33
3
0.47
pH2.5
15.27
3
0.15
pH3.5
13.26
3
0.60
pH3.0
14.33
3
0.47
pH3.5
13.26
3
0.60
Significant
(2-tailed)
0.015
0.019
0.021
0.017
<0.001
0.009
Characterizations
0.005
FTIR analysis
0.78
0.016
0.111
The paired sample t-test was used to assess the statistical
difference between the pH values on the mean yields of
lignin. The results showed that the pair of pH 2.5-3.0 (pair 8)
and the pair of pH 3.0-3.5 (pair 10) were not significantly
different (sig.>0.05) within each pair at a confidence level
of 95%. There were significant differences within each
pair (sig.<0.05) at a 95% confidence level. The mean yield
obtained varied from 13.26 to 17.66 g.
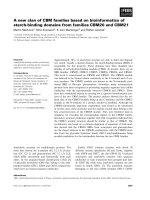
Figure 1 indicates that the decrease of pH from 3.5 to
1.5 increased the yield. The highest percentage of lignin
precipitate was above 17% at pH 2.0. These observations
agree with previous studies [15, 19]. The curve was divided
into two stages: firstly, when pH was reduced from 3.5 to 2,
Fig. 1. The change in yield at different pH values.
more lignin started to precipitate because the hydrogen
ions in the hydrochloric acid solution interacted with
the negatively charged lignin molecules. The repulsive
forces between suspended particles were reduced and the
coagulation of lignin occurred. Thus, a higher concentration
of hydrogen ions increased the precipitation of lignin.
At pH 2.0, the highest yield was obtained because of the
lower amount of soluble carboxyl acids. In the second
stage, the yield of lignin precipitation decreased when more
hydrochloric acid was added to the mixture because the
precipitates became unstable and re-dissolved. According to
S. Priyanto, et al. (2019) [7], the higher the concentration of
acidity, the easier the lignin coagulation formed. However,
if the mixture was too acidic, the lignin yield was potentially
damaged. Therefore, the target pH to precipitate lignin was
pH=2.0 [15].
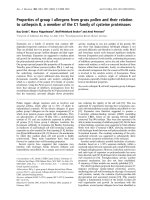
The spectra of the lignin samples obtained at pH values
from 3.5 to 1.5 are analysed using FTIR in the range of 5004000 cm-1 and are shown in Fig. 2. All the spectra show
variations in band intensities that are related to the functional
groups of lignin. From 3000-3450 cm-1, the broad vibration
was assigned to hydroxyl groups and did not correlate
with the pH changes of the solutions. The carbonyl groups
corresponded to the absorbance at 1650 cm-1, however,
there was a significant drop in peaks when the pH values
were higher (pH 3.5, pH 3.0). At 1592 cm-1, which are the
bands of aromatic skeletal vibrations, there were changes in
the peak intensities with a decrease in pH. The other bands
related to methoxyl groups were around 1454-1421 cm-1.
The absorbance signals between 1305-1090 cm-1 show the
C=C, C=O, and C–O groups [4, 15].
Fig. 2. FTIR spectra of crude lignin at different pH.
september 2022 • Volume 64 Number 3
5
Physical Sciences | Chemistry
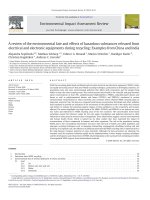
TGA analysis
Figure 3 indicates weight loss occurring as the
TGA curves decrease. The degradation temperature of
lignin occurred over a wide temperature range, such as
between 100 and 700oC, due to lignin being a natural
polyphenolic polymer containing various branching
[20]. The degradation of rice straw lignin was seen over
three stages. In the first stage, weight loss at 30-100oC
occurred due to water evaporation in the lignin samples.
For the second stage, the degradation of carbohydrate
components occurred and released carbon greenhouse
gases such as CO, CO2 and CH4 at 180-370oC. In this
stage, there was a significant change in the slope of
the thermal decomposition. The final stage of lignin
degradation started above 450oC, but mass loss rates
were much smaller than in the second stage [21]. Also,
in the final stage, the breakdown of lignin molecules only
occurred when the biomass reached the target thermal
energy. From pH 3.5 to 1.5, about 44-15% of all crude
lignin samples remained at 700oC [15, 20] because there
were trends to form chars from the highly condensed
aromatic structure of lignin [22]. However, over 75 and
85% of the weight loss were decomposed at pH 3.5 and
pH 3.0, respectively and implied the evidence for higher
impurities of lignin precipitates.
Fig. 3. TGA spectra of crude lignin at different pH values.
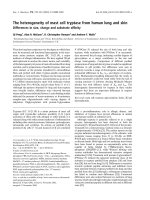
XRD analysis
The XRD analysis in Fig. 4 indicates changes in the
crystallinity of lignin samples with pH. At pH values of
3.5 and 3.0, a wide peak at 2θ values ranging from 17 to
32oC is seen, but the lignin peaks obtained at pH 2.5, 1.5,
and 2.0 were wider at 2θ from 12 to 38oC. This indicates
that the broad peaks are related to the amorphous regions
6
of the lignin substances. At pH 1.5, the amorphous degree
was narrower because of the non-lignin materials in the
samples collected [15].
Fig. 4. XRD spectra of crude lignin obtained at different pH values.
Conclusions
The study results demonstrated that varying pH values
of diluted hydrochloric acid affected lignin yields. The
lignin precipitates were 16.51, 17.66, 15.27, 14.33 and
13.26% at pH 1.5, 2.0, 2.5, 3.0, 3.5, respectively. A pH
of 2.0 was found to be the most effective to recover crude
lignin from the solution. The FTIR spectra showed the
most functional groups, such as carbonyl, aromatic rings,
and methoxyl. The TGA results indicated that the thermal
characteristics of lignin precipitates were related to the
change in pH. About 75 and 85% of lignin materials
precipitated at pH 3.0 and pH 3.5, respectively, which
were thermally decomposed at 700oC. In contrast, 56%
of samples at pH 2.0 remained at 700oC because of the
condensed aromatic structures of the lignin substances.
The XRD analysis indicated that different pH values also
significantly affected the crystalline regions of lignin
materials. At pH 2.0 and 2.5, the broadened peaks occurred
at 2θ from 12 to 38oC, but those became narrower when
the value of pH was 1.5.
This paper provides useful information on the
efficiency of lignin precipitates from rice straw with
respect to pH values. Therefore, it is noted that varying the
pH in the lignin coagulation process should be considered
and evaluated to obtain the desired lignin mass.
september 2022 • Volume 64 Number 3
Physical sciences | Chemistry
COMPETING INTERESTS
The authors declare that there is no conflict of interrest
regarding the publication of this paper.
REFERENCES
[1] B. Xiao, X.F. Sun, R.C. Sun (2001), “Chemical, structural,
and thermal characterizations of alkali-soluble lignins and
hemicelluloses, and cellulose from maize stems, rye straw, and rice
straw”, Polymer Degradation and Stability, 74(2), pp.307-319.
[2] A.U. Buranov, G. Mazza (2008), “Lignin in straw of
herbaceous crops”, Industrial Crops and Products, 28(3), pp.237-259.
[3] Z. Borcsok, Z. Pasztory (2020), “The role of lignin in wood
working processes using elevated temperatures: An abbreviated
literature survey”, European Journal of Wood and Wood Products,
79, pp.511-526.
[4] S. De, S. Mishra, E. Poonguzhali, M. Rajesh, K. Tamilarasan
(2020), “Fractionation and characterization of lignin from waste rice
straw: Biomass surface chemical composition analysis”, International
Journal of Biological Macromolecules, 145, pp.795-803.
[5] D.V. Ngo, T.H. Tran, D.N. Bui, D.C. Vu, V.H. Nguyen
(2017), “Lignin and cellulose extraction from Vietnam’s rice straw
using ultrasound-assisted alkaline treatment method”, International
Journal of Polymer Science, 1063695, pp.1-8.
[6] P. Traynard, A.A. Ayroud, A. Eymery (1953), “Existence
d’une liaison lignine-hydrates de carbone dans le bois”, Association
Techique Industrie Papetiere Bulletin, 2, pp.45-52.
[7] S. Priyanto, A.P. Intan, B. Rianto, T.D. Kusworo,
B. Pramudono, E. Untoro, P. Ratu (2019), “The effect of acid
concentration (H2SO4) on the yield and functional group during lignin
isolation of biomass waste pulp and paper industry”, Reaktor, 19(4),
pp.162-167.
[8] Á. Guzmán, S. Delvasto, E. Sánchez (2015), “Valorization
of rice straw waste: An alternative ceramic raw material”, Ceramica,
61, pp.126-136.
[9] V.H. Nguyen, C.M.D. Monet, M.V. Migo, R. Quilloy,
C. Balingbing, P. Chivenge, M. Gummert (2020), “Rice straw
overview: Availability, properties, and management practices”,
Sustainable rice straw management, Springer, pp.1-14.
[10] N.Q. Diep, K. Sakanishi, N. Nakagoshi, S. Fujimoto,
T. Moniwa (2015), “Review potential for rice straw ethanol production
in the Mekong Delta, Vietnam”, Renewable Energy, 74, pp.456-463.
[11] K. Luo, Y. Wang, H. Xiao, G. Song, Q. Cheng, G. Fan
(2019), “Preparation of convertible cellulose from rice straw using
combined organosolv fractionation and alkaline bleaching”, Earth
and Environmental Science, 237, pp.1-6.
[12] X.N. Nie, J. Liu, D. She, R.C. Sun, F. Xu (2013),
“Physicochemical and structural characterization of hemicelluloses
isolated by different alcohols from rice straw”, Bioresources, 3(8),
pp.3817-3832.
[13] A.M. Mansora, J.S. Lima, F.N. Anib, H. Hashima,
W.S. Hoa (2019), “Characteristics of cellulose, hemicellulose
and lignin of MD2 pineapple biomass”, Chemical Engineering
Transactions, 72, pp.79-84.
[14] N. Nadiha, B. Jamilah (2020), “Hemicellulose extraction
and characterization of rice straw and Leucaena Leucocephala”,
Knowledge E. Social Sciences, pp.46-54, DOI: 10.18502/kss.
v4i9.7314.
[15] N.H. Do, H.H. Pham, T.M. Le, J. Lauwaert, L. Diels,
A. Verberckmoes, N.H.N. Do, V.T. Tran, P.K. Le (2020), “The novel
method to reduce the silica content in lignin recovered from black
liquor originating from rice straw”, Scientific Reports, 10, DOI:
41598.020-77868-5.
[16] M.A. Hubbe, R. Alén, M. Paleologou, M. Kannangara, J.
Kihlman (2019), “Lignin recovery from spent alkaline pulping liquors
using acidification, membrane separation, and related processing
steps: a review”, BioResources, 14(1), pp.2300-2351.
[17] M.G. Alriols, A. Tejado, M. Blanco, I. Mondragon,
J. Labidi (2009), “Agricultural palm oil tree residues as raw material
for cellulose, lignin and hemicelluloses production by ethylene glycol
pulping process”, Chemical Engineering Journal, 148(1), pp.106-114.
[18] C.W. Dence (1992), “The determination of lignin”, Methods
in lignin chemistry, pp.33-61, DOI: 10.10071978-3-642-74065-7-3.
[19] P.S.B. Santosa, R. Pradoa, P.H.G. Cademartorib, S. Cavac,
D.A. Gattoc, J. Labidi (2013), Effect of precipitation ph on kraft
lignin composition, 4th International Conference on Biorefinery towards Bioenergy ICBB, China.
[20] D. Watkins, M.D. Nuruddin, M. Hosur, A.T. Narteh,
S. Jeelani (2015), “Extraction and characterization of lignin from
different biomass resources”, Journal of Materials Research and
Technology, 4(1), pp.26-32.
[21] A. Tejado, C. Pena, J. Labidi, J.M. Echeverria, I. Mondragon
(2007), “Physico-chemical characterization of lignins from different
sources for use in phenol-formaldehyde resin synthesis”, Bioresource
Technology, 98(8), pp.1655-1663.
[22] M.W.I. Schmidt, A. Noack (2000), “Black carbon in soils
and sediments: Analysis, distribution, implications, and current
challenges”, Global Biogeochem Cycles, 14(3), p.777-793.
september 2022 • Volume 64 Number 3
7