Effects of bentonite and zeolite minerals on mobility of lead in paddy soil in Chi Dao commune, Van Lam district, Hung Yen province, Vietnam
Bạn đang xem bản rút gọn của tài liệu. Xem và tải ngay bản đầy đủ của tài liệu tại đây (3.13 MB, 7 trang )
Environmental Sciences | Environmental science
Doi: 10.31276/VJSTE.64(3).90-96
Effects of bentonite and zeolite minerals on mobility of lead in paddy soil
in Chi Dao commune, Van Lam district, Hung Yen province, Vietnam
Tu Ngoc Nguyen*, Huy Quang Trinh, Cong Huy Vo
Vietnam National University of Agriculture
Received 25 October 2021; accepted 28 November 2021
Abstract:
Used lead-acid battery recycling activities in Minh Khai handicraft village, Chi Dao commune, Van Lam district, Hung
Yen province, Vietnam has markedly increased the lead (Pb) content in paddy soil. Reducing the mobility of lead and lead
accumulation in rice plants/plain rice are major priorities to reduce the impacts of lead in paddy soil. Application of the
minerals zeolite (4A and Faujasite) and bentonite (natural and modified) to lead-contaminated soil has been carried out in
lab scale for three years. The results showed the efficiencies in reducing accumulated lead in rice were 58 and 56% after
adding the artificial additives zeolite 4A and zeolite Faujasite, respectively. These results were better than those of modified
bentonite and natural bentonite, which were only 44 and 24%, respectively. The control efficiency of Pb accumulated in rice
plants between the supplemented samples of zeolite Faujasite, zeolite 4A, modified bentonite, and natural bentonite were
69, 56, 42, and 40%, respectively, compared with the control samples. The addition of minerals to the soils has also resulted
in decreases of the growth and yield of the experimental rice plants compared with the control samples. In this research,
0.1 to 0.2% of zeolite Faujasite showed the best results in terms of reducing Pb content in soil as well as low effect on plant
growth. This research opens up on-site pollution control solutions for lead-contaminated agricultural soils.
Keywords: heavy metals, lead immobilizing, minerals, rice uptake.
Classification number: 5.3
Introduction
Lead content in natural soil ranges from 10 to 50 ppm [1].
Due to biogeochemical cycling changes and imbalances from
manmade activities such as use of fertilizer [2, 3], manure [4],
sludge disposals [5], or polluted irrigation water [6, 7] result
in the accumulation of lead in soil and create risks to human
health and ecology [8]. Lead in soil may be in a soluble form,
or found as lead inorganic compounds PbS, PbSO4, PbSO4.
PbO, α-PbO [9], or be associated with organic compounds
such as amino acids, fulvic acids, and humic acids [10]. The
mobility of lead in soil is largely controlled by pH [11, 12],
the presence of organic matter [13], and clay mineral content
[14]. Lead phytoavailability and toxicity are dependent on
their speciation.
Zeolite is the general name for aluminosilicate minerals
called tectosilicates, which have three-dimensional
frameworks [15]. Zeolite has high cation exchange capacity
and selective absorption, so it is widely used in environmental
treatment especially for heavy metal absorption in
contaminated soils [16-19]. Chemical stabilization of heavy
metals by adding artificial additives has been evaluated as one
of the most cost effective in situ remediation techniques for
metal contaminated sites [16, 20]. Chemical stabilization may
lead to a decrease in extractable metal content in soil [21] and
metal phytoavailability in plants [16, 22].
Used lead-acid battery recycling activities in Minh Khai
handicraft village, Chi Dao commune, Van Lam district, Hung
Yen province, Vietnam discharges copious amounts of acidic
wastewater and causes soil and water pollution. Some studies
reported that Pb concentration in soils in the handicraft village
exceeded the allowable value [23, 24] and causes major
health issues in the local community [25, 26]. Therefore the
agricultural soil surrounding the handicraft village is not safe
enough for cultivation.
This study was implemented to evaluate and determine
a suitable in situ remediation for Pb-contaminated sites by
adding artificial minerals into soils to immobilize lead and
decrease its phytoavailability in rice plants. Some effects of
additives on the rice growth (such as plant height, number of
panicles, length, and weight of plain rice) in this study were
also determined.
Materials and methods
Materials
Zeolite minerals: In this study, minerals of zeolite 4A and
zeolite Faujasite were synthesized from silica particles of rice
straw. The hydrothermal crystallization method was used to
synthetize zeolite minerals and the products, shown in Table
1, were characterized using x-ray powder diffraction (XRD)
Corresponding author: Email:
*
90
september 2022 • Volume 64 Number 3
Environmental Sciences | Environmental science
and observed by scanning electron microscope (SEM).
Table 1. Properties of zeolite minerals.
No.
Element
Zeolite 4A
Zeolite Faujasite
1
Chemical formula
Na12Al12Si12O48.27H2O
Na2Al2Si2.5O9.6H2O
2
Mineral compositions
Na2O; Al2O ; SiO2
Na2O; Al2O3; SiO2
3
Crystalline size, µm
2.5
4
4
CEC, meq 100 g
341
432
5
Pb absorption efficiency, %
82.67
96.56
6
SEM captured off (A)
zeolite 4A and (B) zeolite
Faujasite
-1
Rice grain samples: The rice grains were used in this
research to determine the effectivity of lead cumulative
control after adding mineral additives to the soil. These rice
grains were collected from the experimental pots.
Methods
Natural bentonite and modified bentonite minerals:
The natural bentonite in this research was collected from
the Tam Bo bentonite mines, Di Linh district, Lam Dong
province, Vietnam. The mineral was compounded by high
Montmorillonite content (about 64%) while the remains
were Kaolinite (9.5%), Illite (6.0%), Quartz (5.0%), Feldspar
(3.5%), Goethite (3.0%), Canxit (little), and other minerals.
Chemical compositions of the natural bentonite were mainly
composed of SiO2 (50.5%), Al2O3 (17.67%), and Fe2O3
(7.0%). The mineral had a CEC of 19.5 meq 100 g-1 and the
basal spacing of 15.49 Å.
Al-pillared bentonite was created by activating the natural
bentonite with polyoxymetal cations of Al solution. The
activated mineral had CEC of 58.6 meq 100 g-1 and the basal
spacing of 16.81 Å.
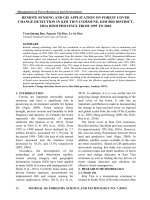
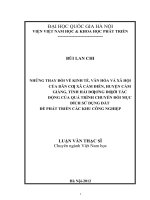
Contaminated-Pb soil samples: Soil samples used in the
research were collected from the 0-20 cm surface layers of
10 small scale paddy fields surrounding the used lead-acid
battery recycling facilities in Minh Khai handicraft village,
Chi Dao commune, Van Lam district, Hung Yen province,
Vietnam (Fig. 1).
Fig. 1. Soil sampling locations.
Rice plants: Greenhouse pot experiments were conducted
at the Vietnam National University of Agriculture (VNUA)
and used to evaluate the effects of zeolite and bentonite
minerals on the immobility of lead in soil and the growth and
grain yield of rice plants. The Bac Thom No.7 resistance leaf
blight variety was used in the pot experiments. Rice plants of
age 10-13 days after sowing were planted in the experimental
pots. Three rice plants with the same height were planted in
each experimental pot.
Soil analysis: Soil samples were examined by the PIXE
method (particle-induced x-ray emission) to determine its
chemical composition. Other physio-chemical properties of
the soil samples such as pH, electro-conductivity (EC), texture,
and organic matter (OM) content were also determined.
Plant-available Pb analysis: Pb phytoavailability was
extracted from soil by the diethylenetriamine pentaacetic acid
(DTPA) method at a pH of 7.3. Each 10 g portion of air-dried
soil was passed through a 2.0-mm sieve to which 20 ml DTPA
extractant was added. The suspensions were shaken at 175
rpm for 2 h. The experiments were terminated by filtration of
the suspension by a cellulose acetate filter, then determining
the soluble ion of Pb using ICP-OES (PE 7300 V-ICP, Perkin
Elmer).
Determination of Pb content in rice plant and grain: Pb
content in rice plants and grains was determined by using aqua
regia (3:1 HCl/HNO3). Briefly, 50 mg of dried sample was
drilled and digested in 50 ml of the aqua regia solution. The
solution was then gently shaken and filtered by a cellulose
acetate filter. The soluble ion of Pb was determined using ICPOES (PE 7300 V-ICP, Perkin Elmer).
Greenhouse pot experimental design method: After
assessing the composition and properties of the soil, the soil
samples were mixed together and then NPK fertilizer was
added with an amount of 25 kg per 360 m2 (corresponding
1.1 g per experimental pot). This soil was then filled into
the experimental pots (30 cm diameter x 20 cm height). The
experiment was conducted over three seasons. Four types
of minerals (natural and modified bentonite, zeolite 4A, and
zeolite Faujasite) with six treatments (5 levels of additives
from 0.1 to 0.5% and the control) were replicated three times
in one season resulting in 72 pots (4x6x3) in total (Table 2).
The weight of both soil and added mineral was 5 kg in total.
The Bac Thom No.7 resistance leaf blight variety was used in
the pot experiment, which was submerged in 5 cm of water
over the entire growth period. Three seedlings 13 days in age
september 2022 • Volume 64 Number 3
91
Environmental Sciences | Environmental science
Element
Control
Level 1
Level 2
Level 3
Level 4
Level 5
Ration (w/w)
0%
0.1%
0.2%
0.3%
0.4%
0.5%
Mineral amount, g
0
5
10
15
20
25
Soil amount, g
5,000
4,995
4,990
4,985
4,980
4,975
Total, g
5,000
5,000
5,000
5,000
5,000
5,000
Table 3. Growth stages of rice plant and evaluated elements.
No
Stages
Time, day
Element
1
Seeding
13
Pb total, extractable Pb in soil, pHKCl
2
Transplanting
26
3
Tillering
36
4
Panicle formation
49
5
Flowering
61
6
Harvest
109
- Extractable Pb in soils
- pHKCl
- pHKCl, extractable Pb in soil, Pb content
in rice plant and polished rice, height of
rice plant, number of panicles, length of
rice grain and weight of 1000 grains.
Results and discussion
Compositions and properties of soil samples
The results show that soil pHKCl values ranged from 3.4 to
5.2 with an average of 4.1. The soil in the study area is acidic.
Although the sampling locations were within a narrow area,
the variations in pHKCl value were relatively large. This can
be explained by external effects such as the use of wastewater
containing high H+ ions discharged from the village for
irrigation. The low pHKCl values in soil may lead to increase
in the risk of pollution by mobilizing heavy metals and thus
increasing its bioavailability for plants [27] (Table 4).
The OM contents of soil samples ranged from 1.33 to
2.44%. According to the Ministry of Natural Resources and
Environment (2015) [28], the soil samples from this area were
from the low-to-medium organic matter content groups (from
2.60-3.36%). Soil texture analysis showed that the proportion
of clay ranged from 3.7 to 8.0%, limon from 50.0 to 63.1%,
and sand from 32.1 to 46.3%. The average CEC value was
about 12.8 meq 100g-1. These low CEC and organic matter
values contribute to conditions that make the exchange of
Pb content in the soil high. Total Pb content in the 10 soil
samples ranged from 403.8 to 1766 mg kg-1 with an average
of 999±322.28 mg kg-1.
92
Parameters
Soil sample No.
S01
S02
S03
S04
S05
S06
S07
S08
S09
S10
pHKCl
3.40
(±0.01)
3.59
3.41
3.90
4.14
3.92
4.65
4.59
3.69
(±0.01) (±0.01) (±0.01) (±0.01) (±0.01) (±0.02) (±0.01) (±0.01)
5.20
(±0.03)
OM (%)
2.44
(±0.02)
2.24
2.39
2.09
1.89
2.90
2.04
2.12
2.60
(±0.02) (±0.05) (±0.02) (±0.02) (±0.05) (±0.02) (±0.02) (±0.05)
1.33
(±0.04)
EC (µS cm-1)
305.3
(±5.51)
339.3 234.3 163.3 178.7 165.2 129.5 156.2 163.5
(±9.71) (±17.6) (±2.46) (±11.3) (±4.07) (±4.90) (±4.16) (±4.15)
92.6
(±2.20)
CEC
meq 100g-1
13.0
(± 3.7)
15.4
(± 1.9)
12.2
(±4.6)
11.4
(± 3.1)
11.6
13.2
12.7
(± 4.7) (± 1.5) (±0.8)
11.9
(±3.4)
13.5
(± 2.4)
12.8
(± 4.6)
Pb, mg kg-1
1,116
921
1,014
1,090
1,766
972
816
827
1,064
404
-1
Cu, mg kg
218.3
208.3
184.2
240.0
297.0
178.4
189.5
189.3
209.8
183.5
Zn, mg kg-1
219.5
228.7
271.7
289.7
264.5
263.0
202.7
200.1
220.3
174.3
Ni, mg kg-1
44.09
38.98
46.20
46.99
39.72
40.61
47.18
40.05
39.99
44.37
Effects of minerals on plant-available Pb in soil and Pbuptake by rice plant
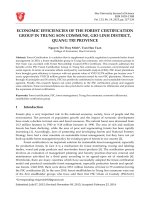
Effects on plant-available Pb content in soils: Analysis
results after three consecutive experiments showed that
there was a signification decrease in the concentration of
Pb extracted by the DTPA solution when the four types of
adsorbents at different levels were added. The average mobile
Pb content in the control sample was 53.94 mg kg-1. After the
experiment (over 3 crops, 109 days for summer-autumn crop
or 137 days for winter-spring crop), the average content over
3 crops of mobile Pb was about 32.26 mg kg-1 achieving an
efficiency of about 40.14% reduction in soluble Pb content
in the soil (Fig. 2). One-way ANOVA analysis showed that
the difference in Pb content values between the control and
mineral added samples was significant (p<0.05).
60
-1
Table 2. Lab-scale experimental design.
Table 4. Soil compositions and properties in the study.
Pb plant available content in soils, mg.kg
were planted in each pot. NPK 17-12-5 fertilizer with a dosage
of 1.1 g per pot was supplemented three times during the
experiment beginning at basal fertilizing (before experiment
operation), then the first application of fertilizer (10 days after
plantation), and second application addition fertilizer (49 days
after plantation) (Table 3).
50
40
30
20
Control
Level 1
Level 2
Level 3
Level 4
Level 5
Fig. 2. Plant-available Pb content in soils in relation to minerals
added. Amount of added minerals, level 1: 0.1%; level 2: 0.2%, level
3: 0.3%, level 4: 0.4%; level 5: 0.5%. The above Pb contents were
calculated by the average value of 4 minerals within 3 crops.
september 2022 • Volume 64 Number 3
Environmental Sciences | Environmental science
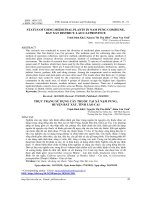
Effects on Pb content uptake by rice plant: The results
from 50three experimental crops showed a significant difference
in Pb content in rice plants depending on the type and level
of minerals
added to the soil. All of the mineral-supplemented
40
pots showed a lower Pb accumulated content in rice compared
to the control pots. The ability of the minerals to control Pb
30
accumulation in rice plants ranged from 24 to 58% compared to
the control samples. The efficiency of reducing Pb accumulation
in rice20 plants treated with the minerals zeolite 4A and zeolite
g
ng
ng
on
ing
tial
rity than
Faujasite was
win 56%,
atiwhich
eriwas better
nti respectively,
ler
Ini 58 and
atu
So
nit
ow
pla
i
M
Til
l
s
e
F
n
icl minerals (44 and 24%,
bentonite
the modified and natural
Tra
Pan
7070
X Data
6060
-1
Modified bentonite
There is a relatively strong correlation between the Pb
content accumulation in rice plants and the additional mineral
levels
as seen from R2 ranging from 0.66 to 0.94 (n=15).
50
Although the capacity to control Pb content in rice varied
between the types of mineral supplementation, the general
40
trend
for all four materials was that Pb concentration in rice
decreased with the increase of mineral amount added to the soil.
60
Effects on Pb contents in rice grain: There was a significant
difference in the extracted Pb content between the control
20 mineral-added
and
samples
alltreated
four with
types
adsorbent.
reducing
Pb accumulation
in rice for
plants
the of
minerals
Zeolite 4A and Zeolite
g
g
g
g
n
tywas than
n
n
n
ial trend
n
i
o
i
i
t
i
i
i
r
i
t
r
t
r
Faujasite
was
58%
and
56%,
respectively,
which
was
better
the modified and
The
general
was
that
the
Pb
content
of
rice
much
u
w
e
a
e
n
t
l
t
In
a
a
l
i
w
l
i
So
n
o
M
T
e i 24%,Flrespectively).
nsp
ltreatment.
a
natural than
Bentonite
(44%
and
The
largest
content of Pb
c
r
i
lower
that minerals
of
the
control
The
more
mineral
T
Pan
30
-1
intake in the rice plants reached 78.76 mg kg-1 (dry biomass) at the pot with natural
70
Bentonite
added, meanwhile, theX lowest
Data Pb content was only 52.41 mg kg-1 with the
Zeolite
supplementation of Zeolite 4A. In the two experiments
that4Aadded Zeolite Faujasite and
Zeolite Faujasite
57.07 mg kg-1 and 70.82
Pb plant-available content in soils, mg.kg
Pb uptake in rice seeds
-1
Pb plant-available content in soils, mg.kg -1
Pb plant-available content in soils, mg.kg
Zeolite 4A
Natural
bentonite
Zeolite
Faujasite
Modified bentonite
respectively). The largest content of Pb intake in the rice plants
reached 78.76 mg kg-1 (dry biomass) at the pot with natural
bentonite added, meanwhile, the lowest Pb content was only
52.41 mg kg-1 with the supplementation of zeolite 4A. In the
two experiments that added zeolite Faujasite and modified
bentonite,
the amount of Pb accumulated in rice was 57.07 mg
70
kg-1 and 70.82 mg kg-1, respectively (Fig. 4). Natural bentonite
Pb plant-available content in soils, mg.kg
Pb plant-available content in soils, mg.kg
-1
Although the immobility of Pb in soil by two minerals of
zeolite and bentonite was relatively good during the whole
experiment, there was a significant difference between the
growth stages of the rice plants. The effect of minerals on Pb
mobility was shown immediately after two growth stages of
sowing
70 (day 13) and transplanting (day 26). In the subsequent
stages, the degree of reduction in mobile Pb content was lower.
Natural bentonite
The impact of minerals reached an equilibriumModified
state bentonite
after the
60
first two
growth stages of the rice plants (Fig. 3).
60
5050
100
50
4040
90
40
3030
80
30
70
Pb upPtbakpelainnt-raicveaisleaebdles content in soils, mg.kg
-1
reducing Pb accumulation in rice plants treated with the minerals Zeolite 4A and Zeolite
Faujasite
was 58% and 56%, respectively, which was better than the modified
and
20 60
2020
y
g
lal
g 24%,
g
g
g
n
y
g
g
g
natural Bentonite
minerals
(44%
and
respectively).
The
largest
content
of
Pb
g
t
n
a
t
n
n
i
n
n
i
ity
o
n
n
n
i
n
i
o
i
ing
i
ing
t
tial
i
i
ing
i
ion
r
i
i
t
i
i
it
r
t
r
rin
tur
ewrer
ler
Ini
ow
ant
InIini
itat
oSwow pslpalnatn
we
atuatu
lliellre
intaitta
w
-1
i
S
o
n
i
o
M
Ma
T
Til
l
i
M
T
l
s
intake in the rice plants
reached 78.76
natural S ranspl
e mg kg
e in
F (dry biomass) at the pot with
Flo
n
e
F
50
l
l
n
l
a
c
c
a
r
c
i
i
T bentonite
TrT
aPnain
Pan
Bentonite added, meanwhile, the Plowest
Pb content was only 52.41 mg kg-1 with the Natural
Modified bentonite
Rice plant growth stages
Rice plant growth stages
supplementation
of Zeolite 4A. In Xthe
two experiments that added Zeolite Faujasite
and
70
40
Data
5
10
15
20
25
57.07 of
mgrice
kg-1plants.
and070.82
Fig. 3. Ranges of soluble Pb content in soil during growth
Zeolite 4Astages
Effects on Pb content uptake by rice plant Zeolite Faujasite
Effects on Pb content
uptake
by rice
plantmg.kg -1
Content
of added
minerals,
30
The results from three experimental crops showed a significant difference
in Pb from three experimental crops showed a significant difference in Pb
100The results
content in rice plants depending on the type and level of minerals added
content
to theinsoil.
rice All
plants depending on the type and level of minerals added to the soil. All
of 50
the mineral-supplemented pots showed a lower Pb accumulated
of content
the90 mineral-supplemented
in rice
pots showed a lower Pb accumulated content in rice
90
compared to the control pots. The ability of the minerals to control Pbcompared
accumulation
to
the
in
control
pots.
The
ability of the minerals to control Pb accumulation in
80
rice plants ranged from 24% to 58% compared to the control samples.rice
Theplants
efficiency
ranged
of from 24% to 58% compared to the control samples. The efficiency of
Pb uptake in rice seeds
60
100
80
40
8
70
30
60
20
tial
Ini
50
40
0
g
g
ng
ity
on
ing
tin
win
eri
tur
ler
tati
lan
So bentonite
ini
Ma
Til
low
Natural
e
F
nsp
l
a
c
r
i
Modified
T bentonite
Pan
Rice plant growth stages
5
10
15
20
Content of added minerals, mg.kg -1
25
70
8
60
50
40
30
Zeolite 4A
Zeolite FAU
20
30
0
5
10
take in rice seeds
Effects on Pb content uptake by rice plant
Fig. 4.
Pb content accumulated in rice plants with amount of added minerals.
100
The results from three experimental crops showed a significant difference in Pb
content
90 in rice plants depending on the type and level of minerals added to the soil. All
of the mineral-supplemented pots showed a lower Pb accumulated content in rice
80
compared
to the control pots. The ability of the minerals to control Pb accumulation in
rice 70
plants ranged from 24% to 58% compared to the control samples.
The 2022
efficiency
of
september
• Volume
64 Number 3
60
8
15
20
Content of added minerals, mg.kg -1
25
30
9
93
than that in polished rice. This is because the fixation of Pb to the root cell wall is greater
than that of other plant parts [30]. The addition of minerals to the soil reduced the Pb
accumulation in rice plants and this led to a decrease in the accumulation of Pb in rice
grains. Due to the higher CEC of the artificial minerals in the Zeolite group (Zeolite 4A
-1
Environmental Sciences | Environmental scienceand Faujasite Zeolite are 341 and 432 meq.100g , respectively) compared to the
Bentonite group (natural Bentonite and modified Bentonite are 19.5 and 58.6 meq.100g1
, respectively), a difference in the Pb concentration in the rice grain is understood.
supplementation, the lower the Pb content in rice. The mean
impact of controlling Pb content in rice when comparing the
supplement levels of zeolite Faujasite, zeolite 4A, modified
bentonite, and natural bentonite was 69%, 56%, 42%, and
40%, respectively (Table 5).
Table 5. Intake Pb contents in rice grain.
Pb contents in rice grain, µg.g-1
Level 1
Level 2
Level 3
Level 4
Level 5
Natural bentonite
0.81±0.01
0.42±0.02 0.57±0.06 0.65±0.05 0.39±0.03 0.42±0.04
Modified bentonite
0.78±0.05
0.40±0.03 0.54±0.11
Zeolite 4A
0.75±0.07
0.58±0.06 0.37±0.09 0.26±0.08 0.20±0.01 0.24±0.02
0.67±0.05
0.35±0.16 0.23±0.04 0.23±0.06 0.12±0.03 0.11±0.03
Zeolite Faujasite
Std. threshold
*
0.56±0.09 0.38±0.06 0.38±0.03
2D Graph 1
90
85
0,2 µg.g-1
Amount of added minerals, level 1: 0.1%; level 2: 0.2%, level 3: 0.3%,
level 4: 0.4%; level 5: 0.5%; *: QCVN 8-2:2011 of the Ministry of Health.
The content of Pb accumulated in rice varied considerably
(0.11 to 0.65 µg.g-1) between mineral added levels, and these
values were lower than that of the control samples (from 0.67
to 0.81 µg.g-1). The mean Pb intake by rice among the mineral
supplements was significantly different when compared with
the control sample (p<0.05, n=9). The most general trend
was that Pb intake in rice decreased in accordance with an
increase in added mineral amount. Artificial minerals of the
zeolite group have better control on Pb accumulation in rice
than minerals of the bentonite group. The content of Pb in
different parts of the plant tended to decrease in the order of
root > stem > leaf > flower > seed. J. Liu, et al. (2003) [29]
showed that the ratio of Pb content in root:stem:leaf of the
rice plants was 60:5:1 at the flowering stage and 19.4:2.9:1
at the mature stage. In this study, Pb concentrations in rice
plants were 155 to 274 times greater than that in polished
rice. This is because the fixation of Pb to the root cell wall
is greater than that of other plant parts [30]. The addition of
minerals to the soil reduced the Pb accumulation in rice plants
and this led to a decrease in the accumulation of Pb in rice
grains. Due to the higher CEC of the artificial minerals in
the zeolite group (zeolite 4A and Faujasite zeolite are 341
and 432 meq.100 g-1, respectively) compared to the bentonite
group (natural bentonite and modified bentonite are 19.5
and 58.6 meq.100 g-1, respectively), a difference in the Pb
concentration in the rice grain is understood.
Effects of minerals on rice plant grow
Effects on rice plant’s height: At the mature stage,
the height of the rice plants in all experimental treatments
reached an average value of 67.65 cm. However, the growth
heights of these plants varied between different types of
added minerals. While the average height of the rice plants
in the control sample was 84.25 cm, the maximum growth
height in the formula with natural bentonite was only 74.33
The height of rice plants, cm
Control
80
75
70
65
60
55
Controls
N. bentonite
M. bentonite
Zeolite 4A
Zeolite Faujasite
Fig.
minerals.
Fig. 5.
5. The
The height
heightof
ofrice
riceplants
plantsinindifferent
differentrate
rateofofadded
added
minerals.
Effects on the number of rice panicle
Effects
on the number of rice panicle: The average number
of rice panicles obtained in the experiments of adding natural
11
bentonite, modified bentonite, and zeolite
4A was 11.2, 12.4,
The panicles
average number
of rice
panicles obtained
in theFaujasite,
experiments of adding
and 12.8
per crop,
respectively.
For zeolite
natural
Bentonite,
modified
Bentonite,
andonly
Zeolite
11.2,Thus,
12.4, and
the average
number
of panicles
was
9.04A
perwas
crop.
the 12.8 panicles
per
respectively.
For Zeolite
Faujasite,
the averagewith
number
of panicles was only
ricecrop,
cultivation
efficiency
of the
soil amended
Faujasite
9.0 per crop. Thus, the rice cultivation efficiency of the soil amended with Faujasite
zeolite was much lower than that of other minerals. In addition,
Zeolite was much lower than that of other minerals. In addition, the average number of
the average number of rice panicles of the experimental
rice panicles of the experimental treatments was also 14.17 panicles lower than that of
treatments
also 14.17
lowerthat
than
of theofcontrol
the
control was
samples.
These panicles
results show
thethat
amount
rice panicles was
samples.
These
results
show
that
the
amount
of
rice topanicles
significantly affected by the amount of minerals added
the cultivated soil
-
(Fig.
2D Graph 2
18
16
Number of panicle per experimental pot
Type of minerals
Effects of minerals on rice plant grow
cm. The lowest height occurred with the Faujasite zeolite
Effects on rice plant’s height
mineral supplement experiment at only 66.64 cm. The average
At of
thethe
mature
theinheight
of the
rice plants supplemented
in all experimental treatments
heights
ricestage,
plants
the two
treatments
reached an average value of 67.65 cm. However, the growth heights of these plants
with zeolite 4A and modified bentonite was 73.38 cm and
varied between different types of added minerals. While the average height of the rice
70.77incm,
5). The
research
by growth
N. Hung
andin the formula
plants
the respectively
control sample (Fig.
was 84.25
cm, the
maximum
height
Pb the Faujasite
I. Kosinova
2019 [31]
showed
thatThe
less
thanheight
10 mg
kg-1 with
with
natural Bentonite
was only
74.33 cm.
lowest
occurred
Zeolite
experiment
at only and
66.64increase
cm. The tillering
average heights of the
contentmineral
in soilsupplement
can promote
rice growth
rice
plants
in the
treatments
supplemented
with Zeolitegreater
4A and modified
ability
and
roottwolength.
However,
concentrations
than Bentonite
was 73.38 cm
70.77 cm, respectively (Fig. 5). The research by Hung and Kosinova
10 mg kg-1 and
will inhibit the tillering stage and plant height
2019
[31] showed that less than 10 mg kg-1 Pb content in soil can promote rice growth
(R2=0.8-0.9, p<0.05).
14
12
10
8
6
4
2
Control
N. bentonite
M. bentonite
Zeolite 4A
Zeolite Faujasite
paniclesbased
basedon
onthe
thetype
type
mineral
added.
Fig. 6. Number of rice panicles
ofof
mineral
added.
Effects on the length and weight of rice grain
94
The obtained average rice grain length ranged from 5.88 to 6.25 mm, meanwhile,
this value in the control sample was 6.27 mm. With the average grain length of the
september 2022 • Volume 64 Number
3
blight-resistant
Bac Thom No. 7 cultivated under the standard conditions of 6.2 - 6.3
mm, all four experiments in this study yielded lower mean grain lengths than those in
the control sample. The weight of 1,000 grains of rice listed from 4 experimental
formulas in this study ranged from 18.47 to 18.85 grams/1,000 seeds (Fig. 8). Both
ENVIRONMENTAL SCIENCES | ENVIRONMENTAL SCIENCE*
was significantly affected by the amount of minerals added to
the cultivated soil environment, especially for Faujasite zeolite
at the levels of 0.4-0.5% by weight (Fig. 6).
Effects on the length and weight of rice grain: The
obtained average rice grain length ranged from 5.88 to 6.25
mm, meanwhile, this value in the control sample was 6.27
mm. With the average grain length of the blight-resistant
Bac Thom No. 7 cultivated under the standard conditions
of 6.2 - 6.3 mm, all four experiments in this study yielded
lower mean grain lengths than those in the control sample
(Table 6). The weight of 1,000 grains of rice listed from 4
experimental formulas in this study ranged from 18.47 to
18.85 grams/1,000 seeds (Fig. 7). Both agronomic indicators
of rice yield (the length and weight of 1,000 grains) showed
that these values in the mineral-added formulas were lower
than in the control (p<0.05, n=12) and lower than in the
normal growth conditions of the rice varieties, which are
6.2-6.3 cm and 19.0, respectively [32].
Table 6. The length and weight of 1000 rice grains (n=3).
Additives
Parameters
Control
Level 1
le'el 2
Leve| 3
Level 4
Leve| 5
Natural
...............................
Length of seed (mm)
6.29±0.01
6.14±0.02
6.13±0.01
6.18±0.05
6.01±0.13
6.25±0.04
19.46±0.05
18.61±0.28
18.86±0.13
18.72±0.16
18.59±0.10
18.71±0.21
6.22±0.04
6.11±0.09
6.07±0.15
5.88±0.15
0™7
5.88±0.18
bentonite
Weight of 1000
grains (g)
Modified
Length of seed (mm)
6.
bentonite
Zeolite
f 1000
W* o
grams (g)
19.20±0.22
18.55±0.26
18.52±0.12
18.46±0.04
18.33±0.26
18.51±0.19
Length of seed (mm)
6.30±0.02
6.23±0.05
6.17±0.13
6.16±0.08
6.09±0.18
6.01±0.21
W
19.29±0.34
18.92±0.28
18.93±0.18
18.97±0.17
18.86±0.06
18.55±0.21
5.99±0.15
5.99±0.10
6.21±0.04
6.01±0.04
6.25±0.02
00
eight ofl°
......................
Faljasite
—
Length of seed (mm)
6.26±0.03
.....................
Weight of 1000
grains
19.24±0.20
18.51±0.09
......................
.....................
18.89±0.10
18.80±0.28
..................... .......................
18.35±0.24
18.69±0.35
Fig. 7. VVeight of 1,000 lice grains under different amouiìt of added
minerals.
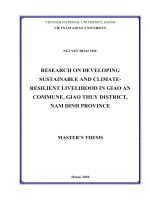
Fig. 8. (A) The relatively uniform growth and (B) the phenomenon
of dead of plants with the addition of zeolite Faujasite in the
íirst crop.
The decline in the growth and yield of rice plants can be
explained by the fact that materials with a very high cationexchange capacity (CEC) have claim on the nutrient minerals
in the soil and reduce the plant’s access to these nutrients
thus affecting some agricultural agronomic indicators of the
rice plants.
Conclusions
'TThe
',
,. ,-,•••
u .•
ti ■ •
agricultural soil for ricc cultivation in Minh Khai village,
Chi Dao commune, Van Lam district, Hung Yen province is
acidic (pHKCl ranges from 3.4 to 5.2), has low cation exchange
capacity (about 13.2 meq.100 g-1), and is classified from silty
to sandy silt. pe content ÚI soil in the area surrounding the
craft village is at a high level, which is 17 times higher than
the National Technical Regulation on the allowable limits
of heavy metals in soils. The addition of minerals of zeolite
and bentonite groups at the rate of 0.1 to 0.5% significantly
reduced the mobility of Pb mutal in the soil solutioia extracted
by DTPA. The efficiency of reducing the mobile Pb content
in soil decrcased from 24 to 58% compared with the control
sample. The ability to control Pb flexibility in ùe soil of the
zeolite mineral group was higher than that of the bentonite
group. The effect of reducing the flexible Pb content in the
soil led to a decrease in Pb accumulation in rice and ricc plants
(R2=0,66-0,93; n=15). The addition of minerals of the zeolite
and bentonite groups had a deterrent effect on the growth and
yield of experimental rice plants. The most appropriate mineral
SEPTEMBER 2022 • VOLUME 64 NUMBER 3
Vietnam Journal of Science,
Technology and Engineering
Environmental Sciences | Environmental science
supplementation ratio in this study was found to be between
0.1 and 0.2%. From the research results, it is possible to use
artificial zeolite minerals from agricultural by-products or
modified bentonite minerals to limit the mobility of Pb2+ metal
in the soil and reduce its accumulation in plants.
COMPETING INTERESTS
The authors declare that there is no conflict of interest
regarding the publication of this article
REFERENCES
[1] M.J. McLaughlin, D.R. Parker, J.M. Clarke (1999), “Metals and
micronutrients-food safety issues”, Field Crops Research, 60(1-2), pp.143-163.
[2] M.M. Lasat (2000), “Phytoextraction of metals from contaminated soil:
a review of plant/soil/metal interaction and assessment of pertinent agronomic
issues”, Journal of Hazardous Substances Research, 2, pp.1-25.
[3] S.R. Tariq, M. Shafiq, G.A. Chotana (2016), “Distribution of heavy
metals in the soils associated with the commonly used pesticides in cotton
fields”, Scientifica, 2016, DOI: 10.1155/2016/7575239.
[4] N.T. Basta, J.A. Ryan, R.L. Chaney (2005), “Trace element chemistry
in residual-treated soil: Key concepts and metal bioavailability”, Journal of
Environmental Quality, 34(1), pp.49-63.
[5] K. Weggler, M.J. McLaughlin, R.D. Graham (2004), “Effect of chloride
in soil solution on the plant availability of biosolid-borne cadmium”, Journal of
Environmental Quality, 33(2), pp.496-504.
[6] S.D. Pam, S.B. Sally, H. Dean, P. Kumi (2003), “Metal bioavailability
and speciation in a wetland tailings repository amended with biosolids compost,
wood ash, and sulfate”, Journal of Environmental Quality, 32(3), pp.851-864.
[7] Josef Bjuhr (2007), Trace Metals in Soils Irrigated with Waste Water in a
Periurban Area Downstream Hanoi City, Vietnam, Sveriges lantbruksuniversitet
50pp.
[8] J.J. D’Amore, S.R. Al-Abed, K.G. Scheckel, J.A. Ryan (2005),
“Methods for speciation of metals in soils: a review”, Journal of Environmental
Quality, 34, pp.1707-1745.
[9] G. Uzu, S. Sobanska, Y. Aliouane, P. Pradere, C. Dumat (2009), “Study
of lead phytoavailability for atmospheric industrial micronic and sub-micronic
particles in relation with lead speciation”, Environmental Pollution, 157(4),
pp.1178-1185.
[16] S.F. Cheng, Z.Y. Hseu (2002), “In-situ immobilization of cadmium and
lead by different amendments in two contaminated soils”, Water, Air, and Soil
Pollution, 140(1-4), pp.73-84.
[17] Z. Ioannou, T. Papapostolou, N. Georgoulas, A. Dimirkou (2012), “Use
of modified zeolites for the remediation of waters and cultivated soils from Cu
(II)”, Water, Air & Soil Pollution, 223(9), pp.5841-5854.
[18] S.R. Mallampati, Y. Mitoma, T. Okuda, S. Sakita, M. Kakeda (2012),
“Enhanced heavy metal immobilization in soil by grinding with addition of
nanometallic Ca/CaO dispersion mixture”, Chemosphere, 89(6), pp.717-723.
[19] A. Argiri, Z. Ioannou, A. Dimirkou (2013), “Impact of new soil
amendments on the uptake of lead by crops”, Communications in Soil Science
and Plant Analysis, 44(1-4), pp.566-573.
[20] B. Gworek B (1992), “Lead inactivation in soils by zeolites”, Plant and
Soil, 143(1), pp.71-74.
[21] A. Moirou, A. Xenidis, I. Paspaliaris (2001), “Stabilization Pb, Zn,
and Cd-contaminated soil by means of natural zeolite”, Soil and Sediment
Contamination, 10(3), pp.251-267.
[22] X. Xian (1989), “Effect of pH on chemical forms and plant availability
of cadmium, zinc and lead in polluted soils”, Water, Air and Soil Pollution, 45,
pp.265-273.
[23] Quoc Hung Phan (2011), Study on removal of Lead (Pb), Copper (Cu)
and zinc (Zn) in Paddy Soil by Biological Technology, Doctoral thesis, Hanoi
University of Agriculture (in Vietnamese).
[24] Viet Ha Cao (2012), “Evaluation for lead and copper pollution in
agricultural land in Van Lam district, Hung Yen province”, Journal of Science
and development, 10(4), pp.648-653 (in Vietnamese).
[25] T. Noguchi, T. Itai, N.M. Tue, T. Agusa, N.N. Ha, S. Horai, P.T.K.
Trang, P.H. Viet, S. Takahashi, S. Tanabe (2014), “Exposure assessment of
lead to workers and children in the battery recycling craft village, Dong Mai,
Vietnam”, Journal of Material Cycles and Waste Management, 16(1), pp.46-51.
[26] F. Takashi, E. Akifumi, A. Tetsuro, M.T. Nguyen, S. Go, T. Shin, H.V.
Pham, T. Shinsuke, T. Hidetaka (2016), “Lead contamination in surface soil on
roads from used lead-acid battery recycling in Dong Mai, Northern Vietnam”,
Journal of Material Cycles and Waste Management, 18(4), pp.599-607.
[27] D. Houben, L. Evrard, P. Sonnet (2013), “Mobility, bioavailability
and pH-dependent leaching of cadmium, zinc and lead in a contaminated soil
amended with biochar”, Chemosphere, 92(11), pp.1450-1457.
[10] C.B. Tabelin, T. Igarashi (2009), “Mechanisms of arsenic and lead
release from hydrothermally altered rock”, Journal of Hazardous Materials,
169(1-3), pp.980-990.
[28] Ministry of Natural Resources and Environment (2015), Circular
No.60/2015/TT-BTNMT on Promulgation of National Technical Regulation on
Soil Evaluation (in Vietnamese).
[11] H.A. Elliott, M.R. Liberati, C.P. Huang (1986), “Competitive adsorption
of heavy metals by soils”, Journal of Environmental Quality, 15, pp.214-219.
[29] J. Liu, K. Li, J. Xu, Z. Zhang, T. Ma, X. Lu, J. Yang, Q. Zhu (2003),
“Lead toxicity, uptake, and translocation in different rice cultivars”, Plant
Science, 165(4), pp.793-802.
[12] S. Sauve, M. McBride, W. Hendershot (1998), “Soil solution speciation
of lead (II): Effects of organic matter and pH”, Soil Science Society of America
Journal, 62(3), pp.618-621.
[13] F. Margaret, T. Yiping, Z. Ping, B.M. Muray (2013), “Extractability and
bioavailability of Pb and As in historically contaminated orchard soil: effects of
compost amendments”, Environmental Pollution, 177, pp.90-97.
[14] E.E. Hildebrand, W.E. Blum (1974), “Lead fixation by iron oxides”,
Naturwissenschaften, 61(4), pp.169-170.
[15] E. Erdem, N. Karapinar, R. Donat (2004), “The removal of heavy metal
cations by natural zeolites”, Journal of Colloid and Interface Science, 280(2),
pp.309-314.
96
[30] X. Bi, L. Ren, M. Gong, Y. He, L. Wang, Z. Ma (2010), “Transfer of
cadmium and lead from soil to mangoes in an uncontaminated area, Hainan
Island, China”, Geoderma, 155, pp.115-120.
[31] N. Hung, I. Kosinova (2019), “Environmental toxicology of cadmium
and lead (in the case of Long Khang, Vietnam)”, Russian Agricultural Sciences,
45(3), pp.271-275.
[32] Thi Le Nguyen, Hong Quang Vu, Thi Thu Nguyen, Thi Hue Nguyen,
Van Hoan Nguyen, Chi Dung Nguyen (2014), “Result of breeding Bac Thom
No.7 resistance leaf blight variety”, Journal of Science and Development, 12(2),
pp.131-138 (in Vietnamese).
september 2022 • Volume 64 Number 3