Báo cáo "Defining required forest area for protection soil from erosion in Vietnam: a GIS-based application " pptx
Bạn đang xem bản rút gọn của tài liệu. Xem và tải ngay bản đầy đủ của tài liệu tại đây (471.68 KB, 14 trang )
VNU Journal of Science, Earth Sciences 27 (2011) 63-76
63
Defining required forest area for protection soil from erosion
in Vietnam: a GIS-based application
Tran Quang Bao
1,
*, Melinda J. Laituri
2
1
Vietnam Forestry University, Xuan Mai, Chuong My, Ha Noi, Vietnam
2
Warner College of Natural Resources, Colorado State University, Fort Collins, CO 80523, USA
Received 15 March 2011; received in revised form 19 April 2011
Abstract. Forests play an important role in reducing erosion. In Vietnam, destroying natural
forests in mountainous areas has caused serious environmental problems for sustainable
development. Required forest areas for protection of soils from erosion in Vietnam are defined in
this study. An algorithm of defining required forest area for soil erosion prevention is based on a
comparison of soil loss prediction and its threshold of 10 ton ha
-1
yr
-1
(soil loss tolerance) within
the GIS environment. Soil loss is predicted from rainfall erosivity index, slope, porosity and
vegetation structures in which rainfall index is calculated from 30 year monthly rainfall data of
158 weather stations. A map of erosion risk for Vietnam illustrating potential to erode soil was
generated from slope, rainfall index and soil porosity by using spatial interpolation and map
algebra techniques in ArcGIS. Vegetation index, a function of canopy closure, height, ground
cover and litter cover, is classified into four groups. Required forest areas for protection of soil
from erosion are defined from an erosion risk map in comparison with categories of vegetation
index. An area (a raster cell) requires forest (natural forest or the others) when its erosion risk is
higher than the vegetation index.
Keywords: Soil Erosion, GIS, Required Forest Area, Erosion Risk Map, Soil Loss.
1. Introduction
∗
Soil erosion by water is one of the most
serious environmental problems in the world. It
causes adverse effects on soils, agricultural
production, water quality (Lal, 2001) [1].
Worldwide, soil erosion rate are highest in
Asia, Africa, and South America, averaging 30
to 40 tons ha
-1
yr
-1
, and lowest in Europe and the
United States, averaging about 17 tons ha
-1
yr
-1
(Pimentel et al., 1995) [2]. However, erosion
_______
∗
Corresponding author. Tel.: 84-4-33608418.
E-mail:
rates are low on land with natural vegetation
cover, about 2 tons ha
-1
yr
-1
in relatively flat land
and about 5 ha
-1
yr
-1
in mountainous areas
(Pimentel et al., 1998) [3].
In tropical regions where mean annual
sediment yield estimated is greater than 250
tons km
-2
(Walling at al., 1983) [4], upland
areas are usually protected from erosion by a
dense vegetation cover. Consequently, cutting
vegetation has caused an increase in runoff and
erosion (Morgan, 2005) [5]. Sidle et al. (2006)
[6] has summarized some key note papers about
soil erosion in Southeast Asia and concludes
T.Q. Bao, M.J. Laituri / VNU Journal of Science, Earth Sciences 27 (2011) 63-76
64
that forest conversion to agriculture and exotic
plantation (e.g., shifting cultivation) have
significant effects on both surface and landslide
erosion. The rates of surface erosion depend on
the extent dynamic management practices
disturb and compact soil, alter ground cover,
and modify soil properties. Therefore, accurate
estimation of soil loss or evaluation of erosion
risk has become an urgent task. Erosion
prediction can help to address long range land
management planning under natural and
agricultural conditions (Angima et al., 2003)
[7].
Efforts to mathematically predict soil
erosion by water have occurred only since the
1930s. Several models have been developed for
estimating soil loss (e.g., Wischmeier and
Smith, 1965; Morgan et al., 1984, 2001;
Woolhiser, 1990; Quynh, 1996) [8-12]. The
initial parameters in these models include
susceptibility of soil to erosion, potential
erosivity of rainfall and runoff, and soil
protection afforded by plant cover (Renard et
al., 1997) [13]. In practice, the Revised
Universal Soil Loss Equation (RUSLE) model
initially developed by Wishchmeier and Smith
(1965) has been most widely used. It was
originally developed for use on cropland. The
RUSLE has been applied in different land uses
(Renard et al., 1997) [13]. However, due to the
complexity of defining factors of RUSLE for a
given region, the application of the RUSLE in
Vietnam has been challenging in term of
prediction accuracy and its validation (Quynh,
1996) [12].
Traditionally, soil loss was predicted at the
local scale based on the factors usually
calculated from field measurement. Soil erosion
prediction at large scale is often difficult due to
spatial and temporal variability of model’s
factors (Lu et al., 2004) [14]. In recent decades,
the development of GIS techniques has
facilitated the estimation of soil erosion and its
spatial distribution over large areas. For
example, Yukel et al. (2008) [15] applied the
CORINE model integrated with remote sensing
and GIS to generate an accurate and
inexpensive erosion risk map in Turkey. Wang
et al. (2003) [16] estimated soil loss by
integrating a sample ground data set, TM
images, and a slope map and showed that the
geostatistical method performed significantly
better than traditional stratification in terms of
overall and spatially explicit estimate. Several
studies found applied GIS to interpolate
independent factor maps in RUSLE model (or
CORINE), then to overlay these maps to
generate a regional erosion risk map
(Bissonnais et al., 2001; Lufafa et al., 2003;
Kheir et al., 2006; Qing et al., 2008) [17-20].
In Vietnam, forests have long been
recognized to provide an important role in
environmental protection (Lung et al., 1995;
Quynh, 1996; Dien, 2006) [12,21,22].
However, under pressure of economic
development, the demand land for agricultural
and other sectors has increased creating
conflicts between land managers. Natural
forests mostly distributed in mountainous areas
have experienced high deforestation rates since
1980s (FPD, 2008) [23]. Consequently, soil
erosion in upland has caused serious
environmental problems (Lung et al., 1995)
[21]. There is an essential need to balance
between agriculture and forests, and minimize
as much forest land as possible while still
ensuring positive environmental effects of
forest. Responding to those problems, this study
applies an empirical model for predicting soil
loss to produce an erosion risk map, and define
required forest areas for protection of soil from
erosion for Vietnam. Spatial analyses and
interpolation techniques in GIS are used for this
study. The input data layers for mapping
include DEM, rainfall and vegetative cover.
T.Q. Bao, M.J. Laituri / VNU Journal of Science, Earth Sciences 27 (2011) 63-76
65
2. Methodology
2.1. Study Sites and Data Sources
Required forest areas for protection of soil
from erosion are identified for all territory of
Vietnam, an S-shaped country located in the
tropical monsoon area in the southeast of Asia
with a great variety of deltas, mountains, forest
mosaics, and climates. It has a rather high
temperature and humidity, average annual
temperature and humidity are above 200C and
80%, respectively. Average total annual rainfall
is approximately 1940 mm. Total land area is
about 330.000 km
2
, three fourths of the
Vietnam areas is covered by mountains causing
differences in climate regime between regions
(VNEA, 2006) [24]. Forest cover is about 38.2
% of which natural forests is account for 80 %
and plantation forests is account for 20% (FPD,
2007) [23]. Data sources used for spatial
analysis include: National Elevation Dataset
(90m x 90m); 30 years monthly rainfall data
gauged in 158 weather stations of Vietnam;
Archives data of 63 research plots of vegetation
structures and soil loss measurement. These
plots are representative for different vegetation
types in Vietnam (Quynh et al., 1996) [12].
2.2. Criteria for Defining Required Forest Area
The amount of soil erosion by water is an
integration of the effects of vegetation cover,
topographic features, climatic variables, and
soil characteristics (Renard et al., 1997) [13]. In
this study, to define required forest areas for
soil erosion protection, average soil loss per
unit areas was spatially predicted for Vietnam
by applying a soil loss equation prediction
developed for Vietnam (Quynh et al., 1996)
[12]. The relationship between soil loss
prediction and rainfall, slope, vegetation cover
structures and soil porosity factors can be found
expression in the following equation.
(
)
PLCGC
H
CC
K
A
*
**10*31.2
2
26
++
=
−
α
(1)
Where:
A = estimate average soil loss (mm year
-1
)
α = slope (degree)
CC = canopy closure (maximum is 1.0)
H = forest height (m)
GC = ground cover (maximum is 1.0)
LC = dried litter cover (maximum is 1.0)
P = soil porosity (maximum is 1.0)
K = rainfall erosivity factor, calculated
based on monthly rainfall (equation 2)
∑
=
+−+
=
12
1
100
]4.25/))ln(*481.28263.5lg[(*33116
*
4.25
i
ii
RR
K
(2)
Where: R
i
is rainfall of month i
th
.
The acceptance limits of erosion is 10 ton
ha
-1
year
-1
, this is the maximum rate of soil
erosion that can occur and still permit crop
productivity to be sustained economically
(Hudson, 1977; Renard et al., 1997) [13,25],
and approximately equivalent to 0.8mm yr
-1
. To
prevent soil degradation, annual soil loss (A) is
required to less than the sustainably
replacement rate (0.8 mm yr
-1
).
Then,
(
)
PLCGC
H
CC
K
A
*
**10*31.2
2
26
++
=
−
α
≤ 0.8
mm yr
-1
(3)
Let C
1
=
++ LCGC
H
CC
(4)
is index of vegetation for soil protection. An
area has potential soil erosion less than
replacement rate when its C
1
meets the
inequality equation (5) derived from inequality
(3).
T.Q. Bao, M.J. Laituri / VNU Journal of Science, Earth Sciences 27 (2011) 63-76
66
)*8.0/()**10*31.2(
26
1
PKC α
−
≥ (5)
Let C
2
= )*8.0/()**10*31.2(
26
PK α
−
(6)
is index of erosion risk. C
2
does not depend on
vegetation cover structure or other changeable
factors. It is only affected by stable factors (i.e.,
slope, rainfall factor, and soil porosity). Based
on value of C
2
for a specific area, we can
identify the corresponding vegetation cover
structure (C
1
) to protect soil from erosion.
2.3. Spatial Analysis for Defining Required
Area of Protection Forest
The digital maps of elevation and rainfall of
Vietnam are developed in GIS, using Spatial
Analysis in ArcGIS 9.2 software (ESRI, 2008)
[26]. We used these maps to produce a map that
spatially identified erosion risk (C
2
) of
Vietnam. This was compared with the threshold
of vegetation index (C
1
) to generate a map of
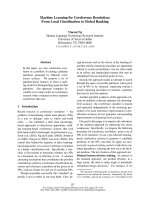
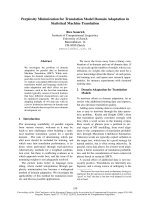
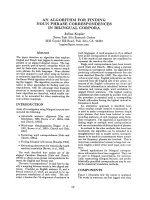
required forest area for erosion protection. Figure
1 indicates the methodology used in the model.
Figure 1. Analytical methodology for defining required forest area.
The explanations of each procedure in the
model will be followed:
(1) Slope data layer was derived from
National Elevation Dataset (DEM)
(2) Calculated average monthly rainfall for
158 meteorological stations in Vietnam, then
spatially interpolated 12 monthly rainfall maps
from these point data. A map of rainfall
erosivity factor (K) for Vietnam was generated
by overlaying 12 monthly rainfall maps based
on a raster calculation in equation (2).
(3) An erosion risk map (C
2
) for Vietnam
was produced from three input layers (i.e.,
porosity, slope, and rainfall erosivity maps), in
which P was assumed to equal 0.4, this is
equivalent to the average porosity of fallow
land following one year of traditional swidden
cultivation (Quynh at al., 1996) [12]. The raster
T.Q. Bao, M.J. Laituri / VNU Journal of Science, Earth Sciences 27 (2011) 63-76
67
calculation for the erosion risk map was based
on equation (6).
(4) From the data of vegetation cover
structures (i.e., canopy closure, ground cover,
litter cover, and height) of previous study
(Quynh et al., 1996) [12], calculate C
1
for
different main cover types in Vietnam (equation
4). Index of vegetation covers (C
1
) are
classified into five classes based on their
relationship with soil loss (Table 1).
Table 1. Classes of vegetation cover structure index
in Vietnam
Cover types C
1
Natural Forests >1.7
Plantation forest, agro-forests 1.3 - 1.7
Industrial plants, fruits 0.9 - 1.3
Agriculture 0.6 - 0.9
(5) Defining required protective forest area
Algorithm of this step is based on a
comparison between actual value of erosion risk
(C
2
) and threshold of vegetation index (C
1
) in
Table 1. An area (a raster cell) is required
natural forest when its C
2
is greater than 1.7
(i.e., C
1
of natural forest). It is required natural
forest, or plantation forest, or agro-forest, when
its C
2
is less than 1.7, but greater than 1.3 (i.e.,
C
1
of plantation forest, agro-forest). These
conditional statements were executed by Map
Algebra functions (i.e., If Then Else) in Spatial
Analyst Tool of ArcGIS 9.2 (Theobald, 2003)
[27]. Total areas of forested cells are required
forest areas for protection soil from erosion in
Vietnam.
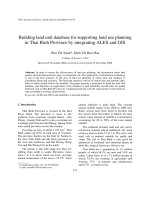
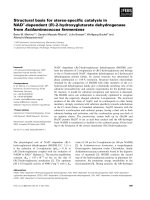
2.4. Rainfall Interpolation
Monthly rainfall maps are interpolated from
30-year averaging rainfall data of 158 weather
stations relative evenly distributed in Vietnam
(Fig. 2). The interpolation method used is
Inverse Distance Weighted (IDW), in which an
unknown point is interpolated from usually
scattered set of known points (Bartier et al.,
1996) [28].
∑
∑
=
=
∧
=
n
i
i
n
i
ii
sZ
sZ
1
1
0
)(
)(
λ
λ
(7)
Where:
Z(s
i
) is rainfall of station i
th
)(
0
sZ
∧
is interpolated rainfall for location s
o
n is number of the nearest stations used for
interpolation, n is chosen equal 3.
λ
i
is weighted value for station i
th
,
2
1
i
i
d
=λ
, where d
i
is distance from location
s
i
to location s
o
.
T.Q. Bao, M.J. Laituri / VNU Journal of Science, Earth Sciences 27 (2011) 63-76
68
Figure 2. Map of Vietnam showing the locations of 158 weather stations in Vietnam.
Legend
Weather Station
Vietnam
0 60 12018024030
Kilometers
T.Q. Bao, M.J. Laituri / VNU Journal of Science, Earth Sciences 27 (2011) 63-76
69
3. Results and analysis
3.1. Rainfall Interpolation and Rainfall Erosivity Factor
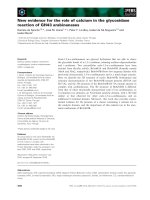
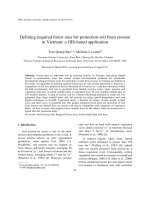
The temporal and spatial distributions of monthly rainfall in Vietnam are illustrated in Figure 3
from January to December.
Jan. Feb. March April
May June July August.
T.Q. Bao, M.J. Laituri / VNU Journal of Science, Earth Sciences 27 (2011) 63-76
70
Sept. Oct. Nov. Dec.
Figure 3. Interpolated average monthly rainfall for Vietnam.
As shown in Figure 3, average annual
rainfall varies dramatically ranging
approximately from 1000mm in Nha Ho to
4000mm in Bac Quang. The rainfall is
unevenly spatio-temporally distributed. The
variation of rainfall is the main cause of
droughts in the dry season and floods in the
rainy season. In some areas like Ham Tan, Phan
Thiet there is either no rain for 2-3 months or
very little rainfall. The highest monthly rainfall
occurring in August and September is 900–
1000mm (e.g., Bac Quang, Nam Dong). The
rain season starts from April to October,
particularly from July to December in the
central coastal area. The rainfall in rainy season
accounts for 80% of the total annual rainfall.
T.Q. Bao, M.J. Laituri / VNU Journal of Science, Earth Sciences 27 (2011) 63-76
71
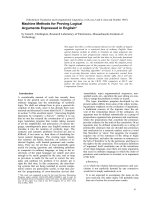
a) b)
Figure 4. Map of slope (a) and rainfall erosivity factor (b).
T.Q. Bao, M.J. Laituri / VNU Journal of Science, Earth Sciences 27 (2011) 63-76
72
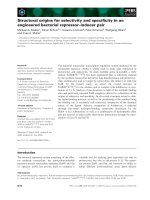
3.2. Erosion Risk and Required Forest Areas
As indicated above, about three fourths of
the total natural land area of Vietnam is covered
by hills and mountains, with a general
downward slope from west to east (Fig. 4a). A
high gradient of slope, together with unevenly
distribution of rainfall erosivity (Fig. 4b),
consequently created a great variability within
erosion risk map of Vietnam (Fig. 5a). The
northwest and central west areas of Vietnam
(red color) have the highest potential to erode
soil. The two large areas having the lowest
erosion risk (blue color) are located in Red
River Delta (northern) and Mekong River Delta
(southern).
(a) (b)
Figure 5. Maps of Vietnam showing (a) erosion risk and (b) required protective forest areas.
T.Q. Bao, M.J. Laituri / VNU Journal of Science, Earth Sciences 27 (2011) 63-76
73
The map of required forest areas for
Vietnam (Fig. 5b) was generated from erosion
risk map in comparison with vegetation index
(inequality 5). Total required forest areas for
protection of soil from erosion for Vietnam are
7,191,436 ha, of which 2,469,497 ha is natural
forest. Fifteen out of 64 provinces do not
require forests for erosion prevention, most are
distributed in the Red and Mekong river deltas.
Provinces requiring high percentages of forest
cover are mainly located in the northwest and
south central of Vietnam.
4. Disscussion
The revised universal soil loss equation
(RUSLE) is an erosion model predicting
longtime average annual soil loss, it is a
powerful tool that is widely used in the United
States and many foreign countries (Renard et
al., 1997) [13]. The RUSLE was developed
initially by Wischmeier and Smith (1965, 1978)
[29] for original use on cropland. It has been
being applied to different land uses (e.g.,
rangeland, forestland). The RUSLE is
expressed as:
A = R * K * L*S * C * P (8)
Where: A = estimated spatial average soil
loss per unit area
R = rainfall-runoff erosivity factor
K = soil erodibility factor
L = slope length factor
S = slope steepness factor
C = cover-management factor
P = support practice factor
The essence of universal soil loss equation
is to isolate each variable and reduce its effect
to a number. Soil loss is predicted by
multiplying the numbers. For a given situation
(e.g., soil type, cover, slope and length) the
value of each factor in the equation is fixed,
which only can be established after it has been
measured (Hudson, 1977) [25]. In Vietnam,
there are limited applications of the RUSLE to
predict erosion from land surface due to a lack
of references to qualitatively assess the factors
for given circumstances. Lung et al. (1995) [21]
has defined factors in the equation (8) for the
Central Highlands, and also identified C factor
for different forest covers in this area (Table 2).
However, there are some disadvantages when
applying this equation to predict soil erosion;
these include: (1) there is no verification for
method used to define factors; (2) vegetation
classifications are not detailed enough; (3) and
experimental plots were designed in a small
range of the factors.
Table 2. An example of USLE factors calculated for
the central highland of Vietnam
Locations R K
a
LS C P
Konhanung 872.5
0.021
1.0
Pleiku 943.3
0.024
2.37 (10
0
)
4.38 (15
0
)
0.0083
b
0.0076
c
1.0
Sources: Lung et al. (1995) [21]
a
K factor for Bazan soil;
b
C factor for
bamboo forest;
c
C factor for grass
These disadvantages are resolved by
applying the erosion prediction equation (1)
used in this study. This equation was
established based on observations of 63 field
plots of different cover types, including natural
forests, plantation forests, orchards, abandoned
land, grazing land and paddy field (Quynh et
al., 1996) [12]. Soil erosion in each plot is
measured and estimated by using the triangle of
three steel poles. In the middle of each pilot
plot, place three steel poles in a triangle form.
The length of each side of the triangle (the
distance from each pole) is 3 m. Each pole is
placed deeply into the soil and left about 20 cm
T.Q. Bao, M.J. Laituri / VNU Journal of Science, Earth Sciences 27 (2011) 63-76
74
higher than the surface of the land. Use a long
plastic durable string to connect the three poles
at the height of 10 cm from the surface, then
measure the distance at 9 points (3 points in
each side of the triangle) from the string to the
surface before and after each rain event to
estimate the thickness of soil layer eroded by
each rain (mm). Soil loss depth was analyzed in
relation to vegetation structures (e.g., height,
canopy closure, ground cover, and litter cover),
slope, and rainfall. The authors have found a
close relationship among these variables (Fig.
8a). They used monthly rainfall as a
replacement of rainfall intensity (Fig. 8b) for
calculation of rainfall erosivity factor. The root
mean squared error (RMSE) of soil loss
prediction by using the equation (1) is about
16%. Recently, the equation has been widely
applied in Vietnam (Quynh et al., 2006) [12].
0
2
4
6
8
10
12
14
16
0 0.5 1 1.5 2
Soil Loss (mm yr
-1
)
(CC/H+GC+LC)
0
2
4
6
8
10
12
0 100 200 300 400 500 600 700
Rainfall Intensity (mm hr
-1
)
Monthly Rainfall (mm)
Figure 6. Bivariate plots of (a) vegetation cover structure (i.e., canopy closure, height,
ground cover, and litter cover) and soil loss (mm yr
-1
), R
2
=0.73; and (b) monthly rainfall (mm)
and rainfall intensity (mm hr
-1
), R
2
=0.78, (Quynh at al., 1999) [30].
5. Conclusions
Soil erosion by water continues to be
serious environmental problems in Vietnam.
The primary objectives of this study were
applying GIS techniques to define required
forest areas for protection soil from erosion in
Vietnam.
Due to difficulties in identifying factors for
Revised Universal Soil Loss Equation (RUSLE)
in Vietnam, the spatially potential soil loss was
predicted by an equation developed by Vietnam
itself, in which soil erosion prediction is a
function of vegetation cover structures, slope,
erosivity rainfall index, and soil porosity. Based
on the selected soil loss equation and the
threshold for soil loss in tropical regions (10 ton
ha
-1
yr
-1
), we have established two criteria to
define required forest area, one is index of
erosion risk (C
2
), the other one is index of
vegetation (C
1
). The map of erosion risk was
interpolated from mean 30-year monthly
rainfall data, slope, and porosity. The index of
vegetation was calculated for main cover types
in Vietnam from available data (i.e., height,
canopy closure, ground cover, and litter cover).
Applying raster analysis techniques in ArcGIS,
the map of required forest areas for soil erosion
prevention was generated from erosion risk map
in comparison with vegetation index. This map
is a spatial distribution of required natural
forests, other forests, or non forests.
T.Q. Bao, M.J. Laituri / VNU Journal of Science, Earth Sciences 27 (2011) 63-76
75
References
[1] R. Lal, Soil degradation by erosion. Land
Degradation & Development, 12 (4) (2001) 519.
[2] D. Pimentel, C. Harvey, P. Resosudarmo,
K.Sinclair, D.Kurz, M.McNair, S.Crist,
L.Shpritz, L.Fitton, R.Saffouri, R.Blair,
Environmental and Economic Costs of Soil
Erosion and Conservation Benefits. Science, 267
(1995) 1117.
[3] D. Pimentel, N. Kounang, Ecology of Soil
Erosion in Ecosystems. Ecosystems, 1 (5),
(1998) 416.
[4] D.E. Walling, B.W.Webb, Patterns of Sediment
Yield. In Morgan, R.P.C. (3rd ed.), Soil Erosion
and Conservation, Blackwell Publishing, 1983,
pp. 1-10.
[5] R.P.C. Morgan, Soil Erosion and Conservation.
Third Edition, Blackwell Publishing, 2005.
[6] R.C Sidle, A.D. Ziegler, J.N. Negishi, A.R. Nik,
R.Siew, F. Turkelboom, Erosion processes in
steep terrain-Truths, myths, and uncertainties
related to forest management in Southeast Asia.
Forest Ecology and Management 224 (2006)
199.
[7] S.D. Angima, D.E. Stott, O’Neill, M.K., Ong,
C.K., Weesies, G.A , Soil erosion prediction
using RUSLE for central Kenyan highland
conditions. Agriculture Ecosystems and
Environment 97(2003) 295.
[8] W.H. Wischmeier, D.D. Smith, Predicting
rainfall erosion soil losses from cropland east of
the Rocky Mountain: A guide for selection of
practices for soil and water conservation. USDA,
Agriculture Handbook, 1965, No. 282.
[9] R.P.C. Morgan, D.D.V. Morgan, H.J. Finney, A
predictive model for the assessment of soil
erosion risk. Journal of Agricultural
Engineering Research 30 (1984) 245.
[10] R.P.C. Morgan, A Simple Approach to Soil Loss
Prediction: A Revised Morgan-Morgan-Finney
Model. Catena 44 (2001) 305.
[11] D.A. Woolhiser, R.E. Smith, D.C. Goodrich, ,
KINEROS: a kinematic runoff and erosion
model: documentation and user manual. USDA
Agricultural Research Service ARS-77, 1990.
[12] V.V. Quynh, N.N. Lan, Capability to protect soil
of different vegetation covers in Ham Yen, Tuyen
Quang. Report for Vietnam - Swedish
Cooperation Program, SIDA, 1996.
[13] K.G. Renard, G.R. Foster, G.A. Weesies, D.K.
McCool, D.C. Yoder, Prediction soil erosion by
water: A guide to conservation planning with the
revised universal soil loss equation (RUSLE).
USDA, Agriculture HandBook, No. 703. (1997)
[14] D. Lu, G. Li, Valladares, G.S., and Batistella,
M., Mapping soil erosion risk in Rondônia,
Brazilian Amazonia: using RUSLE, remote
sensing and GIS. Land Degradation and
Development 15 (2004.) 499.
[15] A. Yuksel, R. Gundogan, A.E. Akay, Using the
Remote Sensing and GIS Technology for
Erosion Risk Mapping of Kartalkaya Dam
Watershed in Kahramanmaras, Turkey. Sensors,
8 (2008) 4851.
[16] G. Wang, G. Goerge, S. Fang, A. Alan, Mapping
multiple variables for predicting soil loss by
geostatistical methods with TM images and a
slope map. Photogrammetric engineering and
remote sensing, 69 (8) (2003) 889.
[17] Y.L. Bissonnais, C. Montier, M. Jamagne, J.
Daroussin, D. King, Mapping Erosion Risk for
Cultivated Soil in France. Catena 46 (2001) 207.
[18] A. Lufafa, M.M. Tenywa, M. Isabirye, M.J.G.
Majaliwa, P.L. Woomer, Prediction of Soil
Erosion in a Lae Victoria Basin Catchment using
a GIS-based Universal Soil Loss Model.
Agricultural Systems 76 (2002) 883.
[19] R.B. Kheir, O. Cerdan, C. Abdallah, Regional
Soil Erosion Risk Mapping in Lebanon.
Geomophology, 82, 347 (2006)359.
[20] X.Y. Qing, S.X. Mei, K.X. Bin, P. Jian, C.Y.
Long, Adapting the RUSLE and GIS to Model
Soil Erosion Risk in a Mountains Karst
Watershed, Gouzhou Province, China.
Environmental Monitoring and Assessement,
141 (2008) 275.
[21] N.N. Lung, V.D. Hai, Research on scientific
foundation of technical economic solutions for
planning and designing watershed, upstream
protective forests, and coastal mitigating storm
forests. Report for National Project No. K03-09,
Ha Noi, 1995.
[22] P.V. Dien, Water retention capability of some
vegetation types in protection areas of Hoa Binh
hydropower plant. Ph.D Dissertation, Forestry
University, Vietnam, 2006.
[23] FPD, 2008. Vietnam Annual Forest Cover, 2007.
Forest Protection Department (FPD), Ministry
of Agriculture and Rural Development,
T.Q. Bao, M.J. Laituri / VNU Journal of Science, Earth Sciences 27 (2011) 63-76
76
[24] VEPA, 2006. Environmental Report of Vietnam,
2006. Vietnam Environment Protection Agency.
[25] N.W. Hudson, Soil Conservation. Cornell
University Press, Ithaca, New York, 1977.
[26] ESRI, 2008. ArcGIS Spatial Analysis,
www.esri.com/spatialanalyst.
[27] D.M. Theobald, GIS Concepts and ArcGIS
Methods. 1st Edition, Conservation and Planning
Technologies Publisher, USA. 2003, pp. 238-
266.
[28] P.M. Bartier, C.P. Keller, Multivariate
interpolation to incorporate thematic surface data
using inverse distance weighting (IDW).
Computers and Geosciences 22 (7) (1996) 795.
[29] W.H. Wischmeier, D.D. Smith, Predicting
rainfall erosion soil losses: A guide to
conservation planning. USDA, Agriculture
Handbook, 1978, No. 537.
[30] V.V. Quynh, N.H. Tuat, H.Q. Khai, Forest
Criteria for Soil Conservation. Report for
Project Funded by Ministry of Agriculture and
Rural Development, 1999.