Selected Elements and Organic Chemicals in Streambed Sediment in the Salem Area, Oregon, 1999 pot
Bạn đang xem bản rút gọn của tài liệu. Xem và tải ngay bản đầy đủ của tài liệu tại đây (1.66 MB, 50 trang )
U.S. Department of the Interior
U.S. Geological Survey
Selected Elements and
Organic Chemicals in
Streambed Sediment in the
Salem Area, Oregon, 1999
Water-Resources Investigations Report 02–4194
Prepared in cooperation with
the City of Salem
COVER PHOTOGRAPHS:
Left: Gibson Creek near mouth, looking north.
Upper: Glenn Creek upstream from Gibson Creek, looking north.
Lower: Mill Creek upstream from Mill Race, looking east.
U.S. Department of the Interior
U.S. Geological Survey
Selected Elements and Organic Chemicals
in Streambed Sediment in the Salem Area,
Oregon, 1999
By DWIGHT Q. TANNER
Water-Resources Investigations Report 02–4194
Prepared in cooperation with
The City of Salem
Portland, Oregon
2002
U. S. DEPARTMENT OF THE INTERIOR
GALE A. NORTON, Secretary
U.S. GEOLOGICAL SURVEY
CHARLES G. GROAT, Director
The use of trade, product, or firm names in this publication is for
descriptive purposes only and does not imply endorsement by
the U.S. Government.
____________________________________________________________________________
For additional information: Copies of this report may be
purchased from:
District Chief
U.S. Geological Survey USGS Information Services
10615 S.E. Cherry Blossom Dr. Box 25286, Federal Center
Portland, OR 97216-3159 Denver, CO 80225-0286
E-mail: Telephone: 1-888-ASK-USGS
Internet:
Suggested citation:
Tanner, D.Q., 2002, Selected elements and organic chemicals in streambed sediment in the Salem Area,
Oregon, 1999: U.S. Geological Survey Water-Resources Investigations Report 02–4194, 43 p.
iii
CONTENTS
Abstract 1
Introduction 1
Background, Purpose, and Scope 2
Acknowledgments 3
Study Design and Methods 3
Sample Collection and Processing 5
Chemical Analyses 5
Quality Assurance 5
Data Analysis 10
Comparisons to guidelines and other data 10
Statistical and Graphical Methods 13
Results 14
Elements in Streambed Sediment 14
Organic Chemicals in Streambed Sediment 14
Implications for Future Monitoring and Site-Specific Findings 17
Clark Creek 19
East Fork of Pringle Creek 19
Summary 21
References Cited 25
Appendix A. Streambed Sediment Data—Concentrations of Elements and Organic Chemicals in Streambed
Sediment Samples, Salem area, Oregon, 1999 29
Appendix B. Streambed Sediment Data—Streambed Sediment Quality Assurance Data, Salem area, Oregon,
1999 39
FIGURES
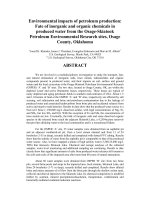
Figure 1. Map of streambed sediment sampling site locations and land use, Salem area,
Oregon 4
Figure 2. Comparison of concentrations of elements in streambed sediment samples from
the Salem area with Willamette Basin concentrations, nationwide concentrations,
and sediment quality guidelines and nationwide data are from 1992 to 1997 18
Figure 3. Comparison of concentrations of organic chemicals in streambed sediment samples
from the Salem area with Willamette Basin concentrations, nationwide concentrations,
and sediment quality guidelines 20
TABLES
Table 1. Sampling site summary and land use, Salem area, Oregon, 1999 3
Table 2. Elements and compounds analyzed in streambed sediment samples, Salem area,
Oregon, 1999 6
Table 3. Relative percent differences of selected elements in split samples 11
Table 4. Relative percent differences of selected organic chemicals in split samples 11
Table 5. Comparison of surrogate recoveries for spiked environmental samples and spiked test solutions 11
Table 6. Guidelines for elements in streambed sediments 12
Table 7. Guidelines for organic chemicals in streambed sediments 13
Table 8. Summary statistics for element concentrations in streambed sediment samples, Salem area,
Oregon, 1999 15
Table 9. Exceedances of streambed sediment guidelines, Salem area, Oregon, 1999 16
Table10. Elements and organic chemicals with concentrations positively correlated with the
percentage of urban land use in the contributing basin 17
Table11. Summary statistics for organic chemical concentrations in streambed sediment samples,
Salem area, Oregon, 1999 22
iv
CONVERSION FACTORS, VERTICAL DATUM, AND ABBREVIATIONS
1
Temperature °F = 1.8 (Temperature °C) + 32.
ABBREVIATIONS
Certain measurements used in this report are given only in metric units:
mL, milliliter
mm, millimeter
µm, micrometer
g, gram
mg/L, milligrams per liter
µg/g, micrograms per gram
µg/kg, micrograms per kilogram
Multiply By To obtain
feet 0.3048 meters
miles 1.609 kilometers
square miles 12.590 square kilometers
degrees Fahrenheit (°F)
1
degrees Celsius (°C)
1
Selected Elements and Organic Chemicals
in Streambed Sediment in the Salem Area,
Oregon, 1999
By Dwight Q. Tanner
Abstract
Analysis of streambed sediments in the
Salem, Oregon, area showed anomalously large
concentrations of some elements and organic
chemicals, indicating contamination from
anthropogenic and/or geologic sources. The
streambed sediment sample from Clark Creek, an
urban basin, had large concentrations of polycyclic
aromatic hyrdocarbons (PAHs), organochlorines,
cadmium, lead, and zinc. The sample from the
East Fork of Pringle Creek, which is a mostly
urban basin, had the highest concentrations
of DDD, DDE, and DDT compounds. Aldrin was
detected in streambed sediment at only one site, the
East Fork of Pringle Creek. Ten of the 14 sites
sampled had exceedances of the sediment quality
guidelines of the Canadian Council of Ministers of
the Environment (CCME), and 8 sites had
exceedances of guidelines from the Puget Sound
Dredged Disposal Analysis (PSDDA) Program.
Trace element concentrations in the Salem
area generally were similar to those found
previously in the Willamette Basin and nationally.
However, cadmium, lead, and zinc concentrations
were larger in the sample from Clark Creek than for
largest value for Willamette Basin data from earlier
studies. Zinc concentrations in the sample from
Clark Creek exceeded sediment quality guidelines
from the CCME and PSDDA.
p,p’-DDE, which is a persistent breakdown
product of the banned organochlorine-insecticide,
DDT, was detected at all sites. Total DDT (the sum
of p,p’-DDD, p,p’-DDE, and p,p’-DDT)
concentrations exceeded the PSDDA screening
level at eight sites and exceeded twice the PSDDA
maximum level at the East Fork of Pringle Creek.
Cis- and trans-chlordanes were detected at about
80% of the sites. The concentration of total
chlordane for the sample at Clark Creek was larger
than for any sample from previous Willamette
Basin studies. The largest concentration of dieldrin
also was from the sample at Clark Creek, which
was the only site that exceeded the CCME
guideline for dieldrin.
The high levels of contaminants in some
Salem-area streams indicates the need for further
study to assess the biological effects of these
contaminants. Future monitoring in the Salem area
could include bioassays using benthic invertebrates
and the measurement of organochlorine
compounds, including DDT, DDE, DDD, and
dieldrin in fish tissue. Because resident fish may be
consumed by humans and wildlife, fish tissue
analyses would be helpful to determine the health
risk associated with fish consumption.
INTRODUCTION
The mobility and fate of contaminants associated
with streambed sediment depend on the mobility of the
sediment and on the chemical and physical characteris
-
tics of the contaminants. Contaminants may be trans-
ported, deposited, and resuspended in response to
2
different hydrological conditions; some can also disso-
ciate from the sediment and be transported in the dis-
solved phase. The two main reasons for analyzing the
streambed sediment for trace elements and hydropho
-
bic (water avoiding) organic chemicals are that (1)
fine-grained particles and organic matter are accumula
-
tors of trace elements and hydrophobic organic chemi-
cals, and (2) streambed sediments in depositional
environments provide a time-integrated sample of
intermittent or storm-related contaminants. The analy
-
sis of streambed sediments is also useful for consider-
ing potential biological impacts (Kennicutt and others,
1994).
Major elements such as iron, aluminum, calcium,
magnesium, and potassium occur naturally in the rocks
and minerals in a watershed and therefore are present
in streambed sediment. Minor, or trace, elements also
occur naturally, but at smaller concentrations than
major elements. Trace elements generally are consid
-
ered to be elements that occur dissolved in natural
waters at concentrations less than 1.0 mg/L (milligrams
per liter) (Hem, 1992, p. 129). Natural sources of ele
-
ments include the dissolution and disaggregation of
soils and geologic materials. Human-induced sources
include agriculture, mining, manufacturing, municipal
waste, urban runoff, and the burning of fossil fuels.
Some trace elements are beneficial or essential to
plants and animals in small concentrations, yet are
toxic in large concentrations.
The organic chemicals studied in this report are
predominantly from anthropogenic sources, and their
presence in the environment has increased with the
production and widespread use of these chemicals.
Organochlorine pesticides were some of the first
organic pesticides developed, but their production has
decreased because their use has become regulated or
banned in the United States. The agricultural uses of
chlordane, dieldrin, and dichlorodiphenyltrichloroet
-
hane (DDT) were banned in the early 1970s (U.S.
Environmental Protection Agency, 1985), but chlor
-
dane was used for termite control until the late 1980s.
Organochlorine pesticides have a low solubility in
water and a high environmental persistence (Wit
-
kowski and others, 1987).
Polychlorinated biphenyls (PCBs) are synthetic
compounds that were widely used in electrical trans
-
formers in the 1960s and 1970s, but PCBs were banned
in 1979. Like organochlorine pesticides, PCBs are
almost insoluble in water and persist in the environ
-
ment, so they can become concentrated in streambed
sediment.
Polycyclic aromatic hydrocarbons (PAHs) also
have low water solubilities and partition into the
organic matter in streambed sediments. PAHs are pro
-
duced by fuel spills, waste incineration, and fossil fuel
combustion. Several are carcinogens or mutagens
(Smith and others, 1988). PAHs generally are persis
-
tent in the environment.
Phthalates are used as plasticizers in the manu-
facture of materials such as polyvinyl chloride,
polypropylene, and polystyrene. Phthalates can accu
-
mulate in sediment particles and bioaccumulate in the
lipid reservoirs of organisms. Laboratory contamina
-
tion during the analysis of phthalates has been docu-
mented in the past (Lopes and Furlong, 2001) because
of the widespread use of plastics in modern laborato
-
ries. Some phthalates are suspected carcinogens.
Background, Purpose, and Scope
Salem is the capital of Oregon, as well as its third
largest city, with a population of 131,385 in 2000
(Portland State University, 2001). Salem is located
centrally in the Willamette Valley, a fertile and agricul
-
turally productive region. Land use in the Salem area is
diverse, including large amounts of urban, industrial,
residential, and agricultural activities that can impact
surface-water quality.
Water quality is important because Salem-area
streams support salmonid fish rearing and spawning,
resident fish and aquatic life, water contact recreation,
aesthetic quality, and water supply. The following
three creeks in the study area were listed in 1998 by the
Oregon Department of Environmental Quality as being
water-quality limited: Mill Creek (for fecal-indicator
bacteria and temperature), Clark Creek (for bacteria)
and Pringle Creek (for dieldrin, an organochlorine
insecticide, and for bacteria and temperature), (Oregon
Department of Environmental Quality, 2001).
In 1999, the U.S. Geological Survey (USGS)
entered into a cooperative agreement with the City of
Salem, Oregon, to (1) assess the occurrence and con
-
centrations of selected elements and organic chemicals
in streambed sediments from the Salem area, (2) com
-
pare Salem-area concentrations to published screening
values for the protection of aquatic life, (3) compare
Salem-area concentrations to those in streambed
sediments in the Willamette Basin and nationwide, and
3
(4) identify contaminant patterns that would help man-
agers make decisions regarding future activities in
monitoring and pollution control. This report contains
data and interpretations concerning elements and
organic chemicals from 16 streambed sediment sam
-
ples that were collected from 14 sites on small streams
in the Salem area during October 6-20, 1999 (low-flow
conditions). Additionally, land use data were gathered
from several sources to produce a geographic informa
-
tion system (GIS) coverage to compute the land use
percentages for the contributing drainage area for each
site.
Acknowledgments
The author acknowledges the City of Salem Pub-
lic Works Department for cooperative funding and
Jeanne Miller, City of Salem, for logistical assistance.
Frank Rinella (USGS) oriented the field group on
streambed sediment studies and gave instruction on
sampling techniques, as well as helping interpret the
results. Steve Rodgers (USGScontractor), and Jim
Gengler and Bill Fear (both of the City of Salem) col-
lected and processed the streambed sediment samples.
Bernie Bonn (Clean Water Services, Hillsboro, Oregon,
and formerly of the USGS) gave input for preparation
of this report. Tana Haluska (USGS) did the GIS
work, and Ken Skach (USGS) produced the graphics.
STUDY DESIGN AND METHODS
Fourteen sites on streams draining into the Wil-
lamette River and its tributaries in the Salem area were
sampled for streambed sediments (fig. 1). Data from
several sources were compiled into a geographical
information system (GIS) coverage for the study area.
Land use and land cover data were obtained from:
1. City of Salem—Land use data for the area within
the city limits of Salem.
2. Marion County—Zoning data from the county out-
side of Salem city limits.
3. Landsat data—Satellite data classified and inter-
preted for the areas outside of the City of Salem
and Marion County, and north of latitude 44.819
decimal degrees.
4. USGS National Land Use Data—Land use data for
the areas outside of the City of Salem and Marion
County, and south of latitude 44.819 decimal
degrees.
Each site is influenced by an upstream drainage
basin having a different mix of land use categories
(table 1). Land use upstream from the sites at Claggett
Creek, Clark Creek, Pringle Creek, and East Fork of
Pringle Creek is at least 87% urban. The land use of the
contributing basins of the four Mill Creek sites is pre
-
dominantly agricultural (at least 72%). The drainage
basin of Gibson Creek is composed mostly of agricul
-
tural, grassland, and forestland uses. It was not possible
to determine the contributing drainage area of Shelton
Ditch because part of the flow in Shelton Ditch is
diverted from Mill Creek.
Table 1. Sampling site summary and land use, Salem area,
Oregon, 1999
[Map ID (identification) refers to the number on figure 1; , not
calculable; RM, river mile]
Map ID Site name
Drainage
area
(square
miles)
Land use (percent)
Urban
Agri-
cultural
Grass-
land and
forest
14 Battle Creek 10.6 57 43 0
3 Claggett Creek 7.0 100 0 0
8 Clark Creek 2.4 100 0 0
7 Croisan Creek 4.8 53 47 0
12
East Fork of
Pringle Creek
2.7 87 13 0
1 Gibson Creek 5.7 10 64 26
2 Glenn Creek 4.1 45 44 11
4
Mill Creek near
mouth
112.5 26 72 2
10
Mill Creek
upstream from
Mill Race
(RM 2.2)
110.6 25 73 2
11
Mill Creek
upstream from
Shelton Ditch
(RM 3.4)
109.5 24 74 2
13
Mill Creek at
Kuebler Road
(RM 6.4)
105.4 22 76 2
6 Pettyjohn Creek 1.7 49 51 0
9 Pringle Creek 8.8 96 4 0
5 Shelton Ditch
4
Figure 1. Streambed sediment sampling site locations and land use, Salem area, Oregon.
5
5
22
22
22
51
99E
99E
221
213
214
Willamette
River
Mill
Creek
Battle
Glenn
Gibson
Creek
Pringle
Creek
Cr
Creek
Creek
Claggett
Creek
Clark
Creek
C
r
o
i
s
a
n
EXPLANATION
Urban
Agriculture
Grassland/forest
City of Salem
Sampling site—
See table 1
4 MILES
0
2
2
0
4 KILOMETERS
OREGON
Study
area
44˚50'
55'
45˚00'
123˚10' 5' 123˚00' 122˚40'55' 50' 45'
1
2
3
4
6
7
8
5
9
10
11
12
12
13
14
5
Sample Collection and Processing
Streambed sediment samples were collected from
several depositional areas at each site using procedures
described in detail by Shelton and Capel (1994). The
top 1–2 cm of fine-grained sediment was collected with
a Teflon scoop until about 8 liters of wet sediment was
obtained. The subsamples for elemental analysis were
sieved through a 63-µm nylon screen, and the sediment
was placed in polyethylene containers. The subsamples
for the analysis of organic chemicals were sieved
through a 2-mm stainless-steel sieve and stored in glass
containers. Due to program constraints, the samples,
which were collected in October 1999, were not sub
-
mitted for analysis until July 2000. Samples for organic
analysis were stored in a freezer in accordance with
procedures outlined by the USGS National
Water-Quality Laboratory (William R. White, USGS,
written commun., 1999) and samples for elemental
analysis were air dried and stored at room temperature
until analysis as recommended by the USGS Geologic
Discipline Laboratory (Rick Sanzolone, USGS, written
commun., 1999).
Chemical Analyses
Streambed sediment samples were analyzed for
major and trace elements by the USGS Geologic Disci
-
pline Laboratory in Lakewood, Colorado. Organochlo-
rine pesticides, pesticide metabolites, PCBs,
semivolatile organic compounds, and organic carbon
content were analyzed at the USGS National
Water-Quality Laboratory in Lakewood, Colorado.
The sediment size fraction less than 63 µm was ana
-
lyzed by the USGS Cascades Volcano Observatory in
Vancouver, Washington. The analytical methods are
summarized in table 2.
Each analytical method used for quantifying an
element or organic chemical in streambed sediment has
a specific manner in which the solid material was
extracted to produce a liquid which was in turn ana
-
lyzed. A total chemical extraction uses strong acids to
completely dissociate the sediment, whereas another
approach is to use soft extraction techniques that are
operationally defined.
Different designations were used by the laborato-
ries to indicate minimum levels of detection for the dif-
ferent methods. A minimum reporting level (MRL)
was used for elements, organochlorine pesticides, and
PCBs. If a concentration was measured by the labora
-
tory as being less than the MRL or if the concentration
was too small to quantify, the value was reported as a
nondetection. A method detection limit (MDL) was
used for semivolatile compounds, such as PAHs,
phthalates, and phenols. Concentrations less than the
MDL may be reported.
The laboratory used an “E” remark code to iden-
tify an estimated concentration. This code was used
when the identification of a compound was qualita
-
tively confirmed, but the concentration was estimated
because there was greater uncertainty about the mea
-
surement for one of the following reasons:
• The calculated concentration was less than
2xMDL.
• The calculated concentration was less than the low-
est calibration standard.
• The calculated concentration was greater than the
highest calibration standard.
• The concentration was uncertain because of a
matrix interference.
• The concentration was uncertain because the com-
pound was detected in instrument blanks.
The laboratory used an “M” remark code for
some organic chemicals to indicate a compound that
was identified at a low concentration that would round
to zero. An unquantified result of “M” is preferable to
reporting a low concentration value whose uncertainty
is known to be high. Similarly, reporting “M” is prefer
-
able to reporting a value of zero, which could be
inferred to mean “not present” when the analysis indi
-
cated that the compound was present.
Quality Assurance
To ensure the accuracy and precision of the
analysis of the streambed sediment samples, two sam-
ples were split and analyzed. These two quality-
assurance samples, collected at Pringle Creek and
Clark Creek, represent 14% of the sites sampled. At
those sites, the composited samples were sieved as
usual, and then the sieved material was split, or sub
-
sampled. This type of a split sample gives an indication
of the variability due to sample preparation and analy
-
sis, but it does not address the variability due to sample
6
Table 2. Elements and compounds analyzed in streambed sediment samples, Salem area,
Oregon, 1999
[USGS, U.S. Geological Survey; letters identify the analytical method (see footnotes); CAS,
Chemical Abstracts Service registry number; , no CAS number exists for the given analyte. This
table was modified from Bonn, 1999, p. 6–7]
Analyte name(s) Method
USGS
parameter code
CAS
Major elements
aluminum (Al)
a 34790
7429–90–5
calcium (Ca)
a 34830
7440–70–2
iron (Fe)
a 34880
7439–89–6
magnesium (Mg)
a 34900
7439–95–4
phosphorus (P)
a 34935
7723–14–0
potassium (K)
a 34940
7440–09–7
sodium (Na)
a 34960
7440–23–5
sulfur (S)
b 34970
7704–34–9
titanium (Ti)
a 49274
7440–32–6
Minor elements
antimony (Sb)
c 34795
7440–36–0
arsenic (As)
c 34800
7440–38–2
barium (Ba)
a 34805
7440–39–3
beryllium (Be)
a 34810
7440–41–7
bismuth (Bi)
a 34816
7440–69–9
cadmium (Cd)
d 34825
7440–43–9
cerium (Ce)
a 34835
7440–45–1
chromium (Cr)
a 34840
7440–47–3
cobalt (Co)
a 34845
7440–48–4
copper (Cu)
a 34850
7440–50–8
europium (Eu)
a 34855
7440–53–1
gallium (Ga)
a 34860
7440–53–3
gold (Au)
a 34870
7440–57–5
holmium (Ho)
a 34875
7440–60–0
lanthanum (La)
a 34885
7439–91–0
lead (Pb)
a 34890
7439–92–1
lithium (Li)
a 34895
7439–93–2
manganese (Mn)
a 34905
7439–96–5
mercury (Hg)
e 34910
7439–96–5
molybdenum (Mo)
a 34915
7439–98–7
neodymium (Nd)
a 34920
7440–00–8
nickel (Ni)
a 34925
7440–02–0
niobium (Nb)
a 34930
7440–03–1
scandium (Sc)
a 34945
7440–20–2
selenium (Se)
c 34950
7782–49–2
silver (Ag)
d 34955
7440–22–4
strontium (Sr)
a 34965
7440–24–6
tantalum (Ta)
a 34975
7440–25–7
thorium (Th)
f 34980
7440–29–1
tin (Sn)
a 34985
7440–31–5
uranium (U)
f 35000
7440–61–1
vanadium (V)
a 35005
7440–62–2
ytterbium (Yb)
a 35015
7440–64–4
yttrium (Y)
a 35010
7440–65–5
zinc (Zn)
a 35020
7440–66–6
7
Organochlorine pesticides
aldrin
g 49319
309–00–2
cis-chlordane
g 49320
5103–71–9
trans-chlordane
g 49321
5103–74–2
chlorneb (Demosan, Soil fungicide
1823)
g 49322
2675–77–6
dacthal (DCPA,
chlorthaldimethyl)
g 49324
1862–32–1
o,p’-DDD (o,p’-DDT metabolite)
g 49325
53–19–0
p,p’-DDD (p,p’-DDT metabolite)
g 49326
72–54–8
o,p’-DDE (p,p’-DDT metabolite)
g 49327
3424–82–6
p,p’-DDE (o,p’-DDT metabolite)
g 49328
72–55–9
o,p’-DDT
g 49329
789–02–6
p,p’-DDT
g 49330
50–29–3
dieldrin
g 49331
60–57–1
endosulfan I (α-endosulfan,
Thiodan)
g 49332
959–98–8
endrin
g 49335
72–20–8
α-HCH (α-Lindane,
alpha-hexachlorocylohexane,
α-BHC)
g 49338
319–84–6
β-HCH (beta-hexachlor-
cylohexane, β-BHC)
g 49339
319–85–7
γ-HCH (Lindane,
gamma-hexachlorocylohexane,
γ-BHC)
g 49345
58–89–9
heptachlor (Velsicol 104)
g 49341
76–44–8
heptachlor epoxide (heptachlor
metabolite)
g 49342
1024–57–3
isodrin (Compound 711)
g 49344
465–73–6
o,p’-methoxychlor
g 49347
30667–99–3
p,p’-methoxychlor (Marlate)
g 49346
72–43–5
mirex (dechlorane)
g 49348
2385–85–5
cis-nonachlor
g 49316
5103–73–1
trans-nonachlor
g 49317
39765–80–5
oxychlordane
g 49318
27304–13–8
cis-permethrin (Ambush, Astro,
Pounce, Pramex, Pertox,
Ambush-Fog, Kafil, Perthrine,
Picket, Picket-G, Dragnet,
Talcord, Outflank, Stockade,
Elsmin, Coopex, Peregin,
Stomoxin, Stomoxin P, Qamlin,
Corsair, Tornade)
g 49349
61949–76–6
trans-permethrin
(same trade names as for
cis-permethrin)
g 49350
61949–77–7
toxaphene
g 49351
8001–35–2
PAHs (polycyclic aromatic hydrocarbons)
acenaphthene
h 49429
83–32–9
acenaphthylene
h 49428
208–96–8
anthracene
h 49434
120–12–7
benz[a]anthracene
h 49436
56–55–3
Table 2. Elements and compounds analyzed in streambed sediment samples, Salem area,
Oregon, 1999—Continued
[USGS, U.S. Geological Survey; letters identify the analytical method (see footnotes); CAS,
Chemical Abstracts Service registry number; , no CAS number exists for the given analyte. This
table was modified from Bonn, 1999, p. 6–7]
Analyte name(s) Method
USGS
parameter code
CAS
8
PAHs (polycyclic aromatic hydrocarbons)—Continued
benzo[a]pyrene
h 49389
50–32–8
benzo[b]fluoranthene
h 49458
205–99–2
benzo[ghi]perylene
h 49408
191–24–2
benzo[k]fluoranthene
h 49397
207–08–9
chrysene
h 49450
218–01–9
dibenz[a,h]anthracene
h 49461
53–70–3
fluoranthene
h 49466
206–44–0
9H-fluorene
h 49399
86–73–7
indeno[1,2,3-cd]pyrene
h 49390
193–39–5
naphthalene
h 49402
91–20–3
phenanthrene
h 49409
85–01–8
pyrene
h 49387
129–00–0
Alkyl-PAHs
1,2-dimethylnaphthalene
h 49403
573–98–8
1,6-dimethylnaphthalene
h 49404
575–43–9
2,6-dimethylnaphthalene
h 49406
581–42–0
2-ethylnaphthalene
h 49948
939–27–5
1-methyl-9H-fluorene
h 49398
1730–37–6
1-methylphenanthrene
h 49410
832–69–9
1-methylpyrene
h 49388
2381–21–7
2-methylanthracene
h 49435
613–12–7
4,5-methylenephenanthrene
h 49411
203–64–5
2,3,6-trimethylnaphthalene
h 49405
829–26–5
Azaarines
acridine
h 49430
260–94–6
benzo[c]cinnoline
h 49468
230–17–1
2,2’-biquinoline
h 49391
119–91–5
9H-carbazole
h 49449
86–74–8
isoquinoline
h 49394
119–65–3
phenanthridine
h 49393
229–87–8
quinoline
h 49392
91–22–5
Phthalates
bis(2-ethylhexyl)phthalate
h 49426
117–81–7
butylbenzylphthalate
h 49427
85–68–7
diethylphthalate
h 49383
84–66–2
dimethylphthalate
h 49384
131–11–3
di-n-butylphthalate
h 49381
84–74–2
di-n-octylphthalate
h 49382
117–84–0
Phenols
C8-alkylphenol
h 49424
2-chlorophenol
h 49467
95–57–8
4-chloro-3-methylphenol
h 49422
59–50–7
p-cresol
h 49451
106–44–5
3,5-dimethylphenol
h 49421
108–68–9
phenol
h 49413
108–95–2
Table 2. Elements and compounds analyzed in streambed sediment samples, Salem area,
Oregon, 1999—Continued
[USGS, U.S. Geological Survey; letters identify the analytical method (see footnotes); CAS,
Chemical Abstracts Service registry number; , no CAS number exists for the given analyte. This
table was modified from Bonn, 1999, p. 6–7]
Analyte name(s) Method
USGS
parameter code
CAS
9
a
Homogenized bed sediment was digested using a mixture of hydrochloric, nitric, perchloric and
hydrofluoric acids at low temperature. The resulting solution was evaporated to dryness, dissolved in aqua
regia, and analyzed by ICP-AES (inductively coupled plasma/atomic emission spectrometry) (Briggs,
1990).
b
Homogenized bed sediment was analyzed by combustion with infrared absorption detection using an
automated sulfur analyzer (Curry, 1990).
c
Homogenized bed sediment was digested using a mixture of nitric, perchloric and hydrofluoric acids at
105–110°C (degrees Celsius). The resulting solution was analyzed by HG-AAS (hydride generation atomic
absorption spectrophotometry) (Welsch and others, 1990).
d
Homogenized bed sediment was digested with hydrofluoric acid, hydrochloric acid, and hydrogen per-
oxide. The resulting solution was extracted into an organic phase which was analyzed using FAA (flame
atomic absorption spectrometry (O’Leary and Viets, 1986).
e
Homogenized bed sediment was digested using nitric acid and sodium dichromate. Mercury in the
digest was reduced to elemental form and analyzed by continuous-flow CV-AAS (cold-vapor atomic
absorption spectrophotometry) (O’Leary and others, 1990).
f
Homogenized bed sediment was irradiated with neutrons. Delayed neutrons from the sample were
counted (McKown and Knight, 1990).
g
Homogenized bed sediment was Soxhlet extracted. Gel permeation chromatography was used to
remove inorganic sulfur and large natural molecules. The extract was fractionated using alumina/silica
adsorption. The extracts were analyzed by GC-ECD (gas chromatography with electron capture detection)
(Foreman and others, 1995).
h
Homogenized bed sediment was Soxhlet extracted. Gel permeation chromatography was used to
remove inorganic sulfur and large natural molecules. The extract was analyzed by GC-MS (gas chromatog
-
raphy with mass spectrometry) (Furlong and others, 1996).
Chlorinated aromatic compounds
2-chloronaphthalene
h 49407
91–58–7
1,2-dichlorobenzene
h 49439
95–50–1
1,3-dichlorobenzene
h 49441
541–73–1
1,4-dichlorobenzene
h 49442
106–46–7
hexachlorobenzene
g 49343
118–74–1
pentachloroanisole
g 49460
1827–21–4
pentachloronitrobenzene
h 49446
82–68–5
polychlorinated biphenyls
(total-PCB)
g 49459
1,2,4-trichlorobenzene
h 49438
120–82–1
Other
anthraquinone
h 49437
84–65–1
azobenzene
h 49443
103–33–3
bis(2-chloroethoxy)methane
h 49401
111–91–1
4-bromophenyl-phenylether
h 49454
101–55–3
4-chlorophenyl-phenylether
h 49455
7005–72–3
dibenzothiophene
h 49452
132–65–0
2,4-dinitrotoluene
h 49395
121–14–2
isophorone
h 49400
78–79–1
nitrobenzene
h 49444
98–95–3
N-nitrosodiphenylamine
h 49433
86–30–6
N-nitrosodi-n-propylamine
h 49431
621–64–7
Table 2. Elements and compounds analyzed in streambed sediment samples, Salem area,
Oregon, 1999—Continued
[USGS, U.S. Geological Survey; letters identify the analytical method (see footnotes); CAS,
Chemical Abstracts Service registry number; , no CAS number exists for the given analyte. This
table was modified from Bonn, 1999, p. 6–7]
Analyte name(s) Method
USGS
parameter code
CAS
10
collection techniques or spatial location within a
reach. The relative percent difference (RPD)
between the sample splits was calculated as:
concentration in one subsample concentration in other subsample–
concentration in one subsample concentration in other subsample+()2⁄
100.×
Results of the split sample analyses are shown in
Appendix B. Of the 45 elements analyzed, 7 had a RPD
for the split of more than 10% (table 3). Many of these
instances were when concentrations were near the
detection limits and therefore variability of the mea
-
surement would be expected to be larger. Relative per-
cent differences were also calculated for the 97 organic
chemicals analyzed for in the split samples; relative
differences larger than 20 percent are shown in table 4.
RPDs were not calculated for concentrations that were
designated as estimated (“E”) by the laboratory. The
organic chemical with the largest relative percent dif
-
ference for the split sample was p-cresol, which was
reported as 1,400 µg/kg (micrograms per kilogram) in
the first sample, and as 660 µg/kg in the split sample
(Appendix B).
As a check of the accuracy of the analytical meth-
ods for organochlorine pesticides and semivolatile
compounds, the liquid extract from each environmental
sample was “spiked” at the laboratory with several sur
-
rogate compounds prior to analysis. These compounds,
which are often deuterated (labelled with deuterium, or
“heavy hydrogen”), are not expected to be present in a
natural environmental sample. The percent recovery of
the surrogate compounds provides an indication of the
overall method performance for that sample. The
recoveries of these surrogates are in table 5 under the
heading “spiked environmental samples.” The same
surrogate organic compounds were analyzed in an
aqueous test solution that also contained known spikes
of the analyte compounds. One test solution spike was
done per set of samples, and the samples from the
present study were from three different sample sets.
These results are listed in table 5 under “spiked test
solutions.” Surrogate recoveries for streambed sedi
-
ment samples in this study were acceptable and were
comparable to typical laboratory performance, indicat
-
ing that matrix interference probably was not a big fac-
tor in these analyses.
Laboratory blanks were also analyzed for each
sample set. At one site, Glenn Creek, the laboratory
blank for butylbenzylphthalate for the sample set indi
-
cated contamination larger than the reporting level
(blank = 75.9 µg/kg).
Data Analysis
Comparisons to guidelines and other data
Evaluating the concentrations of elements and
organic chemicals in streambed sediment involves
comparing those concentrations to sediment quality
guidelines (SQGs) developed by various groups for
freshwater ecosystems. Guidelines are numerical limits
recommended to support and maintain designated uses
of the aquatic environment. Unlike standards (for
drinking water, for example), guidelines are threshold
values that have no legal enforcement or regulatory sta
-
tus. SQGs for streambed sediment can be used as a
starting point for evaluating contaminants of concern
and geographical areas of concern, and for evaluating
the need for further studies into ecosystem health.
Many different SQGs have been developed for
streambed sediment (MacDonald and others, 2000).
Each SQG is based on two components: a particular
type of sample preparation and analysis (which may
involve sieving, digesting, or extracting the sediment
sample) and an evaluation of how measured exceed
-
ances of the SQG would affect freshwater ecosystems,
which can involve field studies or laboratory studies
like the Spiked-Sediment Toxicity Test (MacDonald
and others, 1992). For the present study, SQGs were
selected for each element and organic chemical based
on the type of sample preparation and analysis used
and for compatibility for comparisons to other data sets
in the United States, especially the NAWQA program
(U.S. Geological Survey, 1999). An attempt also was
made to select guidelines that applied to many of the
constituents that were analyzed.
SQGs for comparison to the Salem-area data
were from the Puget Sound Dredged Disposal Analysis
Program (2000) and from the Canadian Council
of Ministers of the Environment (2001). SQGs for
11
.
Table 3. Relative percent differences of selected elements in split samples
Relative percent (%) difference was calculated as [|(concentration A - concentration B)|/ (concentration A + concentration B)/2] x 100%.
Tabled values are those that exceeded 10%. Also given is the average of the two replicate concentrations. The majority of elements
did not have a relative percent difference larger than 10% and, hence, were not included in this table; NE 10%, Relative percent
difference did not exceed 10%; µg/g, micrograms per gram]
Site of replicate Berylium Cadmium Chromium Mercury Nickel Selenium Tantalum Tin
Pringle Creek NE 10%
18.2% at
1.1 µg/g
51.2% at
100 µg/g
18.2% at
0.11 µg/g
32.9% at
40 µg/g NE 10%
66.7% at
2 µg/g NE 10%
Clark Creek
23.5% at
1.7 mg/g NE 10% NE 10%
13.3% at
0.22 µg/g NE 10%
22.2% at
0.4
µg/g NE 10%
15.4% at
6 µg/g
Table 4. Relative percent differences of selected organic chemicals in split samples
[Relative percent difference was calculated as [|(concentration A - concentrationB)|/ (concentration A + concentration B)/2] x 100%. Tabled values are
those that exceeded 20%. Also given is the average of the two replicate concentrations. The majority of organic chemicals did not have a relative percent
difference larger than 20%, and were hence not included in this table. Concentrations that were designated as estimated by the laboratory were not included
in this table. NE 20%, relative percent difference did not exceed 20%; µg/kg, micrograms per kilogram]
Site of
replicate
Benz[a]-
anthracene
Hexachloro-
benzene
Benzo[a]-
pyrene
Benzo[k]-
fluoranthene
Chrysene Fluoranthene p,p’-DDT p-cresol Phenanthrene Pyrene
Pringle
Creek
25.0% at
160 µg/kg
54.6% at
6 µg/kg NE 20% NE 20%
22.2% at
320 µg/kg
36.6% at
470 µg/kg
22.2% at
4 µg/kg NE 20%
23.3%at
220 µg/kg
39.0% at
380 µg/kg
Clark
Creek
27.9% at
820 µg/kg NE 20%
30.8% at
1,000 µg/kg
40.0% at
1,200 µg/kg
22.2% at
1,400 µg/kg
26.1% at
2,300 µg/kg NE 20%
71.8% at
1,000 µg/kg
42.9% at
1,400 µg/kg
27.3% at
2,200 µg/kg
Table 5. Comparison of surrogate recoveries for spiked environmental samples and spiked test solutions
[Means, standard deviations, and ranges all in units of percent recovery; N is the number of samples]
Compound
Spiked environmental samples Spiked test solutions
Mean
Standard
deviation
Range N Mean
Standard
deviation
Range N
GC-ECD Method—Sediment (for organochlorine pesticides and total PCB [polychlorinated biphenyls])
α-HCH-d
6
70 16 54–96 14 59 6 52–63 3
GC-MS Method—Sediment (for semivolatile organic compounds such as PAHs [polycyclic aromatic hydrocarbons], phthalates, and phenols)
2-fluorobiphenyl 58 8 46–68 14 64 3 61–67 3
nitrobenzene-d
5
59 13 44–84 14 63 6 56–67 3
terphenyl-d
14
85 9 66–98 14 83 6 78–91 3
12
elements are shown in table 6 and SQGs for organic
chemicals are shown in table 7. The Puget Sound
Dredged Disposal Analysis Program (PSDDA) is a
joint program of the U.S. Environmental Protection
Agency (USEPA) and the U.S. Army Corps of
Engineers, with the responsibility of regulating
dredged material management activities in the State
of Washington under the Clean Water Act. The
PSDDA guidelines were promulgated by Region 10
of the USEPA (which includes Oregon), and the
guidelines may be applicable to Salem-area streams
in the event that a streambed-sediment cleanup is
carried out (John Malek, USEPA Region 10, oral
commun., 2002). Two PSDDA guidelines are listed
for elements and organic chemicals, the screening
level (SL) and the maximum level (ML), (tables 6
and 7).
The smaller value is the SL, and it identifies the
concentration below which the disposal of dredged
material is expected to have no unacceptable
adverse effects, and therefore further biological
testing of the dredged material would not be
required for unconfined, open-water disposal
(PSDDA, 2000). The larger guideline value is the
maximum level (ML). If one or more chemicals
have concentrations between the SL and the ML,
standard biological testing would be required to
determine the suitability of the material for
disposal. Biological testing involves bioassays
using several species of benthic invertebrates
(PSDDA, 2000). If a single chemical has a
concentration between the ML and twice the ML,
biological testing is needed. Finally, if a single
chemical exceeds twice the ML, there is reason to
believe that the dredged material would be
unacceptable for disposal.
Canadian governmental agencies have based sed-
iment guidelines on the simultaneous effects of several
contaminants on benthic organisms (Persaud and oth
-
ers, 1993). The probable effect level (PEL), an interim
guideline developed by the Canadian Council of Minis
-
ters of the Environment (CCME) (2001), is the concen-
tration above which adverse biological effects are
expected to occur frequently (tables 6 and 7). In other
words, if the PEL is exceeded, it is probable that
aquatic life has been negatively affected. The PELs
were developed based on the total analytical digestion
of streambed sediment, which was the method used in
the present study. However, the PELs were based on
the analysis of an unsieved sediment sample, whereas
the Salem-area samples for elements were sieved, and
only the sediments finer than 63 micrometers in diame
-
ter (wherein element concentrations tend to be larger)
were analyzed. Therefore, comparisons of the Salem
samples to the Canadian PELs for elements may over
-
estimate the adverse effects on aquatic life, which is a
more conservative position. However, if most of the
sediment at a site was finer than 63 micrometers, then
the Canadian PEL would be applied appropriately.
Like the PSDDA guidelines, the CCME PELs
were based on a series of biological tests on benthic
organisms (Canadian Council of Ministers of the Envi
-
ronment, 2001). The PELs are considered to be widely
applicable to streambed sediment samples because they
were developed from tests of actual sediment samples
with varying chemical matrices and particle size com
-
positions. Sediments with constituent concentrations
larger than the PEL are considered to represent signifi
-
cant hazards to aquatic organisms, and followup bio-
logical assessment is recommended according to the
CCME. The biological testing or assessment men
-
tioned by the PSDDA and the CCME guidelines
involve various techniques, including spiked-sediment
bioassays, whole-sediment bioassays, and toxicologi
-
cal tests with specific aquatic invertebrates. Tests using
algae or bacteria have also been developed to evaluate
the resuspension of chemicals into the water column.
Table 6. Guidelines for elements in streambed sediments
[Sediment screening values from PSDDA Guidelines (Puget Sound
Dredged Disposal Analysis Program, 2000) and Canadian Interim Guide-
lines (Canadian Council of Ministers of the Environment, 2001);
indicates that no guideline exist; µg/g, micrograms per gram dry weight]
PSDDA Guideline
Element
Laboratory
minimum
reporting level
(µg/g)
Screening
level
(µg/g)
Maximum
level
(µg/g)
Canadian
Interim
Guideline
probable
effects level
(µg/g)
antimony 0.1 150 200
arsenic .1 57 700 1 7 . 0
cadmium .1 5.1 14 3 . 5
chromium 1 9 0 . 0
copper 1 390 1,300 1 9 7
lead 4 450 1,200 9 1 . 3
mercury .02 .41 2.3 .486
nickel 2 140 370
silver .1 6.1 8.4
zinc 4 410 3,800 3 1 5
13
Table 7. Guidelines for organic chemicals in streambed sediments
[Sediment screening values from PSDDA Guidelines (Puget Sound Dredged Disposal Analysis Program, 2000)
and Canadian Interim Guidelines (Canadian Council of Ministers of the Environment, 2001); indicates that no
guideline exists; µg/kg, microgram per kilogram dry weight]
PSDDA Guideline Canadian Interim
Guideline probable
effects level
(µg/kg)Organic chemical
Screening level
(µg/kg)
Maximum level
(
µg/kg)
Organochlorine pesticides
total chlordane
a
8 . 8 7
dieldrin 10 6 . 6 7
Total DDD
b
8.51
Total DDE
c
6.75
Total DDT
d
6.9 69
endrin 6 2 . 4
γ-HCH (lindane) 10 1 . 3 8
heptachlor 10
heptachlor epoxide 2 . 7 4
Polycyclic aromatic hydrocarbons (PAHs)
acenaphthene 500 2,000
acenaphthylene 560 1,300
anthracene 960 13,000
benz[a]anthracene 1,300 5,100 385
benzo[a]pyrene 1,600 3,600 782
chrysene 1,400 21,000 862
dibenz[a,h]anthracene 230 1,900
fluoranthene 1,700 30,000 2,355
naphthalene 2,100 2,400
phenanthrene 1,500 21,000 515
pyrene 2,600 16,000 875
Phthalates
bis(2-ethylhexyl)phthalate 8,300
butylbenzylphthalate 970
diethylphthalate 1,200
dimethylphthalate 1,400
di-n-butylphthalate 5,100
di-n-octylphthalate 6,200
Phenols
p-cresol 670 3,600
phenol 420 1,200
a
Total chlordane is the sum of cis-chlordane, trans-chlordane, cis-nonachlor, trans-nonachlor,
and oxychlordane.
b
Total DDD is the sum of o,p’-DDD and p,p’-DDD.
c
Total DDE is the sum of o,p’-DDE and p,p’-DDE.
d
Total DDT is the sum of p,p’-DDD, p,p’-DDE, and p,p’-DDT.
The concentrations of elements and organic
chemicals measured in the Salem area were compared
to values reported for the Willamette Basin and also to
a nationwide data set. The Willamette data were col
-
lected by the USGS National Water-Quality Assess-
ment Program (NAWQA) between 1992 and 1995
(Wentz and others, 1998a). The national distribution
contains NAWQA data collected from 52 large river
basins (including the Willamette Basin) between 1992
and 1997 (U.S. Geological Survey, 2002). The sample
collection and processing methods used in the Salem
area study were the same as those used by the
NAWQA program. Therefore, comparisons among
these three data sets should not be affected by differ
-
ences in sampling, processing, or analytical methods.
Statistical and Graphical Methods
Nonparametric statistics were used in this report.
Such procedures are useful when data are not normally
14
distributed, which is a common occurrence with
water-quality data. Pairwise correlations were per
-
formed among concentrations of elements and organic
chemicals, and land use percentages using the Spear
-
man rank technique. The hypothesis of these correla-
tions was that the concentration of a constituent may be
related to the percentage of a category of land use in
the drainage basin upstream of a particular sampling
site. For instance, sites with high percentages of urban
land use might be expected to have higher concentra
-
tions of certain constituents related to anthropogenic
effects.
The correlations were two-sided, that is, there
was no expectation of a positive or negative correla
-
tion, and the alternative hypothesis was that Spear-
man’s rho was not equal to zero. For the correlations,
values of 0.5 times the detection limit (MRL or MDL)
were substituted for nondetections. In cases where
there were nondetections at a concentration larger than
the usual detection limit, a value of 0.5 times the usual,
lower detection limit was used. Estimated values were
not treated differently from other values in the statisti
-
cal analyses.
For graphical presentations in this report, esti-
mated values were treated the same as values that were
not estimated, but nondetections were not represented
on the graph. For graphical presentations, and for test
-
ing for the exceedance of screening values, the non-
rounded values were used, even though the rounded
values are reported in the data tables in this report. For
“M” coded values that would have rounded to zero, the
nonrounded value was used.
RESULTS
Elements in Streambed Sediment
Summary statistics for concentrations of ele-
ments in streambed sediment are given in table 8. Sev-
eral elements—antimony, cadmium, cobalt, copper,
lead, manganese, mercury, nickel, selenium, silver, and
zinc—can be considered to be enriched, because their
concentrations were larger than established break-point
concentrations (table 8). These break-points were
based on discontinuities in the normal probability plots
of elements in streambed sediment in the Willamette
River Basin (Rinella, 1998). Break-points for elements
indicate the boundary between two statistical popula-
tions—lower concentrations that can be considered not
enriched and larger concentrations that can be consid
-
ered to be enriched. Since the elements are naturally
occurring, the finding of enrichment by this method
does not distinguish between effects due to enriched
geological sources and anthropogenic effects. At 8 of
the 14 sites, lead concentrations were larger than the
break-point concentration. Concentrations of cadmium
and lead for the sample from Clark Creek were 5 times
larger than the respective break-points.
Sediment quality guidelines were exceeded for
two elements: lead and zinc (table 9). Zinc concentra
-
tions in the sample from Clark Creek exceeded both the
PSDDA screening level guideline and the Canadian
interim PEL guideline. The drainage basins above
Clark Creek and Claggett Creek are 100 percent urban
land use, and both sites had exceedances of guidelines
for lead and zinc. The urban land use category includes
industrial uses, so this is consistent with the findings of
a previous study, in which large concentrations of lead
and zinc in streambed sediment were associated with
industrial areas (Forstner and Wittmann, 1979).
The concentrations of several elements were
positively correlated with the percentage of a given
land use in the drainage basin upstream from the sam
-
pling site. The basin percentage of urban land use was
correlated positively (probability value less than 0.05)
with: antimony, cadmium, chromium, copper, lead,
magnesium, mercury, molybdenum, nickel, phospho
-
rus, silver, sulfur, and zinc (table 10). These correla-
tions probably are due to the anthropogenic activities
affecting the air and water quality in urban areas.
Trace element concentrations in Salem-area
streambed sediments were similar to those found in
Willamette Basin streambed sediment and nationally
(fig. 2). However, cadmium, lead, and zinc concentra
-
tions were larger in the sample from Clark Creek than
for largest value for Willamette Basin data. This fact is
probably due to the presence of predominately urban
land use in the Clark Creek area.
Organic Chemicals in Streambed Sediment
Several organochlorine compounds were detected
in Salem area streambed sediments (table 11). When
organochlorines were detected, concentrations gener
-
ally were similar to those measured elsewhere in the
Willamette Basin and the Nation (fig. 3). The only
15
Table 8. Summary statistics for element concentrations in streambed sediment samples, Salem area, Oregon, 1999
[Concentrations of major elements in milligrams per gram (mg/g); minor elements in micrograms per gram (µg/g); all concentrations are expressed on a dry
weight basis and are given one or two significant digits. Break-point concentrations are based on Rinella, 1998.
The following elements were not detected in
streambed sediment samples: bismuth, gold, and thallium
]
Element Minimum 25th percentile Median 75th percentile Maximum
Willamette River
Basin break-point
concentration
(if available)
Number of
samples
exceeding
break-point
concentration
Major elements (mg/g)
aluminum 72 79 80 83 100
calcium 5 11 12 13 16
iron 50 51 53 59 92
magnesium 3.2 6 6.5 6.8 8.5
phosphorus 1.1 1.3 1.5 1.6 1.9
potassium 4.1 7.3 9.0 11 14
sodium 3.2 8.8 9.0 10.0 12
sulfur < .5 .6 .7 .8 1.3
titanium 6.8 8.6 9.2 9.9 18
Minor elements (µg/g)
antimony .6 .6 .6 1.1 2.2 1.3 2
arsenic 4.2 4.8 5.1 5.4 7.6 10 0
barium 420 420 540 600 670
beryllium 1.4 1.5 1.7 1.8 2.1
cadmium .1 .2 .3 .6 3.2 .5 5
cerium 61 65 68 75 81
chromium 66 71 73 76 88 100 0
cobalt 20 22 24 28 43 30 3
copper 31 40 45 56 93 50 5
europium 1.5 1.8 2.0 2.4 2.6
gallium 16 17 18 19 26
holmium < 1 < 1 1 1 1
lanthanum 29 31 35 38 46
lead 21 28 38 84 160 30 8
lithium 21 24 25 26 26
manganese 900 1,200 1,400 1,800 2,900 1,400 6
mercury .05 .05 .06 .12 .21 .11 5
molybdenum .7 .8 .9 1.3 1.8
neodymium 30 31 36 42 48
nickel 23 28 30 32 46 30 7
niobium 13 14 16 18 24
scandium 19 22 23 24 39
selenium .2 .3 .3 .4 .8 .35 6
silver .2 .2 .2 .3 .4 .3 1
strontium 97 200 200 220 250
tantalum 1.2 1.2 1.4 1.5 2
thorium 6 6 7 8 9
tin 2.7 3.1 3.4 4.2 9.9
uranium 1.8 1.8 2.0 2.2 2.6
vanadium 160 170 180 200 360
yttrium 27 31 38 43 49
ytterbium 2.5 2.8 3.4 3.9 4.3
zinc 140 150 180 310 500 200 6
16
Table 9. Exceedances of streambed sediment guidelines, Salem area, Oregon, 1999
[Symbol meanings are as follows: ●, exceeds Puget Sound Dredged Disposal Analysis (PSDDA) Screening Level guideline
(Puget Sound Dredged Disposal Analysis Program, 2000);
•, exceeds Canadian Interim Probable Effects Level guideline
(Canadian Council of Ministers of the Environment, 2001); , indicates that there was no exceedance for the constituent at that site]
Elements Organochlorines
Polycyclic aromatic hydrocarbons
and other compounds
Site
lead
zinc
total chlordane
a
dieldrin
To t a l DDD
b
To t a l DDE
c
To t a l DDT
d
benz[a ]anthracene
benzo[a ]pyrene
chrysene
fluoranthene
phenanthrene
pyrene
p-cresol
Claggett Creek
• • •
●
Clark Creek
• ●• • •
● • • • ● • • ●
East of Fork Pringle Creek
• •
• • ●
e
Gibson Creek
• ●
Glenn Creek
• • ●
Mill Creek near mouth
•
• ●
Mill Creek upstream from Shelton ditch
•
Pettyjohn Creek
•
• ●
●
Pringle Creek
• •
• • ●
Shelton Ditch
•
● ●• •
a
Total chlordane is the sum of cis-chlordane, trans-chlordane, cis-nonachlor, trans-nonachlor, and oxychlordane.
b
Total DDD is the sum of o,p’-DDD and p,p’-DDD.
c
Total DDE is the sum of o,p’-DDE and p,p’-DDE.
d
Total DDT is the sum of p,p’-DDD, p,p’-DDE, and p,p’-DDT.
e
Also exceeded the PSDDA maximum level guideline.
Note. For the following sites, no exceedances were observed: Battle Creek, Croisan Creek, Mill Creek upstream from Mill Race, and
Mill Creek at Kuebler Road.
The following elements and compounds were detected in sediment at least once, but concentrations never exceeded PSDDA or CCME
guidelines: antimony, arsenic, cadmium, chromium, copper, mercury, nickel, silver, acenaphthene, acenaphthylene, anthracene,
benzo[ghi]perylene, dibenz[a,h]anthracene, 9H-fluorene, ideno[1,2,3-cd]pyrene, bis(2-ethylhexyl)phthalate, butylbenzylphthalate,
diethylphthalate, dimethylphthalate, di-n-butylphthalate, di-n-octylphthalate, phenol, hexachlorobenzene, total PCB, and N-nitroso
-
diphenylamine.
The following compounds have PSDDA or CCME guidelines, and were not detected in sediment: endrin, γ-HCH (lindane), hep-
tachlor, heptachlor epoxide, naphthalene, 1,2-dichlorobenzene, 1,3-dichlorobenzene, 1,4-dichlorobenzene, and 1,2,4-trichlorobenzene.
exception was for total chlordane, which is the
sum of cis- and trans-chlordane, cis- and
trans-nonachlor, and oxychlordane. The
concentration of total chlordane at Clark Creek
was larger than in any sample from the Willamette
Basin study. The Canadian interim PEL screening
value for total chlordane was exceeded at six sites
(table 9). Individual chlordanes (including cis- and
trans-chlordane and cis- and trans-nonachlor, and
oxychlordane) were detected at about 80% of the
sites.
The most commonly detected organochlorine
was p,p’-DDE, which was detected at all of the sites.
This compound is a breakdown product (metabolite)
of the insecticide DDT, which was banned from use in
the United States in 1972. The fact that it was detected
at each Salem-area site demonstrates the persistence of
this family of compounds in the environment. Total
DDT (the sum of p,p’-DDD, p,p’-DDE, and
p,p’-DDT) concentrations exceeded the PSDDA
screening level at eight sites, and exceeded twice the
maximum level at the East Fork of Pringle Creek
(fig. 3 and table 9).
None of the DDE, DDD, or DDT compounds
were correlated with the percentage of any particular
land use. At some locations in the Salem area, the land
use has changed from agricultural to urban, so it is
17
Table 10. Elements and organic chemicals with concentrations positively correlated with the percentage of urban land use
in the contributing basin
[The statistical test was the Spearman’s rank test, at a probability level of 0.05 or less. There were no significant positive correlations with agricultural
or grassland and forest land uses; PAHs, polycyclic aromatic hydrocarbons]
Elements
Organochlorine
pesticides
PAHs Alkyl-PAHs Phthalates Other
antimony dieldrin acenaphthylene 1-methylpyrene butylbenzylphthalate anthraquinone
cadmium anthracene 4,5-methyle-
nephenanthrene
diethylphthalate
di-n-octylphthalate
dibenzothiophene
total PCBs
chromium benz[a]anthracene
copper benzo[a]pyrene
lead benzo[b]fluoranthene
magnesium benzo[ghi]perylene
mercury benzo[k]fluoranthene
molybdenum chrysene
nickel fluoranthene
phosphorus indeno[1,2,3-cd]pyrene
silver phenanthrene
sulfur pyrene
zinc
possible that organochlorine pesticides are
associated now with land that was agricultural
when these pesticides were in use. Concentrations
of total DDE (o,p’-DDE plus p,p’-DDE) exceeded
the Canadian interim PEL screening value at six
sites (table 9). Dieldrin concentrations were
positively correlated with percentage of urban land
use (table 10), and the largest concentration was at
Clark Creek, the only site that exceeded the
Canadian Interim Guideline for dieldrin.
The most commonly detected semivolatile com-
pounds were PAHs, alkyl-PAHs, phthalates, p-cresol,
phenol, and anthraquinone (table 11). Several PAHs
exceeded screening guidelines at Clark Creek and
Shelton Ditch, and p-cresol exceeded guidelines at
Clark Creek and Pettyjohn Creek (table 9). The largest
phthalate concentrations in Salem-area streambed sedi
-
ments generally were larger than the Willamette Basin
maxima, but in the same range as national maxima (fig.
3).
The percentage of urban land use in the contribut-
ing drainage basin was positively correlated (Spear-
man’s rho significant to the 0.05 probability level) with
several organic chemicals (table 10). The fact that
PAHs were associated with percentage urban land use
is to be expected due to their origin from combustion
sources, including automobiles. Some phthalates and
total PCBs also were associated with percentage of
urban land use; these constituents are products of
industrial activities, which are often located in urban
areas. Similar results were obtained in a recent nation
-
wide study of organic compounds in streambed sedi-
ments (Lopes and Furlong, 2001), which found that
PAHs and phthalates were associated with urban land
use.
Implications for Future Monitoring and Site-Specific
Findings
Of the 14 sites sampled, streambed sediment at
the following 10 sites exceeded 1 or more of the
CCME probable effects level guidelines (table 9):
Claggett Creek, Clark Creek, East Fork of Pringle
Creek, Gibson Creek, Glenn Creek, Mill Creek near
mouth, Mill Creek upstream from Shelton Ditch, Petty
-
john Creek, Pringle Creek, and Shelton Ditch. Accord-
ing to the CCME, the recommended course of action is
to carry out whole-sediment bioassays with benthic
invertebrates at the 10 sites (Canadian Council of Min
-
isters of the Environment, 1995).
For eight sites (Claggett Creek, Clark Creek, Gib-
son Creek, Glenn Creek, Mill Creek near mouth, Petty-
john Creek, Pringle Creek, and Shelton Ditch), the
18
Figure 2. Comparison of concentrations of elements in streambed sediment samples from the Salem area with Willamette Basin
concentrations, nationwide concentrations, and sediment quality guidelines [Willamette Basin data are from 1992 to 1995 (Wentz and others,
1998a), and nationwide data are from 1992 to 1997 (U.S. Geological Survey, 2002). Probable effects levels are from the Canadian Council of
Ministers of the Environment, 2001; screening levels and maximum levels are from the Puget Sound Dredged Disposal Analysis Program,
2000. There are no sediment quality guidelines for selenium.]
0.01 0.1 1 100 1,00010 10,000 100,00
0
|
| |
Arsenic
|
| |
Cadmium
|
Chromium
|
| |
Copper
|
| |
Lead
|
| |
Mercury
|
|
Nickel
Selenium
|
| |
Zinc
Minor elements (µg/g)
|
| |
Range of detections in
Willamette Basin streams
Range of detections
in nationwide streams
Detection in
Salem area
CCME
probable
effects
level
PSDDA
screening
level
PSDDA
maximum
level
EXPLANATION
PSDDA screening level was exceeded for one or
more constituents. This means that bioassays would
be required if the streambed sediment from these
sites were considered as dredged material destined
for open-water disposal (Puget Sound Dredged
Disposal Analysis, 2000).
The concentration of total DDT (the sum of
p,p’-DDD, p,p’-DDE, and p,p’-DDT) was 374 µg/kg at
East Fork of Pringle Creek, and the PSDDA maximum
level guideline is 69 µg/kg (Puget Sound Dredged Dis
-
posal Analysis, 2000). Because the concentration in the
East Fork of Pringle Creek sample was more than twice
the maximum level guideline, it would be considered
unacceptable for disposal under PSDDA guidelines, if
the material were to be dredged.
Data from this study indicate that there has been
contamination of streambed sediment in the Salem
area. Biological testing is suggested by the guidelines,
and some studies are in progress by the City of Salem
(Jeanne Miller, City of Salem, written commun., 2002).
There may be other ways to further characterize the
sources and extent of this contamination. The source(s)
of PAHs at the Shelton Ditch site are hard to pinpoint
from the present study because it was not possible to
determine the contributing basin area for this site.
Further on-the-ground investigations and sampling
may indicate possible contamination sources for the
Shelton Ditch site. PAHs can accumulate in streambed
sediments by way of airborne transport, so air quality
of the area around Shelton Ditch should also be consid
-
ered.
Measurement of organochlorine compounds in
fish tissue may elucidate the ecological distribution of
these compounds in the Salem area. There were
exceedances of screening values for several DDT,
19
DDE, and DDD compounds at eight sites (table 9).
Since concentrations of organochlorine compounds
(normalized to lipid content) generally are larger in fish
tissue than in streambed sediment due to bioaccumula
-
tion (Wentz and others, 1998b), the analysis of fish tis-
sue may reveal further occurrences of organochlorine
compounds. If resident fish from these streams are
being consumed by humans and wildlife, fish tissue
analyses would be helpful to determine the health risk
associated with fish consumption.
It would be appropriate to test for dieldrin in fish
tissue since dieldrin was detected in unfiltered water
samples from Pringle Creek in 1994 (Anderson and
others, 1996), causing Pringle Creek to be listed as
water-quality limited by the Oregon Department of
Environmental Quality in 1998. Although dieldrin was
not found in elevated concentrations in streambed sedi
-
ment in this study, it is possible that bioaccumulation
has caused it to be concentrated in fish tissue. In the
Tualatin Basin, another predominantly urban area in
the Willamette Valley, concentrations of total chlor
-
dane and polychlorinated biphenyl exceeded criteria
for fish tissue (Bonn, 1999). It also may be appropriate
to test for these compounds in fish in Salem area
streams. It would be informative to collect data in
Salem area streams concerning fish species diversity
and abundance. Fish populations at urban-impacted
sites in the Tualatin Basin were low (Bonn, 1999), and
the same situation might be expected in the Salem area.
Further monitoring of the water column in the
Salem area streams could also yield useful information.
Many of the organic chemicals targeted by the present
study are hydrophobic, so they are expected to be
found in a more concentrated condition in sediment
and fish tissue. However, other constituents, such as
currently used water-soluble herbicides like atrazine
and 2,4-D, are more commonly found dissolved in the
water column. Some of these constituents are more
likely to be found in the initial runoff from storms fol
-
lowing pesticide application (Anderson and others,
1997), so sampling needs to be carefully coordinated
with meteorological and hydrological conditions. Bac
-
terial contamination by E. coli bacteria and fecal
coliform has also been documented in the Oregon
Department of Environmental Quality 303(d) list of
water-quality-limited streams, and may merit further
study.
Clark Creek
The streambed sediment sample from Clark
Creek had the highest concentration of at least one of
each class of the semivolatile organic chemicals. The
Clark Creek sample had the highest concentration of
every analyzed PAH (except for acenaphthene and
phenanthrene, which were highest at Shelton Ditch).
The sample from Clark Creek exceeded the PSDDA
and Canadian interim PEL screening values for several
of the organochlorines and PAHs (table 9). Addition
-
ally, Clark Creek streambed sediment had the highest
concentration for cadmium, chromium, lead, and zinc.
Concentrations in Clark Creek exceeded PSDDA and/
or CCME guidelines for lead and zinc (table 9).
The basin above the Clark Creek site was 100
percent urban land use (table 1). Urban and industrial
activities may be the source of organic chemicals and
elements in the streambed sediment sample from Clark
Creek. A closer examination of streambed-sediment
chemistry at various points along the stream may indi
-
cate the exact causes.
East Fork of Pringle Creek
The East Fork of Pringle Creek had the highest
concentrations of the DDD, DDE, and DDT com
-
pounds (table 11). Total DDD and total DDE exceeded
the CCME screening level guideline (table 9). Total
DDT exceeded the maximum level guideline by a fac
-
tor of more than 5 (see text above). DDT is an organo-
chlorine insecticide that was commonly used in the
United States in the 1950s and 1960s. Although it was
later banned, DDT and its degradation products, DDD
and DDE, are common in the environment. The drain
-
age basin for the East Fork of Pringle Creek is 87 per-
cent urban, with smaller areas of other land uses (table
1). DDT once was used in urban areas for insect con
-
trol. It is possible that DDT and other pesticides were
used and stored in the Pringle Creek area—that would
explain the presence of these chemicals that was docu
-
mented in the present study.
Aldrin was detected in streambed sediment at
only one site, the East Fork of Pringle Creek. (This
detection was at the detection level of 1 µg/kg.) This
detection of aldrin was unusual—fewer than 5 percent