AEROBIC BIODEGRADATION OF ORGANIC CHEMICALS IN ENVIRONMENTAL MEDIA: A SUMMARY OF FIELD AND LABORATORY STUDIES pot
Bạn đang xem bản rút gọn của tài liệu. Xem và tải ngay bản đầy đủ của tài liệu tại đây (119.28 KB, 32 trang )
AEROBIC BIODEGRADATION OF ORGANIC CHEMICALS
IN ENVIRONMENTAL MEDIA:
A SUMMARY OF FIELD AND LABORATORY STUDIES
Prepared by: Dallas Aronson
Mario Citra
Kirsten Shuler
Heather Printup
Philip H. Howard
Environmental Science Center
Syracuse Research Corporation
6225 Running Ridge Road
North Syracuse, NY 13212-2509
Prepared for: Eric J. Weber
U.S. Environmental Protection Agency
Office of Research and Development
Athens, GA 30605
January 27, 1999
TABLE OF CONTENTS
1. PURPOSE 1
2. TECHNICAL APPROACH 1
2.1. Literature Search 1
2.2. Definition and Use of Biodegradation Rate Constants 3
2.2.1. Zero-Order Rate Constants 3
2.2.2. First-Order Rate Constants 5
2.2.3. Mineralization Rate Constants Versus Primary Biodegradation Rate
Constants 5
2.3. Calculation of First-Order Rate Constants 6
2.3.1. Laboratory Studies 6
2.3.2. Field and in situ Microcosm Studies 8
3. RESULTS 10
3.1. BTEX Compounds 11
3.1.1. Benzene 12
3.1.2. Toluene 27
3.1.3. Ethylbenzene 48
3.1.4. o-Xylene 52
3.1.5. m-Xylene 61
3.1.6. p-Xylene 66
3.2. PAH (Polycyclic Aromatic Hydrocarbon) Compounds 71
3.2.1. Naphthalene 72
3.2.2. Fluorene 83
3.2.3. Benzo(a)anthracene 87
3.2.4. Chrysene 94
3.2.5. Fluoranthene 100
3.2.6. Pyrene 103
3.2.7. Benzo(a)pyrene 109
3.3. Chlorinated Aliphatic Compounds 115
3.3.1. Tetrachloroethylene 115
3.3.2. Dichloromethane 120
3.4. Phenol and Substituted Phenols 122
3.4.1. Phenol
122
3.6. Miscellaneous 151
3.6.1. Bis(2-ethylhexyl)phthalate 151
3.5.2. Methanol 158
4. SUMMARY 161
5. REFERENCES 164
LIST OF TABLES
Table 1. Final list of compounds 2
Table 2. Aerobic biodegradation rate constant values for benzene 15
Table 3. Aerobic biodegradation rate constant values for toluene 30
Table 4. Aerobic biodegradation rate constant values for ethylbenzene 49
Table 5. Aerobic biodegradation rate constant values for o-xylene 54
Table 6. Aerobic biodegradation rate constant values for m-xylene 63
Table 7. Aerobic biodegradation rate constant values for p-xylene 68
Table 8. Aerobic biodegradation rate constant values for naphthalene 74
Table 9. Aerobic biodegradation rate constant values for fluorene 84
Table 10. Aerobic biodegradation rate constant values for benzo(a)anthracene 89
Table 11. Aerobic biodegradation rate constant values for chrysene 96
Table 12. Aerobic biodegradation rate constant values for fluoranthene 101
Table 13. Aerobic biodegradation rate constant values for pyrene 105
Table 14. Aerobic biodegradation rate constant values for benzo(a)pyrene 111
Table 15. Aerobic biodegradation rate constant values for tetrachloroethylene 117
Table 16. Aerobic biodegradation rate constant values for dichloromethane 121
Table 17. Aerobic biodegradation rate constant values for phenol 124
Table 18. Aerobic biodegradation rate constant values for o-cresol 134
Table 19. Aerobic biodegradation rate constant values for m-cresol 137
Table 20. Aerobic biodegradation rate constant values for p-cresol 141
Table 21. Aerobic biodegradation rate constant values for acetone 147
Table 22. Aerobic biodegradation rate constant values for methyl ethyl ketone 150
Table 23. Aerobic biodegradation rate constant values for bis(2-ethylhexyl)phthalate 153
Table 24. Aerobic biodegradation rate constant values for methanol 159
Table 25. Summary of median and range of aerobic biodegradation rate constant values for
compounds listed in document 163
LIST OF FIGURES
Figure 1a. Frequency histogram for the published primary biodegradation rate constant values
for benzene. 13
Figure 1b. Frequency histogram for the published mineralization rate constant values for
benzene. 14
Figure 2a. Frequency histogram for the published primary biodegradation rate constant values
for toluene. 28
Figure 2b. Frequency histogram for the published mineralization rate constant values for
toluene. 29
Figure 3. Frequency histogram for the published primary biodegradation rate constant values of
ethylbenzene. 48
Figure 4. Frequency histogram for the published primary biodegradation rate constant values for
o-xylene. 53
Figure 5. Frequency histogram for the published primary biodegradation rate constant values of
m-xylene. 62
Figure 6. Frequency histogram for the published primary biodegradation rate constant values of
p-xylene. 67
Figure 7a. Frequency distribution histogram for the published primary biodegradation rate
constant values of naphthalene. 73
Figure 7b. Frequency distribution histogram for the published mineralization rate constant
values of naphthalene. 73
Figure 8a. Frequency distribution histogram for the published primary biodegradation rate
constant values of fluorene. 83
Figure 8b. Frequency distribution histogram for the published mineralization rate constant
values of fluorene 83
Figure 9a. Frequency distribution histogram for the published primary biodegradation rate
constant values of benzo(a)anthracene. 87
Figure 9b. Frequency distribution histogram for the published mineralization rate constant
values of benzo(a)anthracene. 88
Figure 10a. Frequency distribution histogram for the published primary biodegradation rate
constant values of chrysene. 94
Figure 10b. Frequency distribution histogram for the published mineralization rate constant
values of chrysene. 95
Figure 11. Frequency histogram for the published primary biodegradation rate constant values of
fluoranthene. 100
Figure 12a. Frequency distribution histogram for the published primary biodegradation rate
Figure 13b. Frequency histogram for the published mineralization rate constant values of
benzo(a)pyrene. 110
Figure 14. Frequency histogram for the published primary biodegradation rate constant values of
dichloromethane. 120
Figure 15a. The frequency histogram for the published primary biodegradation rate constant
values of phenol. 123
Figure 15b. The frequency histogram for the published mineralization rate constant values of
phenol. 123
Figure 16. Frequency histogram for the published primary biodegradation rate constant values of
o-cresol. 133
Figure 17. Frequency histogram for the published primary biodegradation rate constant values of
m-cresol. 136
Figure 18. Frequency histogram for the published primary biodegradation rate constant values of
p-cresol. 140
Figure 19. Rate constant versus initial concentration of acetone in a shallow stream. 145
Figure 20a. The frequency histogram for the published primary biodegradation rate constant
values of acetone. 146
Figure 20b. The frequency histogram for the published primary biodegradation rate constant
values of acetone. 146
Figure 21a. Frequency histogram for the published primary biodegradation rate constant values
of bis(2-ethylhexyl)phthalate. 152
Figure 21b. Frequency histogram for the published mineralization rate constant values of bis(2-
ethylhexyl)phthalate. 152
Figure 22. Frequency histogram for the published primary biodegradation rate constant values of
methanol. 158
1. PURPOSE
In the following document, Syracuse Research Corporation (SRC) has reviewed the available
aerobic biodegradation literature for several common organic chemicals and identified
biodegradation rate constants from these studies. Unlike the anaerobic biodegradation rate
constant database previously compiled (Aronson and Howard, 1997), the aerobic biodegradation
rate constant database includes rate constant information from soil, surface water, and sediment
as well as aquifer environments. This project has been completed to demonstrate that in many
cases, a large amount of data is available from a variety of studies showing either the ability or
inability of a particular compound of interest to degrade in the environment.
2. TECHNICAL APPROACH
2.1. Literature Search
A list of 25 compounds was initially received from the U.S. EPA. A rapid search of the
BIOLOG file of the Environmental Fate Data Base (EFDB) (Howard et. al., 1986) for
compounds with aerobic studies revealed that four of the listed compounds did not have
appropriate data available for input into the database (cyanide, vinyl acetate, methyl isobutyl
ketone and cyanide). These compounds were dropped from the list. However, the compound
“xylene” was separated into its three isomers and data were collected for each isomer
individually. These changes resulted in a final list of 23 compounds (Table 1) for which
biodegradation rate information was then summarized.
The literature compilation began with an electronic search of two files in SRC’s EFDB,
DATALOG and BIOLOG, as sources of extensive biodegradation information. Currently, there
are over 315,000 catalogued records for 15,965 compounds in DATALOG and nearly 62,000
records for 7,820 compounds in BIOLOG. BIOLOG search terms were used to identify aerobic
studies with a mixed population of microbes from soil, sediment, or water. DATALOG was
searched for useful field, ecosystem, and biodegradation studies. Relevant papers were retrieved
and summarized in the database. In addition to the literature searches, the reference section of
every retrieved paper was scanned in order to identify additional relevant articles. To be
included in this database, the study was required: 1) to use soil, aquifer material, groundwater,
aerobic sediment, or surface water and 2) to be incubated under aerobic conditions. Studies
where the environmental material was seeded with microorganisms from other sources (e.g.
sewage, anaerobic sediment, and enrichment culture experiments) were not included.
results, identification of reaction products, general comments (to accommodate other important
information) and an abbreviated reference from which the information was retrieved.
Table 1. Final list of compounds
Chemical Name CAS Number
Acetone 000067-64-1
Benzene 000071-43-2
Benzo(a)anthracene 000056-55-3
Benzo(a)pyrene 000050-32-8
Bis(2-ethylhexyl)phthalate 000117-81-7
Chrysene 000218-01-9
m-Cresol 000108-39-4
o-Cresol 000095-48-7
p-Cresol 000106-44-5
Dichloromethane (methylene chloride) 000075-09-2
Ethylbenzene 000100-41-4
Fluoranthene 000206-44-0
Fluorene 000086-73-7
Methanol 000067-56-1
Methyl ethyl ketone 000078-93-3
Naphthalene 000091-20-3
Phenol 000108-95-2
Pyrene 000129-00-0
Tetrachloroethylene 000127-18-4
Toluene 000108-88-3
m-Xylene 000108-38-3
o-Xylene 000095-47-6
p-Xylene 000106-42-3
µ
'
µ
max
S
K
s
%S
(1)
v
'
V
max
S
K
m
%S
(2)
2.2. Definition and Use of Biodegradation Rate Constants
Over time, a compound will biodegrade at a particular rate and the biodegradation kinetics will
be dependent on the environmental conditions and the availability and concentration of the
substrate. The Monod equation was developed to describe the growth of a population of
microbes in the presence of a carbon source. At low concentrations of substrate, the microbial
population is small. With increasing substrate concentrations, the microbial population grows
until a maximum growth rate is reached. This is mathematically described by:
where F=growth rate of the microbe, S=substrate concentration, F
max
=maximum growth rate of
the microbe, and K
s
=a constant defined as the value of S at which F=0.5F
max
. The Monod
equation is best used when the microbial population is growing in size in relation to the substrate
concentration (Alexander, 1994).
Both first and zero-order rate constants are calculated when little to no increase in microbial cell
numbers is seen (Schmidt et. al., 1985). This will occur where the cell density is high compared
to the substrate concentration. In this case, biodegradation kinetics are better represented by the
classic Michaelis-Menton equation for enzyme kinetics. This equation assumes that the reaction
rate of the individual cells and not the microbial population is increasing in relation to increasing
substrate concentrations:
where v=reaction rate (F in the Monod equation), V
max
=maximum reaction rate (F
max
in the
Monod equation), and K
m
is the Michaelis constant (K
s
in the Monod equation) (Alexander,
1994).
2.2.1. Zero-Order Rate Constants
A zero-order rate constant is calculated when the substrate concentration is much greater than K
m
so that as the substrate is biodegraded, the rate of biodegradation is not affected,
i.e.
loss is
k
0
'
S
0
&
S
t
(4)
and the integral:
where S
0
=initial substrate concentration, S=substrate concentration at time=t, and k
0
=the zero-
order rate constant (expressed as concentration/time, e.g. Fg/L/day).
In the aerobic biodegradation database, zero-order rate constants are reported where the author
has determined this value. If the author did not specify that the zero-order rate constant was a
better measurement of the kinetics, this value was placed in the rate constant comments field and
a SRC calculated first-order rate constant was placed in the rate constant field. If it was specified
that zero-order rate kinetics were superior in describing the loss of a compound in the measured
system, the zero-order rate constant was placed in the rate constant field and a first-order rate
constant calculated by SRC was reported in the rate constant comment field. When sufficient
information was not present in the paper to convert the reported values to a first-order rate
constant, then the zero-order rate constant was placed in the rate constant field.
If a rate constant was not reported by the study authors and a value could be determined from the
presented experimental data, SRC assumed first-order rate kinetics. A more accurate but time
consuming approach would have been to plot the substrate concentration versus time. A straight
line would signify zero-order kinetics and an exponential curve (or a straight line on a log linear
paper) would indicate first-order kinetics. Priority was given to the determination of a first-order
rate constant as many environmental models require the input of a first-order rate constant. This
may not be strictly correct in all situations, such as when the substrate is present at high
concentrations (above K
m
), when substrate concentrations are toxic to the microbial population,
when another substrate(s) is limiting the biodegradation rate or when the microbial population is
significantly increasing or decreasing in size (Chapelle et. al., 1996).
Recently, the common use of first-order rate constant values to describe the kinetics of
biodegradation loss in natural systems has been criticized. Bekins et. al. (1998) suggest that the
automatic use of first-order kinetics without first determining whether the substrate concentration
is less than the half-saturation constant, K
m
, is incorrect and can lead to substantial
miscalculations of the biodegradation rate of a studied compound. Using first-order kinetics
where the substrate concentration is higher than K
m
will lead to an overprediction of the
dS
dt
'
k
1
S
(5)
k
1
'
ln
S
0
S
t
(6)
K
m
value and that first-order kinetics may not adequately represent the biodegradation of the
studied compound. First-order rate constants are, however, commonly used to describe kinetics
in natural systems often because of the lack of sufficient data points and the ease with which
these values can be calculated. Salanitro (1993) reports that several studies where BTEX
concentrations range from <1 to 5000 ppb are adequately described by first-order kinetics.
2.2.2. First-Order Rate Constants
First-order rate constants are used as a convenient approximation of the kinetics of degradation
of test substrates where there is no growth of the microbial population and a low concentration of
the test substrate is present. Under these circumstances, the substrate concentration is lower than
K
m
and, over time, both the concentration of substrate and rate of degradation drop in proportion
with each other. Thus, unlike zero-order kinetics, the rate of biodegradation in a first-order
reaction is dependent on the substrate concentration and is represented by the differential:
and the integral:
where S
0
=initial substrate concentration, S=substrate concentration at time=t, and k
1
=the first-
order rate constant. During first-order rate reactions, the loss of substrate is exponential and
follows a logarithmic curve.
The rate constant is used to correlate the rate of the reaction with time. In a first-order reaction, a
constant percent of the substrate is lost with time and the rate is described by either percent per
time or the half-life. The half-life is easily visualized and is more commonly used. In contrast, a
zero-order rate constant by definition equals the rate and is given in units of concentration/time.
This is because the rate is linear and loss is constant with time.
2.2.3. Mineralization Rate Constants Versus Primary Biodegradation Rate Constants
Many experiments summarized in the aerobic biodegradation database measured mineralization,
measured. In addition, once produced, CO
2
can be bound as carbonate within the study system.
Thus, it is expected that unless degradation proceeds rapidly and completely to CO
2
and water,
that mineralization rate constant values will be less than those measured for primary
biodegradation.
2.3. Calculation of First-Order Rate Constants
Rate constants were collected from eight types of studies: laboratory column, field, groundwater
grab sample, groundwater inoculum, in situ microcosm, lysimeter, reactor systems, and
laboratory microcosm studies. The majority of studies summarized in the aerobic biodegradation
database were laboratory microcosm studies. Laboratory microcosm studies can be further
subdivided by the type of grab sample used: soil, sediment, surface water (including freshwater,
estuarine, and seawater), and aquifer sediment and groundwater mixtures. The information
obtained from each of these studies ranged from published first-order rate constants to simply an
indication or contraindication of biodegradation. In some cases, insufficient data were available
to assess whether biodegradation had occurred; for these studies, the rate constant field was left
blank. When published first-order rate constants were not available, but sufficient information
was presented to calculate a value, the rate constant was calculated by SRC.
To ensure that loss of a contaminant was due to biodegradation and not just to abiotic or
transport processes, an appropriate control was necessary to correct the data set. This can be a
problem in laboratory studies that are incubated for a long period of time. Mercuric chloride is
known to adsorb to the clay component of soil or aquifer sediment reducing its efficacy whereas
sodium azide only inhibits bacteria containing cytochromes (Wiedemeier et. al., 1996). In
addition, autoclaving may not be totally suitable, probably due to incomplete sterilization
(Dobbins et. al., 1992). Information on the control used in the study, if available in the paper, is
found in the database field “control results”. This field was used mainly to state the method of
sterilization, or, in the case of field studies, whether a conservative tracer was used. If a control
was used by the author(s) but the method not specified then “yes” was placed in the “control
results” field (e.g. Davis and Madsen, 1996). If the paper does not state whether a control was
used then this field was left blank.
In some instances, a value is also included in the control field. When reported, this represents the
loss of compound in the control over the study period. Studies often did not specify the loss
found in the control, or the half-life or rate constant was directly reported by the author(s) and it
was assumed, unless stated otherwise, that these values had been corrected for abiotic loss.
2.3.1.
Laboratory Studies
C
f
,
corr
'
C
f
Z
i
Z
f
(7)
ln
C
i
relative numbers, metabolic state and ability to acclimate once exposed to a chemical are likely to
vary considerably depending upon environmental parameters such as temperature, conductivity,
pH, oxygen concentration, redox potential, concentration, the presence/absence of electron
acceptors and donors, and effects, both synergistic and antagonistic, of associated microflora
(Howard and Banerjee, 1984).
Lag periods were established either from the discussion in the paper or from looking at the data,
and an appropriate initial and final concentration was chosen. The value used for the initial
concentration was the concentration present following the lag period; therefore, all rate
calculations for this project are independent of the associated lag period. Where a value of “0
µg/L” was reached as a final timepoint, an earlier time was chosen for the kinetics calculation, if
possible; the use of zero as a denominator in the first-order rate equation would result in an
“infinite” value. If the concentration reached a value other than zero but leveled off at that point
for the remainder of the experiment, the final concentration and time were chosen at the point
where the concentration leveled off. In column studies, the time field in the database contains
the retention time for the column, which is the value (?t) used to calculate the rate constant;
column experiments were usually run for long periods of time, which would allow for the
development of an acclimated microbial population.
The initial and final concentrations of the control within the chosen time period were obtained
and the experimental data corrected for the loss shown by the control using the following
equation:
where: C
f,corr
=corrected final concentration of the contaminant (corrected for non-
biodegradation loss
C
f
=final contaminant concentration, uncorrected
Z
i
=initial control concentration
Z
f
=final control concentration.
A first-order rate constant was then calculated for laboratory data using the corrected final
contaminant concentration as follows:
where: C
i
=initial contaminant concentration
C
f,corr
=corrected final concentration of the contaminant (corrected for non-biodegradation
loss)
?t=time interval
k
1
=first-order rate constant.
2.3.2. Field and in situ Microcosm Studies
In situ microcosms were designed to isolate a portion of the aquifer in order to make
measurements directly in the field. This device is essentially a pipe divided into a test chamber
and an equipment chamber, with two screens that permit water to be pumped both into and out of
the interior of the pipe. More detailed information can be found in Gillham et. al. (1990).
Groundwater is pumped to the surface, spiked with the compounds of interest plus other nutrients
and/or electron acceptors if wanted, and then reinjected. Because the test zone is isolated from
the main aquifer, advective and dispersive processes are not important to the study results.
Often, this method is used to give very specific results for a particular redox regime within an
aquifer (Nielsen et. al., 1995). The data obtained from this type of study was similar to that for a
laboratory microcosm where loss of substrate is monitored with time; rate constants were
calculated using the same method as for the laboratory studies.
In general, the field studies reported in this database are for aquifer environments. Only a limited
number of aerobic aquifer studies were located, mainly because the oxygen initially present in
groundwater will be rapidly used during oxidative degradation. This results in anaerobic
conditions close to the source and within the contaminant plume. However, biodegradation data
were reported for a few aerobic aquifer environments. Data from field studies were generally
reported for 1) plume studies where monitoring wells were placed along the centerline of a
contaminant plume or for 2) continuous injection experiments where monitoring wells were
placed in fences along the flow path fairly close to the injection point (often 2 and 5 meters
away). Loss of a contaminant over distance does not necessarily indicate that the compound has
undergone biodegradation. Significant loss in concentration along a flow path is often reported
for compounds simply due to non-biological processes such as advection, dispersion, sorption,
and dilution. However, degradation is the only mechanism which leads to an actual loss of the
contaminant.
The most convenient way to correct for non-biodegradation processes in both plume and
injection studies is to use compounds present in the contaminant plume or injection mixture that
are 1) biologically recalcitrant and 2) have similar properties, such as Henry’s Law constant and
from a minimum of two points along a flow path in order to correct for the loss of the compound
of interest due to transport processes.
A mass balance approach has also been used by some researchers (Barker et. al., 1987) to
determine the rate of biodegradation of specific contaminants in groundwater during a field
study. Mass flux of the studied contaminant through a line/cluster of wells (a transect) is
recorded instead of monitoring loss of the contaminant at specific points down the middle of a
plume, as is typical for a plume centerline study. Wiedemeier et. al. (1996), suggests that the
calculations involved are approximate and that often many of the required parameters necessary
for the modeling are not available.
3. RESULTS
Biodegradation of organic compounds under aerobic conditions most often occurs when bacteria
catalyze the breakdown of these molecules and then recover some of this chemical energy as
ATP (adenosine triphosphate) which is absolutely necessary for maintenance of the bacterial cell.
ATP is generated through a series of oxidation-reduction reactions (the electron transport chain)
where electrons are sequentially transferred from one compound, the electron donor, to an
electron acceptor. The final or terminal electron acceptor in aerobic respiration is oxygen.
Dissolved oxygen concentrations of 1 mg/L or greater are considered to define aerobic
conditions. During aerobic respiration, the oxygen present in the environment is converted to
water and thus the dissolved oxygen content can decrease. This is particularly significant in
closed systems, as in a confined aquifer, where conditions can quickly become anaerobic with the
metabolism of high concentrations of organic chemicals.
Thermodynamically, the reduction of molecular oxygen to water is very favorable for the
participating microorganisms. Because hydrocarbons are generally chemically reduced
(chlorinated aliphatics are an exception within the group of compounds in this paper) and stable,
this is a preferred pathway over other redox pathways such as anaerobic chemical reduction.
Aerobic biodegradation results in the oxidation of the original compound. Metabolism of
aliphatic compounds generally proceeds initially by production of the alcohol and then oxidation
to the carboxylic acid which is susceptible to beta-oxidation. In pure culture studies, aromatic
hydrocarbons have been shown to biodegrade generally with the addition of one molecule of
oxygen giving the dihydrodiol intermediate, usually with a cis-stereochemistry. This
intermediate is then oxidized forming the catechol which then allows for ortho- or meta-
cleavage of the aromatic ring structure (Gibson, 1977).
The data collected during this project were mainly from laboratory microcosm studies, a
classification including grab sample studies (except for groundwater grab samples) for the
purposes of this database. Groundwater grab samples were considered separately as it has been
shown that a large majority of microorganisms responsible for biodegradation in the subsurface
environment are associated with the aquifer sediment surface (Thomas et. al., 1987). Therefore,
rates collected during groundwater grab studies may not be as rapid as those where aquifer
sediment is included. Laboratory microcosm studies are believed to give very good evidence of
biodegradation at a specific location and can provide an “absolute mass balance” on a particular
contaminant. In addition, the formation and measurement of metabolites can definitively show
the biodegradation of the contaminant of interest. However, results from a laboratory microcosm
can be greatly influenced by many factors such as the source, collection, and condition of the
a natural sample during its collection or the construction of a microcosm may also result in a
“disturbance artifact” which is seen as an increase in the microbial activity of the sample (Davis
and Olsen, 1990). However, the influence of transport processes such as volatilization and
adsorption cannot be measured in a microcosm experiment. If consideration of these processes is
important, then field studies can be used to provide environmentally relevant data for a specific
site, essentially showing whether the compound of interest can or cannot be biodegraded at that
location.
The results for each compound are presented in the following sections. Separation of the data
into mineralization and primary degradation studies was initially completed and each category
was considered separately. A range was given to represent the dispersion of the data within the
group as well as a median value, representing the central tendency of the data. In addition,
frequency distribution histograms for the two types of studies are given for each compound with
sufficient data. Within the subcategories of mineralization and primary degradation, each study
was given equal weighting despite differences in how the study was carried out. Rate constants
which were given as zero-order and could not be converted to first-order rate constants were not
included in the statistical analysis.
3.1. BTEX Compounds
The BTEX group is composed of the water-soluble and monoaromatic compounds benzene,
toluene, ethylbenzene, o-xylene, m-xylene, and p-xylene. In both laboratory and field studies, the
biodegradation of all the BTEX compounds has been shown under aerobic conditions (Tables 2
to 7). There is a stoichometric requirement of 3 ppm O
2
to 1 ppm BTEX for the aerobic
degradation of fuel hydrocarbons with rates of biodegradation appearing to slow for dissolved
oxygen concentrations below 1 to 2 ppm in microcosm and field studies and below 1 ppm for
soil column studies (Salanitro, 1993; Chiang et. al., 1989). Laboratory studies where 8 mg/L
dissolved oxygen is initially present have been shown to rapidly biodegrade 2 mg/L or less of a
BTEX mixture or a particular BTEX compound (Salanitro, 1993).
The majority of studies located for the BTEX compounds were for aquifer environments. As
reported earlier, many aquifers become anaerobic during contaminant biodegradation due to the
use of oxygen in aerobic respiration. Replacement of this oxygen from upgradient of the source,
plume edges, infiltration of precipitation, or from vadose or saturated zone recharge is slower
than its use during aerobic metabolism. Thus, the concentration of oxygen often becomes the
rate-limiting factor in the biodegradation of the BTEX compounds in aquifer environments.
During laboratory studies this can be controlled by the addition of oxygen or hydrogen peroxide.
Extrapolation of laboratory rate constants to field environments which are confined or semi-
3.1.1. Benzene
While benzene is considered recalcitrant under anaerobic conditions, most evidence currently
available shows that this compound is moderately degradable in the presence of oxygen (Table
2). Degradation is thought to proceed via catechol to CO
2
(Ribbons and Eaton, 1992). 3.08 mg
of oxygen are necessary to biodegrade 1 mg of benzene to CO
2
and water (Wiedemeier et. al.,
1995). This calculation does not include the energy requirement for cell maintenance and thus is
not a conservative value. However, the value of 3.1 mg oxygen to degrade 1 mg benzene is
suggested as a conservative estimate (Wiedemeier et. al., 1995).
Most of the located data for benzene under aerobic conditions were for aquifer environments.
Field studies at six different locations consistently reported the biodegradation of benzene, giving
half-life values ranging from 58 to 693 days. The longer half-life was associated with an
uncontaminated aquifer study (American Petroleum Institute, 1994). Initial concentrations of up
to 25 mg/L were biodegraded under field conditions (Davis et. al., 1994). Biodegradation of
benzene was observed as well during in situ microcosm studies at two locations. Half-lives
ranged from 1.4 (Nielsen et. al., 1996) to 103 (Holm et. al., 1992) days with an average half-life
of 4 days. The high half-life value represents biodegradation in the groundwater only section of
the in situ microcosm; half-life values obtained in the aquifer sediment + groundwater section
were significantly lower.
By far the most common type of study used to observe the biodegradation of benzene under
aerobic conditions is the laboratory microcosm. Mineralization half-lives for benzene in lab
microcosm studies ranged from 7 (Kemblowski et. al., 1987) to 1195 days (Thomas et. al., 1990)
with the high value representing a study from an uncontaminated site. Microcosms established
with sediment from a contaminated and a biostimulated region in the aquifer, measured during
the same study, showed more rapid mineralization rates. The average half-life for mineralization
was 53 days. In comparison, microcosm studies measuring primary biodegradation reported half-
lives ranging from 0.2 (Kjeldsen et. al., 1997) to 679 (Pugh et. al., 1996) days with an average
value of 1.5 days. Initial concentrations of up to 50 mg/L (Kemblowski et. al., 1987) were
reported in these experiments without obvious deleterious effect. In general, however, initial
concentrations of 5 mg/L or less were utilized.
No biodegradation was reported for four lab microcosm studies. A study by the American
Petroleum Institute, 1994A, reports that benzene was not biodegraded in the presence of 85%
methanol over 278 days. This result was not unexpected as sufficient oxygen was available to
degrade only 5% of the initially added methanol. This suggests that anaerobic conditions may
have occurred rapidly within this microcosm.
Hunt and Alvarez, 1997 also report that benzene in
0
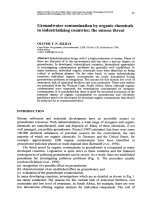
20
40
60
80
0 0.4 0.8 1.2 1.6 2 2.4 2.8 3.2 3.6
Rate constant (days
-1
)
Frequency
study by Vaishnav and Babeu (1987), it was not biodegraded in the presence of harbor water
collected in Lake Superior. The addition of both nutrients and an enriched microbial culture
isolated from sewage resulted in the biodegradation of this compound indicating that bacteria
capable of biodegrading benzene were either not present or not present in sufficient numbers to
significantly remove benzene in the natural harbor water over a 20-day period. Laboratory
column experiments by Anid et. al. (1991) and Alvarez et. al. (1998) report that benzene was not
biodegraded under certain circumstances. Anid et. al. (1991) reported that columns
supplemented with hydrogen peroxide but not columns supplemented with nitrate were able to
degrade benzene. The nitrate-amended columns may have exhibited nitrate-reducing conditions
as over 60 mg/L BTEX mixture was initially added. However, no attempt was made by the
authors to distinguish through end product measurements whether conditions remained aerobic
or became nitrate-reducing. Alvarez et. al. (1998) showed biodegradation of benzene in
laboratory columns fed with acetate and benzoate as cosubstrates. However, preacclimated
sediment exposed to acetate and sediment columns which received no preacclimation period
were unable to biodegrade benzene while a column which had been preacclimated to benzoate
readily biodegraded this column.
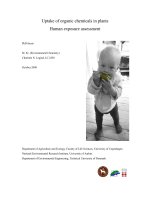
The median for the primary biodegradation rate constant of benzene, considering all studies, is
0.096/day (N = 118); a range of not biodegraded to 3.3/day is reported. The median for the
mineralization rate constant of benzene is 0.0013/day (N = 30); a range of not biodegraded to
0.087/day is reported. The frequency distribution histograms for this data are shown in figures 1a
and 1b. Benzene is expected to biodegrade fairly readily under most aerobic environmental
conditions.
Figure 1a.
Frequency histogram for the published primary biodegradation rate constant values
0
5
10
15
20
0 0.02 0.04 0.06 0.08 1
Rate constant (days
-1
)
Frequency
Figure 1b. Frequency histogram for the published mineralization rate constant values for
benzene.
15
Table 2. Aerobic biodegradation rate constant values for benzene
Compound Site Name Site Type Inoculum Study Type Initial
Concn.
Time Period
(days)
Rate Constant Lag Time
(days)
Reference
Benzene Canada Forces Base, Borden,
Ontario
Uncontaminated Aquifer sediment +
groundwater
Field 476 0.001/day American Petroleum Institute
(1994)
Benzene Canada Forces Base, Borden,
Ontario
Uncontaminated Aquifer sediment +
groundwater
Field 476 0.003/day American Petroleum Institute
(1994)
Benzene Canada Forces Base, Borden,
Ontario
Uncontaminated Aquifer sediment +
groundwater
Field 476 0.004/day American Petroleum Institute
(1994)
Benzene Columbus Air Force Base,
Columbus, Miss.
Aquifer sediment +
groundwater
Field 224 0.0066/day Stauffer,TB et. al. (1994)
Benzene Michigan Gas plant facility Aquifer sediment +
groundwater
Field 0.0088-
0.0095/day
Chiang,CY et. al. (1986)
Benzene Indian River County, Florida Gasoline spill Aquifer sediment +
groundwater
Field 1.25 mg/L 0.012/day Kemblowski,MW et. al. (1987)
Benzene Canada Forces Base, Borden,
Ontario
Uncontaminated Aquifer sediment +
groundwater
Field 2.36 mg/L 374-434 30 mg/day Barker,JF et. al. (1987)
Benzene Amsterdam, The Netherlands Dune infiltration site Sediment Field <0.05 ug/L 7-49 Biodegrades Bosma,TNP et. al. (1996)
Benzene Eastern seaboard Contaminated Aquifer sediment +
groundwater
Field 25 mg/L Biodegrades Davis,JW et. al. (1994)
Benzene Vejen City, Jutland, Denmark Landfill site Groundwater Groundwater
grab sample
120 ug/L 90 0.0017/day Holm,PE et. al. (1992)
Benzene Traverse City, Michigan Jet fuel contamination Groundwater Groundwater
grab sample
800 ug/L 28 0.003/day Thomas,JM et. al. (1987)
Benzene Contaminated Groundwater Groundwater
grab sample
100 mg/L 24 0.0082/day 3 Chang,BV et. al. (1997)
Benzene Contaminated Groundwater Groundwater
grab sample
100 mg/L 33 0.0084/day 5 Chang,BV et. al. (1997)
Benzene Uiterburen, The Netherlands Natural gas
production site-BTEX
contamination
Groundwater Groundwater
grab sample
17.5 mg/L 0.016/day Morgan,P et. al. (1993)
Benzene 12 km north of Lake Superior,
Minnesota
Groundwater Groundwater
grab sample
20 0.025/day Vaishnav,DD & Babeu,L (1987)
Table 2. (Continued)
Compound Site Name Site Type Inoculum Study Type Initial
Concn.
Time Period
(days)
Rate Constant Lag Time
(days)
Reference
16
Benzene Uiterburen, The Netherlands Natural gas
production site-BTEX
contamination
Groundwater Groundwater
grab sample
17.5 mg/L 0.027/day Morgan,P et. al. (1993)
Benzene Uiterburen, The Netherlands Natural gas
production site-BTEX
contamination
Groundwater Groundwater
grab sample
0.478 mg/L 0.032/day Morgan,P et. al. (1993)
Benzene Vejen City, Jutland, Denmark Landfill site Groundwater Groundwater
grab sample
120 ug/L 90 0.033/day Holm,PE et. al. (1992)
Benzene Traverse City, Michigan Jet fuel contamination Groundwater Groundwater
grab sample
800 ug/L 28 0.035/day Thomas,JM et. al. (1987)
Benzene Uiterburen, The Netherlands Natural gas
production site-BTEX
contamination
Groundwater Groundwater
grab sample
17.5 mg/L 0.037/day Morgan,P et. al. (1993)
Benzene Uiterburen, The Netherlands Natural gas
production site-BTEX
contamination
Groundwater Groundwater
grab sample
17.5 mg/L 0.038/day Morgan,P et. al. (1993)
Benzene Uiterburen, The Netherlands Natural gas
production site-BTEX
contamination
Groundwater Groundwater
grab sample
17.5 mg/L 0.039/day Morgan,P et. al. (1993)
Benzene Uiterburen, The Netherlands Natural gas
production site-BTEX
contamination
Groundwater Groundwater
grab sample
17.5 mg/L 0.043/day Morgan,P et. al. (1993)
Benzene Uiterburen, The Netherlands Natural gas
production site-BTEX
contamination
Groundwater Groundwater
grab sample
17.5 mg/L 0.045/day Morgan,P et. al. (1993)
Benzene Uiterburen, The Netherlands Natural gas
production site-BTEX
contamination
Groundwater Groundwater
grab sample
17.5 mg/L 0.05/day Morgan,P et. al. (1993)
Table 2. (Continued)
Compound Site Name Site Type Inoculum Study Type Initial
Concn.
Time Period
(days)
Rate Constant Lag Time
(days)
Reference
17
Benzene NW Gainesville, Florida Groundwater Groundwater
grab sample
1 mg/L 16 0.107/day 8 Delfino,JJ & Miles,CJ (1985)
Benzene Uiterburen, The Netherlands Natural gas
production site-BTEX
contamination
Groundwater Groundwater
grab sample
0.478 mg/L 0.11/day Morgan,P et. al. (1993)
Benzene Uiterburen, The Netherlands Natural gas
production site-BTEX
contamination
Groundwater Groundwater
grab sample
0.478 mg/L 0.13/day Morgan,P et. al. (1993)
Benzene Vejen City, Jutland, Denmark Uncontaminated
landfill site
Groundwater Groundwater
grab sample
100 ug/L 23 0.13/day Albrechtsen,HJ et. al. (1996)
Benzene Uiterburen, The Netherlands Natural gas
production site-BTEX
contamination
Groundwater Groundwater
grab sample
0.478 mg/L 0.16/day Morgan,P et. al. (1993)
Benzene Vejen City, Jutland, Denmark Uncontaminated
landfill site
Groundwater + sterile
quartz
Groundwater
grab sample
100 ug/L 12 0.268/day Albrechtsen,HJ et. al. (1996)
Benzene Vejen City, Jutland, Denmark Uncontaminated
landfill site
Groundwater + sterile
rock wool
Groundwater
grab sample
100 ug/L 30 0.297/day 23 Albrechtsen,HJ et. al. (1996)
Benzene Grindsted, Denmark Uncontaminated
landfill site
Groundwater + sterile
quartz
Groundwater
grab sample
100 ug/L 7 0.329/day Albrechtsen,HJ et. al. (1996)
Benzene Grindsted, Denmark Uncontaminated
landfill site
Groundwater Groundwater
grab sample
100 ug/L 32 0.338/day 25 Albrechtsen,HJ et. al. (1996)
Benzene Uiterburen, The Netherlands Natural gas
production site-BTEX
contamination
Groundwater Groundwater
grab sample
0.478 mg/L 0.35/day Morgan,P et. al. (1993)
Benzene Los Angeles, California Gasoline
contamination
Groundwater Groundwater
grab sample
477 ug/L 2 0.38/day Karlson,U & Frankenberger,WTJr
(1989)
Benzene Industrial site Groundwater Groundwater
grab sample
32 mg/L 16.25 0.467/day 10.4 Williams,RA et. al. (1997)
Table 2. (Continued)
Compound Site Name Site Type Inoculum Study Type Initial
Concn.
Time Period
(days)
Rate Constant Lag Time
(days)
Reference
18
Benzene Grindsted, Denmark Uncontaminated
landfill site
Groundwater + sterile
rock wool
Groundwater
grab sample
100 ug/L 23 0.70/day 19 Albrechtsen,HJ et. al. (1996)
Benzene Uiterburen, The Netherlands Natural gas
production site-BTEX
contamination
Groundwater Groundwater
grab sample
0.478 mg/L 1.1/day Morgan,P et. al. (1993)
Benzene Uiterburen, The Netherlands Natural gas
production site-BTEX
contamination
Groundwater Groundwater
grab sample
0.478 mg/L 180 ug/L/day Morgan,P et. al. (1993)
Benzene Uiterburen, The Netherlands Natural gas
production site-BTEX
contamination
Groundwater Groundwater
grab sample
0.478 mg/L 200 ug/L/day Morgan,P et. al. (1993)
Benzene Los Angeles, California Gasoline
contamination
Groundwater Groundwater
grab sample
477 ug/L 1 3.3/day Karlson,U & Frankenberger,WTJr
(1989)
Benzene Forlev landfill, Korsoer,
Zealand
Sanitary landfill Leachate Groundwater
inoculum
100 ug/L 100 0.047/day 3 Lyngkilde,J et. al. (1988)
Benzene Forlev landfill, Korsoer,
Zealand
Sanitary landfill Leachate Groundwater
inoculum
100 ug/L 13 0.419/day 2 Lyngkilde,J et. al. (1988)
Benzene Forlev landfill, Korsoer,
Zealand
Sanitary landfill Leachate Groundwater
inoculum
100 ug/L 8 0.658/day 1 Lyngkilde,J et. al. (1988)
Benzene Forlev landfill, Korsoer,
Zealand
Sanitary landfill Leachate Groundwater
inoculum
100 ug/L 8 0.658/day 1 Lyngkilde,J et. al. (1988)
Benzene Vejen City, Jutland, Denmark Landfill site Groundwater In situ
microcosm
120 ug/L 0.0067/day Holm,PE et. al. (1992)
Benzene Vejen City, Jutland, Denmark Landfill site Groundwater In situ
microcosm
120 ug/L 0.0067/day Holm,PE et. al. (1992)
Benzene Vejen City, Jutland, Denmark Landfill site Aquifer sediment +
groundwater
In situ
microcosm
120 ug/L 0.033/day Holm,PE et. al. (1992)
Benzene Canadian Forces Base,
Borden, Ontario
Aquifer sediment +
groundwater
In situ
microcosm
345 ug/L 8 0.046/day Gillham,RW et. al. (1990)
Table 2. (Continued)
Compound Site Name Site Type Inoculum Study Type Initial
Concn.
Time Period
(days)
Rate Constant Lag Time
(days)
Reference
19
Benzene Vejen City, Jutland, Denmark Landfill site Aquifer sediment +
groundwater
In situ
microcosm
120 ug/L 0.058/day Holm,PE et. al. (1992)
Benzene Vejen City, Jutland, Denmark Landfill site Aquifer sediment +
groundwater
In situ
microcosm
150 ug/L 0.2/day 5 Nielsen,PH et. al. (1996)
Benzene Vejen City, Jutland, Denmark Landfill site Aquifer sediment +
groundwater
In situ
microcosm
150 ug/L 0.3/day 1 Nielsen,PH et. al. (1996)
Benzene Vejen City, Denmark Landfill site Aquifer sediment +
groundwater
In situ
microcosm
150 ug/L 48 0.5/day 6 Bjerg,PL et. al. (1996)
Benzene Vejen City, Jutland, Denmark Landfill site Aquifer sediment +
groundwater
In situ
microcosm
150 ug/L 0.5/day 6 Nielsen,PH et. al. (1996)
Benzene Northern Michigan Gas plant facility Aquifer sediment Lab column 20 mg/L 4.6 0.501/day Anid,PJ et. al. (1993)
Benzene Uncontaminated Aquifer sediment Lab column 193 ug/L >8 1-5 ug/day 3 Alvarez,PJJ et. al. (1998)
Benzene Uncontaminated Aquifer sediment Lab column 193 ug/L 2 2-9 ug/day Alvarez,PJJ et. al. (1998)
Benzene Uncontaminated Aquifer sediment Lab column 193 ug/L >8 3-7 ug/day 3 Alvarez,PJJ et. al. (1998)
Benzene Swan Coastal Plain, Australia Uncontaminated Aquifer sediment +
groundwater
Lab column 1060 ug/L 9.5/day Patterson,BM et. al. (1993)
Benzene Swan Coastal Plain, Australia Uncontaminated Aquifer sediment +
groundwater
Lab column 1060 ug/L 9.5/day Patterson,BM et. al. (1993)
Benzene Uncontaminated Aquifer sediment Lab column 150 ug/L 2.5 Biodegrades Alvarez,PJJ et. al. (1998)
Benzene Amsterdam, The Netherlands Dune infiltration site Sediment Lab column 0.5 ug/L Biodegrades Bosma,TNP et. al. (1996)
Benzene Amsterdam, The Netherlands Dune infiltration site Sediment Lab column 10-20 ug/L Biodegrades Bosma,TNP et. al. (1996)
Benzene Skaelskor, Denmark Uncontaminated Fractured clay Lab column 3.2 Biodegrades Broholm,K et. al. (1995)
Benzene Wageningen, The Netherlands Sediment Lab column 10-20 ug/L Biodegrades Bosma,TNP et. al. (1996)
Benzene Uncontaminated Aquifer sediment Lab column 150 ug/L 3 No
biodegradation
Alvarez,PJJ et. al. (1998)