Body composition in the elderly: Reference values and bioelectrical impedance spectroscopy to predict total body skeletal muscle mass pot
Bạn đang xem bản rút gọn của tài liệu. Xem và tải ngay bản đầy đủ của tài liệu tại đây (335.99 KB, 7 trang )
Original Article
Body composition in the elderly: Reference values and bioelectrical impedance
spectroscopy to predict total body skeletal muscle mass
q
Marja Tengvall
a
, Lars Ellegård
a
,
*
, Vibeke Malmros
a
, Niklas Bosaeus
a
, Lauren Lissner
b
, Ingvar Bosaeus
a
a
Department of Clinical Nutrition, Sahlgrenska University Hospital, Sahlgrenska Academy at University of Gothenburg, SE 405 30 GO
¨
TEBORG, Sweden
b
Department of Public Health and Community Medicine, Sahlgrenska University Hospital, Sahlgrenska Academy at University of Gothenburg, SE 405 30 GO
¨
TEBORG, Sweden
article info
Article history:
Received 19 March 2008
Accepted 6 October 2008
Keywords:
Body composition
Bioelectrical impedance
Elderly
Fat free mass
Skeletal muscle mass
Dual-energy X-ray absorptiometry
summary
Background & aims:
To validate the bioelectrical impedance spectroscopy (BIS) model against dual-
energy X-ray absorptiometry (DXA), to develop and compare BIS estimates of skeletal muscle mass
(SMM) to other prediction equations, and to report BIS reference values of body composition in a pop-
ulation-based sample of 75-year-old Swedes.
Methods:
Body composition was measured by BIS in 574 subjects, and by DXA and BIS in a subset of 98
subjects. Data from the latter group was used to develop BIS prediction equations for total body skeletal
muscle mass (TB SMM).
Results:
Average fat free mass (FFM) measured by DXA and BIS was comparable. FFM
BIS
for women and
men was 40.6 kg and 55.8 kg, respectively. Average fat free mass index (FFMI) and body fat index (BFI) for
women were 15.6 and 11.0. Average FFMI and BFI for men were 18.3 and 8.6. Existing bioelectrical
impedance analysis equations to predict SMM were not valid in this cohort. A TBSMM prediction
equation developed from this sample had an R
pred
2
of 0.91, indicating that the equation would explain 91%
of the variability in future observations.
Conclusions:
BIS correctly estimated average FFM in healthy elderly Swedes. For prediction of TBSMM,
a population specific equation was required.
Ó 2008 Elsevier Ltd and European Society for Clinical Nutrition and Metabolism. All rights reserved.
1. Introduction
Bioelectrical impedance analysis (BIA) is an easily performed
and non-invasive way to measure body composition.
1–3
Single
frequency-BIA (SF-BIA) is commonly used to calculate total body
water (TBW) and fat free mass (FFM).
2
Multi frequency-BIA (MF-
BIA)
2
and bioelectrical impedance spectroscopy (BIS) calculate
intracellular water (ICW), extracellular water (ECW), TBW and FFM.
Thus, BIS offers information of ICW and ECW distribution, and FFM
is predicted from these. Body fat (BF) is generally calculated as the
difference between body weight (BW) and FFM.
There is an increasing interest to specifically estimate skeletal
muscle mass (SMM), as it may better reflect the body protein
reserves and nutritional status in disease and aging.
4
SMM loss
(sarcopenia) is a process associated with aging as well as with
several diseases.
4
In healthy elderly, development of sarcopenia
may be masked by weight stability.
5
Furthermore, aging is associ-
ated with decreased TBW, bone mass, body cell mass (BCM) and
FFM.
1
Hence, due to the age dependent changes in body composi-
tion, it would be useful to obtain BIS reference values for the
elderly.
BIS-measured segmental total water volume has previously
been reported to be larger than, but highly correlated with,
segmental muscle volume measured by magnetic resonance
imaging (MRI), and BIS also tracked changes associated with head-
down tilt.
6
Furthermore, BIS successfully predicted total body
skeletal muscle mass (TBSMM) in a cohort with hemodialysis
patients.
7
There are several published prediction equations to estimate
SMM by BIA. A SF-BIA equation was suggested to predict whole
body SMM (SMM
Janssen
) among healthy Caucasians aged 18–86
years, validated against MRI.
8
Another SF-BIA equation used data
from healthy volunteers aged 22–94 years, to predict appendicular
skeletal muscle mass (ASMM
Kyle
), validated against appendicular
lean soft tissue (ALST) measured by dual-energy X-ray absorpti-
ometry (DXA) (ALST
DxA
).
4
However, the use of general BIA
Abbreviations: BIS, bioelectrical impedance spectroscopy; BIA, bioelectrical
impedance analysis; DXA, dual-energy X-ray absorptiometry; SMM, skeletal muscle
mass; TBSMM, total body skeletal muscle mass; FFM, fat free mass; BF, body fat;
fatness, percentage body fat; FFMI, fat free mass index; BFI, body fat index; SMMI,
skeletal muscle mass index.
q
Conference presentation: Parts of the data were presented in abstract and poster
form at the 9th Nordic Nutrition Conference, Copenhagen, 1–4 June 2008.
*
Corresponding author. Tel.: þ46 31 7863725; fax:þ46 31 7863101.
E-mail address: (L. Ellegård).
Contents lists available at ScienceDirect
Clinical Nutrition
journal homepage: />0261-5614/$ – see front matter Ó 2008 Elsevier Ltd and European Society for Clinical Nutrition and Metabolism. All rights reserved.
doi:10.1016/j.clnu.2008.10.005
Clinical Nutrition 28 (2009) 52–58
prediction equations across different ages and ethnic groups
without prior testing of their validity should be avoided.
2
Thus, it
was reported that ASMM
Kyle
was invalid in patients with chronic
kidney disease.
9
DXA is increasingly accepted as reference method to evaluate
BIS.
2
DXA yields information on BF, lean soft tissue (LST) and bone
mineral content (BMC). The extremities consist primarily of three
components: skeleton, fat and SMM, and limb LST has been shown
to represent ASMM.
10
Furthermore, DXA has been validated against
MRI to predict TBSMM (TBSMM
DxA
).
11
The aims of this study were to validate BIS against DXA and to
report BIS reference values of body composition among elderly
Swedes for use in evaluation of body composition changes in
disease and aging. Furthermore, we wanted to investigate the val-
idity of existing BIA-equations to predict SMM in our population,
and if needed, to develop a regression equation for the prediction of
TBSMM from BIS. Finally, we wanted to evaluate the extent to
which BIS measurements were accurate compared to previously
reported SF-BIA predictors.
4,8
2. Materials and methods
2.1. Subjects
The subjects were participants in the Geriatric and Gerontologic
Population Study and the Population Study of Women in Go
¨
teborg,
Sweden. The study was a follow-up of a population-based survey of
70-year olds that had been recruited 5 years previously and the
protocol was approved by the regional ethics committee in Go
¨
te-
borg. 1332 subjects (788 women and 544 men) were selected based
on date of birth during the year 1930, in order to be representative
of their birth cohort living in that area. 839 (501 women and 338
men) participated, which corresponds to a participant frequency of
63% (64% women and 62% men).
597 non-institutionalized 75-year-old subjects were included in
the survey described here, and all were examined by BIS.
Measurements from 23 subjects were excluded due to technical
problems or biologically implausible data (not excellent model fit
(11), Fc < 20 Hz (3) or >100 Hz (6), Ri < Re (1), FFM
BIS
> 95% of BW
(1), ECW/ICW-ratio < 0,54 (1)). Thus, 345 women and 229 men
were included. Information of medication use is presented in
Table 1.107 subjects of 574 had no medication. 81 women (24%) and
26 men (11%) used diuretics. A subset of 120 subjects was examined
by DXA and BIS, but 22 were excluded due to presence of methal
protheses. Thus, 48 women and 50 men were included. All 98
fullfilled the same BIS inclusion criteria as above. For the 98
subjects examined by DXA and BIS, there was information on
medication use available for 87 subjects. 14 (16%) used diuretics.
Distribution of BMI for both groups is presented in Table 2.
2.2. Study design
574 subjects were examined once by BIS at the H70 clinical
examination center, formerly Vasa Hospital (V-BIS), Go
¨
teborg,
Sweden, to obtain reference values of body composition measured
by BIS. The validation subgroup of 98 subjects was examined by BIS
(D-BIS) and on the same occasion by DXA at Sahlgrenska University
Hospital. 87 of the 98 subjects were also measured by V-BIS, and
thus participated in the 574 cohort. The results of the validation-
group were compared to the previously reported muscle mass
prediction equations ASMM
Kyle
4
and SMM
Janssen
8
1. ASMM
Kyle
: À4.2 11 þ (0.26 7 Â height
2
/resistance) þ (0.095 Â we ight)
þ (1 . 909 Â sex(men ¼ 1, women ¼ 0)) þ (À0.0 1 2 Â ag e) þ (0.058
 reactance)
2. SMM
Janssen
: (height
2
/resistance  0.401) þ (gender(men ¼ 1,
women ¼ 0) Â 3.825) þ (age ÂÀ0.071) þ 5.102
Furthermore, data from the validation-group was used to
develop and evaluate BIS prediction equations of TBSMM. Three
TBSMM-equations with different independent variables were
developed by stepwise multiple regression with TBSMM
DxA
as
dependent variable. First, a SF-BIA equation: TBSMM
50 kHz
(gender,
height in cm (Ht), BW, R(resistance)
50 kHz
and Xc(reactance)
50 kHz
included). Second, an equation using BIS model predictors:
TBSMM
BW
(gender, Ht, BW, C
m
, Re and Ri included). Finally, a BIS
equation without BW as predictor: TBSMM
noBW
(gender, Ht, C
m
,Re
and Ri included). The predictive value of the equations was evalu-
ated using PRESS statistics (predictive residual sum of squares), see
Section 2.5.
2.3. Bioelectrical impedance spectroscopy
Bioimpedance analysis was carried out using Xitron Hydra 4200
devices (Xitron Technologies, San Diego, USA) at both V-BIS and D-
BIS. The subjects rested in supine position for 5 min before the
tetrapolar whole body measurement with electrodes on the dorsal
surface of the right hand/wrist and at the right foot/ankle according
to the manufacturer’s instructions.
12
Red DotÔ surveillance elec-
trode (2239) for single use with foam tape and sticky gel Ag/AgCl
(3MÔ, Sollentuna, Sweden) was used at both V-BIS and D-BIS.
Software Boot version 1.02 and Main version 1.42 were used. ECW
and ICW were calculated from Xitron equations
12,1 3
:
ECW ¼
h
r
ECW
*K
B
*Ht
2
*ðBW=DÞ
0:5
=R
0
i
ð2=3Þ
(1)
where
r
ECW
is extracellular resistivity (women: 39
U
cm, men:
Table 1
Medication. Percentage of medication use in 574 non-institutionalized 75-year-old
subjects measured by BIS at Vasa Hospital (V-BIS).
Drugs Women
(n ¼ 345) %
Men
(n ¼ 229) %
Antidiabetic drugs 7 12
Drugs for heart disease, including nitrates 6 11
Antihypertensive drugs 1 2
Diuretics 24 11
Betareceptor-antagonistic drugs 24 27
Calcium-antagonistic drugs 10 14
Drugs affecting the renin–angiotensin system 17 27
Drugs affecting serum lipid levels 19 21
Sex hormones 15 0
Pituitary- and hypothalamic hormones 1 0
Corticosteroids for systemic use 3 2
Thyroid hormone and antithyroid substances 21 3
Cytostatic and cytotoxic drugs 1 1
Drugs for gout 0 4
Analgetics 29 10
Neuroleptics-, sedatives- and sleeping drugs 17 10
Psychoanaleptic drugs, including SSRI 10 5
Drugs for obstructive airway diseases 9 6
Table 2
BMI. Distribution of BMI among 574 non-institutionalized 75-year-old subjects
measured by BIS at Vasa Hospital (V-BIS) and of 98 non-institutionalized 75-year-
old subjects measured by BIS at Sahlgrenska University Hospital (D-BIS).
BMI Women V-BIS
(n ¼ 345) %
Men V-BIS
(n ¼ 229) %
Women D-BIS
(n ¼ 48) %
Men D-BIS
(n ¼ 50) %
<16 0 0 0 0
<18.5 1.2 0 4.2 0
>25 61.4 68.6 60.4 70.0
>30 20.3 16.2 27.1 14.0
>34 5.2 3.1 8.3 0
M. Tengvall et al. / Clinical Nutrition 28 (2009) 52–58 53
40.5
U
cm), Ht is body height (cm), BW is body weight (kg), D is
body density (1.05 kg/l) and K
B
¼ 4.3 is a shape factor.
12
ICW ¼ ECW*
ÂÀÀ
r
TBW
*R
0
Þ
=
À
r
ECW
*R
inf
ÁÁ
ð2=3Þ
À1
Ã
(2)
where total body resistivity
r
TBW
was calculated as
r
TBW
¼
r
ICW
À
À
r
ICW
À
r
ECW
ÞÂ
À
R
inf
=R
0
Á
ð2=3Þ
(3)
and
r
ICW
is intracellular resistivity (women: 264.9
U
cm, men:
273.9
U
cm).
The equation used by the BIS proprietary software to predict
FFM
BIS
is:
FFM
BIS
¼ð
d
ECW
*ECWÞþð
d
ICW
*ICWÞ (4)
where
d
ECW
is 1.106 kg/l and
d
ICW
is 1.521 kg/l.
12
BF
BIS
was calculated
as BW minus FFM
BIS
. In order to compare with previously published
BIA-equations,
4,8
50 kHz-resistance and -reactance values were
calculated from the Cole–Cole model parameters obtained from BIS,
using Matlab (Matlab
Ò
, R2006b, Mathworks). In order to compare
body composition to a previous birth cohort, FFM and fatness
(percentage body fat) were also calculated according to the BIA
FFM-equation used by Dey et al.
1
2.4. Dual-energy X-ray absorptiometry
DXA was performed by a Lunar Prodigy scanner (Scanex, Hel-
singborg, Sweden). Whole body scans were performed and BF
DxA
,
LST and BMC were analysed (software version 8.70.005). FFM
DxA
was defined as the sum of LST and BMC. ALST
DxA
was defined as the
sum of LST in arms and legs.
11
TBSMM
DxA
was calculated as
(TBSMM
DxA
¼ (1.19 Â ALST
DxA
) À 1.65) according to model 1 by Kim
et al.
11
The precision of the DXA equipment was estimated from
repeated measurements on different days in 9 subjects with coef-
ficients of variation of BMC 1.1%, LST 1.1% and BF
DxA
2.4%.
2.5. Statistics
SPSS (SPSS, 14.0 and 16.0 for Windows, SPSS Inc.) was used for
all statistical analysis, except PRESS and 50 kHz (resistance and
reactance)-values which were calculated in Matlab (Matlab
Ò
,
R2006b, Mathworks). A p-value 0.05 was considered significant.
The descriptive statistics are presented as mean, standard deviation
(SD) and percentiles (5% and 95%). Differences between methods
were examined by paired samples t test. Differences between
groups were examined by independent samples t test. All t tests
were adjusted using Bonferroni correction.
14
The relationship
between differences in FFM and TBSMM respectively, measured by
DXA and BIS and other variables were examined by scatter-dot
graphs and linear regression. Stepwise multiple regression was
used to predict TBSMM from BIS, validated against DXA. The
developed muscle equations were cross-validated with PRESS
statistics. In PRESS, each subject in the total data set is excluded,
one at a time, and a regression analysis is performed. The value for
each omitted subject is predicted, and the difference from the
Table 3
Body composition by BIS. Anthropometrical data and body composition estimates of a population-based sample of 574 75-year-old subjects measured by BIS at Vasa Hospital
(V-BIS) and of a validation subgroup of 98 non-institutionalized 75-year-old subjects measured by BIS at Sahlgrenska University Hospital (D-BIS). FFMI
BIS
¼ fat free mass index.
SMMI
BIS
¼ skeletal muscle mass index, calculated as TBSMM
noBW
/(height in m
2
). BFI
BIS
¼ body fat index. Mean (SD) and percentiles.
Women
(n ¼ 345)
V-BIS Population
sample
Men
(n ¼ 229)
V-BIS Population
sample
Women
(n ¼ 48)
D-BIS Validation
subgroup
Men
(n ¼ 50)
D-BIS Validation
subgroup
Mean (SD) Perc. 5 Perc. 95 Mean (SD) Perc. 5 Perc. 95 Mean (SD) Perc. 5 Perc. 95 Mean (SD) Perc.5 Perc. 95
Height (cm) 161 (6.1) 151 171 175 (6.4) 164 185 162 (6.6) 149 173 175 (6.6) 165 189
Weight (kg) 69.2 (12.2) 51.4 90.7 82.1 (12.7) 61.8 106.6 70.9 (14.1) 52.3 97.5 82.0 (11.4) 62.2 102.5
BMI (kg/m
2
) 26.5 (4.5) 20.3 34.6 26.9 (3.7) 21.5 33.2 27.0 (5.0) 18.8 36.3 26.6 (3.0) 20.7 32.3
FFM
BIS
(kg) 40.6 (6.1) 31.1 50.9 55.8 (8.5) 42.9 71.3 41.7 (7.2) 31.8 55.5 57.7 (9.4) 41.5 74.4
BF
BIS
(kg) 28.6 (8.5) 15.7 43.5 26.3 (8.5) 14.0 39.2 29.2 (8.8) 17.1 45.7 24.3 (6.3) 14.0 35.8
FFMI
BIS
(kg/m
2
) 15.6 (2.2) 12.1 19.5 18.3 (2.5) 4.2 22.9 15.9 (2.5) 11.9 21.0 18.7 (2.4) 14.2 23.0
Fatness
BIS
(%) 40.7 (6.8) 28.4 50.7 31.7 (7.3) 19.5 43.6 40.6 (5.9) 30.9 50.2 29.6 (6.4) 20.4 40.7
BFI
BIS
(kg/m
2
) 11.0 (3.2) 6.1 16.4 8.6 (2.7) 4.7 12.4 11.1 (3.2) 6.1 16.9 7.9 (2.1) 4.6 10.9
TBSMM
noBW
(kg) 17.4 (2.9) 12.4 21.7 26.3 (3.0) 20.8 31.0 18.1 (3.2) 13.2 23.9 27.2 (3.4) 21.8 33.2
SMMI
BIS
(kg/m
2
) 6.6 (0.9) 5.1 7.9 8.6 (0.7) 7.5 9.6 6.9 (0.9) 5.5 8.3 8.8 (0.6) 7.5 9.6
Re (ohm) 679 (73) 564 803 574 (73) 459 701 638 (70) 532 766 539 (63) 430 648
Ri (ohm) 1600 (289) 1160 2147 1308 (242) 935 1750 1581 (284) 1122 2073 1261 (231) 959 1811
Phase angle 5.19 (0.62) 4.23 6.23 5.54 (0.62) 4.45 6.66 5.06 (0.63) 4.22 6.39 5.49 (0.60) 4.54 6.58
ECW (l) 14.1 (1.8) 11.2 16.9 19.1 (2.6) 14.6 24.2 14.8 (2.2) 11.5 19.5 20.0 (2.8) 15.6 25.3
ICW (l) 16.5 (3.0) 12.0 21.4 22.8 (4.0) 16.9 29.9 16.7 (3.4) 11.8 23.6 23.4 (4.3) 16.0 31.0
ECW/ICW 0.87 (0.10) 0.69 1.05 0.84 (0.09) 0.69 1.01 0.90 (0.10) 0.71 1.08 0.86 (0.08) 0.73 1.02
Table 4
Body composition in elderly. Comparison of body composition in 5 elderly pop-
ulations, presented as mean (SD).
n Weight (kg) BMI FFM (kg) BF (kg) Fatness (%)
H75/1930
a
Women 345 69.2 (12.2) 26.5 (4.5) 40.6 (6.1) 28.6 (8.5) 40.7 (6.8)
Men 229 82.1 (12.7) 26.9 (3.7) 55.8 (8.5) 26.3 (8.5) 31.7 (7.3)
H75/1930: FFM-Dey
b
Women 345 69.2 (12.2) 26.5 (4.5) 43.9 (4.2) 25.2 (9.1) 35.4 (7.2)
Men 229 82.1 (12.7) 26.9 (3.7) 58.6 (6.2) 23.5 (8.7) 27.9 (6.6)
NORA75/1915-16
c
Women 138 65.3 (10.3) 25.4 (3.6) 42.5 (4.0) 22.8 (7.2) 34.1 (6.1)
Men 115 77.8 (10.4) 25.7 (3.1) 56.1 (4.7) 21.7 (7.1) 27.3 (6.0)
NHANES III
d
Women 538 67.1 (14.5) 26.7 (5.3) 42.3 (6.5) 24.8 (9.3) 35.9 (6.9)
Men 447 79.3 (13.3) 26.7 (4.0) 59.1 (8.6) 20.3 (6.8) 25.1 (5.5)
Geneva
e
Women 198 64.8 (10.9) 25.9 (4.2) 41.0 (4.9) 23.7 (7.2) 35.9 (5.7)
Men 148 75.1 (10.4) 25.5 (3.3) 56.3 (5.9) 18.8 (6.0) 24.6 (5.1)
Italy DXA
f
Women 267 62.2 (7.9) 25.9 (3.0) 38.6 (4.2) 23.1 (5.5) 36.6 (5.5)
Men 78 77.0 (7.0) 26.8 (2.1) 55.9 (4.3) 20.2 (4.0) 26.0 (3.7)
a
Body composition measured by BIS in Swedish 75-year olds born 1930.
b
Body composition measured by BIS in Swedish 75-year olds born 1930; calcu-
lated according to the FFM SF-BIA equation used in the Swedish NORA75 cohort.
1
c
Body composition measured by BIA in Swedish 75-year olds born 1915–16.
1
d
Body composition measured by BIA in Ame rican non-Hispanic white 70–
80-year olds.
19
e
Body composition measured by BIA in Swiss 70–79-year olds, calculated
according to Geneva equations.
21
f
Body composition measured by DXA in an Italian nationally representative
cohort aged 70–80 year.
22
M. Tengvall et al. / Clinical Nutrition 28 (2009) 52–5854
observed value is the PRESS residual. The sum of squares of the
PRESS residuals yields the PRESS statistic.
15
R
pred
2
from PRESS gives
information about the regression equation’s predictive capacity; i.e.
R
pred
2
will explain the expected variability in prediction of new
observations.
16
R
2
represents the coefficient of determination for
the regression equation among the observed subjects. SSE is the
sum of squares of the error for the equation. Furthermore, results
calculated from the developed equations were compared to each
other with paired samples t test. Systematic differences between
TBSMM
DxA
and BIS regression equations, FFM
DxA
and FFM
BIS
and
BF
DxA
and BF
BIS
were examined by Bland–Altman plots.
17
3. Results
3.1. Body composition measured by BIS
A summary of average body composition data for the cohort
with 574 subjects and the subset with 98 subjects is presented in
Table 3. Estimates of body composition calculated according to
a previously used BIA FFM prediction equation
1
are presented in
Table 4.
3.2. Diuretics
Average BMI was significantly higher among the subjects with
use of diuretics (27.8) compared to subjects without diuretics
(26.4). There were no significant differences in ECW, ICW or FFM
BIS
between the groups (n ¼ 574).
3.3. Comparing body composition measured by BIS and DXA
Body composition measured by DXA is presented in Table 5.
Average FFM
BIS
did not differ from FFM
DxA
(Table 6), neither when
analysed in subgroups with (n ¼ 14, p ¼ 0.58) or without (n ¼ 71,
p ¼ 0.24) use of diuretics. Average difference of FFM
DxA
minus
FFM
BIS
was 0.62 kg for women and 0.56 kg for men. There was
a strong significant correlation between FFM
DxA
and FFM
BIS
,
R ¼ 0.93, SEE ¼ 4.4 kg. However, the Bland–Altman plot revealed
a slight but statistically significant systematic tendency of BIS to
increase FFM bias with increasing FFM values (Fig. 1a). A higher
ECW/ICW-ratio (R ¼ 0.63), Ri (R ¼ 0.65) or a lower BMI (R ¼ 0.53) or
C
m
(R ¼ 0.61), increased the underestimation of FFM from BIS.
Average BF
BIS
did not differ from BF
DxA
(Table 6 ). Average difference
of BF
DxA
minus BF
BIS
was À0.97 kg for women and À0.40 kg for
men. However, the Bland–Altman plot revealed a significant small
systematic negative bias (Fig. 1b), reciprocal to the FFM
BIS
bias.
3.4. Skeletal muscle mass estimates
SMM
Janssen
overestimated TBSMM compared to DXA (Table 6).
Also, ASMM
Kyle
overestimated ALST compared to DXA (Table 6).
3.5. BIA and BIS prediction equations of TBSMM
The electrical parameters of the BIS measurements (Re, Ri and
C
m
) were entered in the model for TBSMM
BW
and TBSMM
noBW
, but
C
m
was found not to be significant.
BIA- and BIS-equations:
1. TBSMM
50 kHz
¼À24.021 þ (0.33  Ht) þ (À0.031  R
50 kHz
)
þ (0.083 Â Xc
50 kHz
) þ (À1.58 Â gender) þ (0.046 Â BW)
2. TBSMM
BW
¼À23.953 þ (0.333  Ht) þ (À0.004  Ri) þ
(À0.010 Â Re) þ (À1.727 Â gender) þ (0.042 Â BW)
3. TBSMM
noBW
¼À24.05 þ (0.365  Ht) þ (À0.005  Ri) þ
(À0.012*Re) þ (À1.337*gender)
Ht: height in cm. Gender: women ¼ 1, men ¼ 0.
For regression model summary and PRESS statistics, see Table 7.
Average differences for the equations compared to TBSMM
DxA
were
0.17 kg/À0.10 kg/0.22 kg for TBSMM
50 kHz/BW/noBW
respectively
(Table 8). Bland–Altman plots did not reveal any significant
systematic bias for any of the three equations ( Fig. 1c-e). When
applied to the group with 574 subjects (Table 9 ), there were small
but mostly significant differences between the developed equa-
tions. TBSMM
noBW
and SMM
Janssen
differed significantly. There were
no systematic biases found when differences between TBSMM
DxA
and TBSMM
noBW
and single predictors (BMI, Re, Ri, C
m
, ECW, ICW,
alfa, Td, Fc, ECW/ICW, FMI
DxA
) were examined by scatter-dot graphs
and linear regression.
Table 5
Bodycomposition by DXA.Results ofDXA measured in 98 non-institutionalized 75-year-oldsubjects. FFMI
DxA
¼ fat freemass index. BFI
DxA
¼ body fatindex. ALST
DxA
¼ appendicular
lean soft tissue. TBSMM
DxA
¼ total body skeletal muscle mass, calculated as 1.19 Â ALST
DxA
À 1.65.
11
SMMI
DxA
¼ skeletal muscle mass index, calculated as TBSMM
DxA
/(height inm
2
).
FFM
DxA
(kg)
BF
DxA
(kg)
Fatness
DxA
(%)
FFMI
DxA
(kg/m
2
)
BFI
DxA
(kg/m
2
)
ALST
DxA
(kg)
TBSMM
DxA
(kg)
SMMI
DxA
(kg/m
2
)
Women (n ¼ 48)
Mean (SD) 42.4 (5.2) 28.2 (10.5) 38.8 (8.1) 16.1 (1.3) 10.8 (3.9) 16.8 (2.3) 18.4 (2.7) 7.0 (0.7)
Percentiles 5 34.2 10.4 19.9 14.2 3.6 12.5 13.2 5.7
Percentiles 95 53.1 45.7 49.5 19.2 17.3 21.0 23.3 8.2
Men (n ¼ 50)
Mean (SD) 58.2 (7.9) 23.9 (6.8) 28.8 (6.3) 18.9 (1.7) 7.8 (2.3) 24.4 (3.6) 27.4 (4.3) 8.9 (1.0)
Percentiles 5 46.7 10.8 17.3 15.8 3.6 18.4 20.3 6.8
Percentiles 95 74.6 35.7 40.9 21.9 11.5 30.9 35.2 10.2
Table 6
Comparison of BIS and DXA. Differences of FFM and BF measured by DXA and BIS,
BIA skeletal muscle mass estimates
4,8
and muscle mass measured byDXA, in 98 non-
institutionalized 75-year-old subjects, compared with paired samples t test.
ALST
DxA
¼ appendicular lean soft tissue. TBSMM
DxA
¼ total body skeletal muscle
mass, calculated as 1.19 Â ALST
DxA
À 1.65.
11
ns ¼ Non-significant.
Mean (SD) p-value
Women (n ¼ 48)
FFM
DxA
minus
FFM
BIS
(kg)
0.62 (4.10) ns
BF
DxA
minus BF
BIS
(kg)
À0.97 (4.12) ns
TBSMM
DxA
minus
SMM
Janssen
(kg)
À1.02 (1.39) <0.03
ALST
DxA
minus
ASMM
Kyle
(kg)
À0.64 (1.41) 0.01
Men (n ¼ 50)
FFM
DxA
minus
FFM
BIS
(kg)
0.56 (4.62) ns
BF
DxA
minus BF
BIS
(kg)
À0.40 (4.60) ns
TBSMM
DxA
minus
SMM
Janssen
(kg)
À4.05 (2.22) <0.03
ALST
DxA
minus
ASMM
Kyle
(kg)
À1.23 (1.63) <0.03
M. Tengvall et al. / Clinical Nutrition 28 (2009) 52–58 55
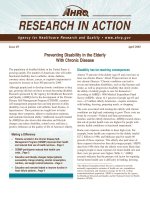
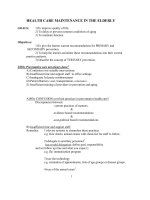
Fig. 1. (a) Bland–Altman plot comparing FFM
DxA
and FFM
BIS
in 98 non-institutionalized 75-year-old subjects. Horizontal line ¼ mean difference (kg). Dotted lines ¼Æ2 SD.
Regressionline: difference between FFM
DxA
minus FFM
BIS
as dependent variable and mean of FFM
DxA
and FFM
BIS
as independent variable. Regressionline: R ¼ 0.27, p ¼ 0.007. (b)
Bland–Altman plot comparing BF
DxA
and BF
BIS
in 98 non-institutionalized 75-year-old subjects. Horizontal line ¼ mean difference (kg). Dotted lines ¼Æ2 SD. Regressionline:
difference between BF
DxA
minus BF
BIS
as dependent variable and mean of BF
DxA
and BF
BIS
as independent variable. Regressionline: R ¼ 0.26, p ¼ 0.009. (c) Bland–Altman plot
comparing TBSMM
DxA
and equation TBSMM
50 kHz
in 98 non-institutionalized 75-year-old subjects. Horizontal line ¼ mean difference (kg). Dotted lines ¼Æ2 SD. Regressionline:
difference between TBSMM
DxA
and TBSMM
50 kHz
as dependent variable and mean value of TBSMM
DxA
and TBSMM
50 kHz
as independent variable. R ¼ 0.13, p ¼ 0.21. (d) Bland–
Altman plot comparing TBSMM
DxA
and equation TBSMM
BW
in 98 non-institutionalized 75-year-old subjects. Horizontal line ¼ mean difference (kg). Dotted lines ¼Æ2 SD.
Regressionline: difference between TBSMM
DxA
and TBSMM
BW
as dependent variable and mean value of TBSMM
DxA
and TBSMM
BW
as independent variable. R ¼ 0.15, p ¼ 0.15. (e)
Bland–Altman plot comparing TBSMM
DxA
and equation TBSMM
noBW
in 98 non-institutionalized 75-year-old subjects. Horizontal line ¼ mean difference (kg). Dotted lines ¼Æ2
SD. Regressionline: difference between TBSMM
DxA
and TBSMM
noBW
as dependent variable and mean value of TBSMM
DxA
and TBSMM
noBW
as independent variable. R ¼ 0.11,
p ¼ 0.29.
M. Tengvall et al. / Clinical Nutrition 28 (2009) 52–5856
4. Discussion
We found BIS, using Xitron equations, to be valid for estimating
average FFM in non-institutionalized elderly Swedes when
compared to DXA. However, previously published BIA prediction
equations for SMM
4,8
were found not to be valid in this cohort. New
BIS muscle mass equations could successfully predict average
TBSMM, although with substantial individual variation.
4.1. Study limitations
We included subjects regardless of BMI, although BIA has only
been shown to be valid up to BMI 34, according to a recent review.
3
The disproportion between body mass and body conductivity
lowers the accuracy of BIA in obesity.
3
FFM in obese subjects might
be overestimated by BIA.
18
However, a purpose of this study was to
be representative for the elderly population, and hence the 29
obese subjects with BMI > 34 were included. No technical problems
were encountered with the DXA examinations among subjects with
BMI > 34.
4.2. Body composition in the elderly
We have previously validated SF-BIA against a four-compart-
ment model (4-C model) based on TBK and TBW in a random
sample of 75-year-old subjects born 1915–16 from the NORA75
cohort.
1
In the 1915–16 cohort, women had higher average fatness
than men, 34% and 27% respectively.
1
The difference in fatness
between genders was confirmed in this report, the BIS average
values reported here were 41% and 32%, in women and men
respectively (Table 4). However, when the current measurements
were calculated according to the FFM-equation used in the NORA75
cohort (FFM
Dey
), average FFM was significantly higher (Table 4).
Furthermore, average fatness was more in agreement with the
1915–16 cohort. Thus, non-institutionalized elderly Swedes appear
well-nourished, with a trend of increasing BW and BMI.
The NHANES III study
19
reported a US nationally representative
study of body composition, measured by SF-BIA in 1988–94, using
prediction equations for FFM and TBW validated against isotope
dilution and a multi-compartment model.
20
The subgroup non-
Hispanic white 70–80-year olds can be compared to the present
study (Table 4). Compared to the US study, our subjects had similar
average BMI, lower FFM and thus higher fatness in both genders.
In a non-randomly selected Swiss population with healthy 70–
79-year olds, average FFM and fatness was 41 kg and 36% for
women and 56 kg and 25% for men
21
(Table 4), calculated with BIA
Geneva equations previously validated against DXA. Compared to
the Swiss study,
21
our subjects had higher average BW, slightly
higher BMI, higher fatness, and quite similar FFM.
A recent Italian study reported nationally representative refer-
ence values of body composition measured by DXA in a selected
population
22
(Table 4). Compared to our DXA cohort, average BMI
for women aged 70–80 years was slightly lower but similar for men.
Both Italian genders had lower average fatness and body fat index
(BFI) (women 9.6 and men 7.1). Average fat free mass index (FFMI)
was similar for women and slightly higher for Italian men.
The differences in body composition in the Swiss, American,
Italian and Swedish studies could possibly be explained by different
selection of subjects, different reference methods, different BIA/BIS
prediction equations or changes in lifestyle. A strength of the
present study is that it is based on a population sample and the
subjects are representative for their age.
4.3. BIS and DXA for assessment of body composition in the elderly
Average FFM
BIS
was in agreement with FFM
DxA
, but with a small
systematic positive bias, although large individual variation was
observed. Average BF
BIS
was also in agreement with BF
DxA
, but as
expected with a small systematic negative bias, reciprocal to FFM
BIS
bias.
4.4. Muscle mass prediction
Previously published BIA-equations
4,8
overestimated skeletal
muscle mass in our subjects. The overestimations were larger for
men than for women for both equations, and particularly for
SMM
Janssen
. This could be due to the fact that both muscle mass
estimates were developed to include a wide range of ages, perhaps at
the cost of less accuracy among the elderly. Average age for the
population that generated SMM
Janssen
was 42 years. Kyle et al. did not
report average age, but 48% were >55-year-old.
4
Hence, we found it
necessary to develop an age-specific TBSMM BIS prediction equa-
tion. Usually, a combination of impedance and anthropometrics are
used as predictors in body composition equations.
15
We developed
three TBSMM-equations; one using the same independent predic-
tors as Kyle and Janssen
4,8
and two using BIS measurements, i.e. the
first one corresponding to SF-BIA. The trunk has limited impact on
whole body impedance although it constitutes about 50% of BW.
2
Thus, changes in FFM in the trunk are probably inadequately
detected by whole body impedance, although it contributes to BW.
2
Furthermore, healthy subjects, and especially patients may have
different proportions between trunk and extremities. Hence,
excluding BW as TBSMM predictor might reduce that source of bias.
Table 7
TBSMM prediction equations. Regression model summary and results of PRESS
(predictive residual sum of squares) statistics for BIS TBSMM prediction equations,
developed by stepwise multiple regression in 98 non-institutionalized 75-year-old
subjects.
RR
2
SEE (kg) SSE PRESS R
pred
2
TBSMM
50 kHz
0.96 0.93 1.59 231.4 265.9 0.92
TBSMM
BW
0.96 0.93 1.60 235.6 270.5 0.92
TBSMM
noBW
0.96 0.92 1.64 249.6 278.7 0.91
Table 8
BIS prediction equations and DXA. Comparison of TBSMM measured by DXA and
calculated from BIS prediction equations in 98 non-institutionalized 75-year-old
subjects.
All subjects (n ¼ 98) Mean (SD) (kg) Min. (kg) Max. (kg)
TBSMM
DxA
minus TBSMM
50 kHz
0.17 (1.54) À4.28 4.20
TBSMM
DxA
minus TBSMM
BW
À0.10 (1.56) À4.67 3.62
TBSMM
DxA
minus TBSMM
noBW
0.22 (1.61) À4.70 4.49
Women (n ¼ 48)
TBSMM
DxA
minus TBSMM
50 kHz
0.18 (1.16) À1.64 2.91
TBSMM
DxA
minus TBSMM
BW
À0.10 (1.17) À2.17 2.60
TBSMM
DxA
minus TBSMM
noBW
0.26 (1.24) À1.95 3.20
Men (n ¼ 50)
TBSMM
DxA
minus TBSMM
50 kHz
0.16 (1.85) À4.28 4.20
TBSMM
DxA
minus TBSMM
BW
À0.09 (1.87) À4.67 3.62
TBSMM
DxA
minus TBSMM
noBW
0.18 (1.90) À4.70 4.49
Table 9
Comparison of BIS prediction equations. Comparison with paired samples t test of
BIS TBSMM prediction equations when applied to 574 non-institutionalized 75-
year-old subjects. ns ¼ Non-significant.
Women
(n ¼ 345)
p-value Men
(n ¼ 229)
p-value
Mean (kg) (SD) Mean (kg) (SD)
TBSMM
50 kHz
minus TBSMM
BW
À0.47 (0.41) <0.03 -0.32 (0.24) <0.03
TBSMM
50 kHz
minus TBSMM
noBW
À0.07 (0.67) ns 0.09 (0.54) 0.04
TBSMM
noBW
minus TBSMM
BW
À0,40 (0.46) <0.03 -0.41 (0.44) <0.03
M. Tengvall et al. / Clinical Nutrition 28 (2009) 52–58 57
Comparison of the three developed TBSMM prediction equa-
tions resulted in mostly significant but small average differences.
Thus, there seems to be neither any advantage nor any disadvantage
to predict muscle mass from SF-BIA compared to BIS in our subjects.
The two equations that included BIS measurements (TBSMM
BW
and
TBSMM
noBW
) gave slightly different results. However, this differ-
ence is of doubtful importance in clinical practise. Thus, the inclu-
sion of BW as an independent predictor of TBSMM will only slightly
increase the degree of explanation, and it might lower the accuracy
in patients with altered body proportions. SEE for the three devel-
oped equations were quite similar. Furthermore, R
2
and R
pred
2
for all
three equations were high and very similar. Hence, we suggest to
use the equation TBSMM
noBW
in future studies.
In conclusion, elderly Swedes have average BMI corresponding to
overweight, and also higher than an earlier Swedish cohort. BIS can
be used to evaluate average FFM and BF in the elderly, though a small
systematic bias was found. Average TBSMM among elderly can be
predicted from BIS, although with substantial individual variation.
Conflict of interest
The authors have no conflict of interest.
Acknowledgements
This study was part of the Geriatric and Gerontologic Population
Studies and the Population Study of Women in Go
¨
teborg. These
studies are supported by grants from the Swedish Research Council,
the Swedish Council for Working Life and Social Research, the Bank
of Sweden Tercenary Fund, funding from FAS (2007-1506) and the
Medical faculty at the Sahlgrenska Academy at University of
Gothenburg.
The coauthors in this paper have contributed as follows: Marja
Tengvall analysed data and wrote the manuscript, Lars Ellegård
contributed to analysing data and writing the manuscript, Vibeke
Malmros performed the examinations, Niklas Bosaeus made
possible the compilation of epidemiological and impedance data,
Lauren Lissner was responsible for the Geriatric and Gerontologic
Population Studies and the Population Study of Women in Go
¨
te-
borg and contributed to study design and writing of the manu-
script, Ingvar Bosaeus initiated and designed the present study and
contributed to analysing data and writing the manuscript.
References
1. Dey DK, Bosaeus I, Lissner L, Steen B. Body composition estimated by
bioelectrical impedance in the Swedish elderly. Development of population-
based prediction equation and reference values of fat-free mass and body fat
for 70- and 75-y olds. Eur J Clin Nutr 2003;57(8):909–16.
2. Kyle UG, Bosaeus I, De Lorenzo AD, Deurenberg P, Elia M, Gomez JM, et al.
Bioelectrical impedance analysis – part I: review of principles and methods.
Clin Nutr 2004;23(5):1226–43.
3. Kyle UG, Bosaeus I, De Lorenzo AD, Deurenberg P, Elia M, Gomez JM, et al.
Bioelectrical impedance analysis-part II: utilization in clinical practice. Clin Nutr
2004;23(6):1430–53.
4. Kyle UG, Genton L, Hans D, Pichard C. Validation of a bioelectrical impedance
analysis equation to predict appendicular skeletal muscle mass (ASMM). Clin
Nutr 2003;22(6):537–43.
5. Gallagher D, Ruts E, Visser M, Heshka S, Baumgartner RN, Wang J, et al. Weight
stability masks sarcopenia in elderly men and women. Am J Physiol Endocrinol
Metab 2000;279(2):E366–75.
6. Bartok C, Schoeller DA. Estimation of segmental muscle volume by bioelectrical
impedance spectroscopy. J Appl Physiol 2004;96(1):161–6.
7. Kaysen GA, Zhu F, Sarkar S, Heymsfield SB, Wong J, Kaitwatcharachai C, et al.
Estimation of total-body and limb muscle mass in hemodialysis patients by
using multifrequency bioimpedance spectroscopy. Am J Clin Nutr 2005;82(5):
988–95.
8. Janssen I, Heymsfield SB, Baumgartner RN, Ross R. Estimation of skeletal
muscle mass by bioelectrical impedance analysis. J Appl Physiol 2000;89(2):
465–71.
9. Macdonald JH, Marcora SM, Jibani M, Roberts G, Kumwenda MJ, Glover R, et al.
Bioelectrical impedance can be used to predict muscle mass and hence improve
estimation of glomerular filtration rate in non-diabetic patients with chronic
kidney disease. Nephrol Dial Transplant 2006;21(12):3481–7.
10. Heymsfield SB, Smith R, Aulet M, Bensen B, Lichtman S, Wang J, et al. Appen-
dicular skeletal muscle mass: measurement by dual-photon absorptiometry.
Am J Clin Nutr 1990;52(2):214–8.
11. Kim J, Heshka S, Gallagher D, Kotler DP, Mayer L, Albu J, et al. Intermuscular
adipose tissue-free skeletal muscle mass: estimation by dual-energy X-ray
absorptiometry in adults. J Appl Physiol 2004;97(2):655–60.
12. Xitron. Xitron Hydra ECF/ICF (Model 4200) Bio-impedance spectrum analyzer.
Issue 1.01 6/97. Operating manual revision 1.01. San Diego, USA: Xitron Tech-
nologies, Inc.; 1997.
13. Matthie JR. Second generation mixture theory equation for estimating intra-
cellular water using bioimpedance spectroscopy. J Appl Physiol 2005;99(2):
780–1.
14. Hassard TH. Analysis of variance. In: Kist K, editor. Understanding biostatistics.St
Louis: Mosby Year Book, Inc.; 1991. p. 85.
15. Sun SS, Chumlea WC. Statistical methods. In: Heymsfield SB, Lohman TG,
Wang Z, Going SB, editors. Human body composition. 2nd ed. Champaign, USA:
Human Kinetics; 2005. p. 151–60.
16. Montgomery DC. Design and analysis of experiments. 6th ed. Hoboken, NJ: John
Wiley & Sons, Inc.; 2005.
17. Bland JM, Altman DG. Statistical methods for assessing agreement between two
methods of clinical measurement. Lancet
1986;1(84
76):307–10.
1
8.
Baumgartner RN, Ross R, Heymsfield SB. Does adipose tissue influence
bioelectric impedance in obese men and women? J Appl Physiol 1998;84(1):
257–62.
19. Chumlea WC, Guo SS, Kuczmarski RJ, Flegal KM, Johnson CL, Heymsfield SB,
et al. Body composition estimates from NHANES III bioelectrical impedance
data. Int J Obes Relat Metab Disord 2002;26(12):1596–609.
20. Sun SS, Chumlea WC, Heymsfield SB, Lukaski HC, Schoeller D, Friedl K, et al.
Development of bioelectrical impedance analysis prediction equations for body
composition with the use of a multicomponent model for use in epidemiologic
surveys. Am J Clin Nutr 2003;77(2):331–40.
21. Kyle UG, Genton L, Lukaski HC, Dupertuis YM, Slosman DO, Hans D, et al.
Comparison of fat-free mass and body fat in Swiss and American adults.
Nutrition 2005;21(2):161–9.
22. Coin A, Sergi G, Minicuci N, Giannini S, Barbiero E, Manzato E, et al. Fat-free
mass and fat mass reference values by dual-energy X-ray absorptiometry
(DEXA) in a 20–80 year-old Italian population. Clin Nutr 2008;27(1):87–94.
M. Tengvall et al. / Clinical Nutrition 28 (2009) 52–5858