Antibody response to influenza vaccination in the elderly: A quantitative review doc
Bạn đang xem bản rút gọn của tài liệu. Xem và tải ngay bản đầy đủ của tài liệu tại đây (314.24 KB, 11 trang )
Vaccine 24 (2006) 1159–1169
Antibody response to influenza vaccination in the elderly:
A quantitative review
Katherine Goodwin
a
,C
´
ecile Viboud
b
, Lone Simonsen
a,∗
a
National Institutes of Allergy and Infectious Diseases, Office of Global Affairs, 6610 Rockledge Drive, Room 2033, Bethesda, MD 20818, USA
b
Fogarty International Center, National Institutes of Health, Bethesda, MD, USA
Received 2 June 2005; received in revised form 17 August 2005; accepted 26 August 2005
Available online 19 September 2005
Abstract
We performed a quantitative review of 31 vaccineantibody response studiesconducted from 1986to 2002 and compared antibody responses
to influenza vaccine in groups of elderly versus younger adults. We did a weighted analysis of the probability of vaccine response (measured
as seroconversion and seroprotection) for each vaccine component (H1, H3 and B antigens). Using a multiple regression model, we adjusted
for factors that might affect the vaccine response. The adjusted odds-ratio (OR) of responses in elderly versus young adults ranged from 0.24
to 0.59 in terms of seroconversion and seroprotection to all three antigens. The CDC estimates of 70–90% clinical vaccine efficacy in young
adults and these estimates suggest a corresponding clinical efficacy in the elderly of 17–53% depending on circulating viruses. We conclude
that the antibody response in the elderly is considerably lower than in younger adults. This highlights the need for more immunogenic vaccine
formulations for the elderly.
© 2005 Elsevier Ltd. All rights reserved.
Keywords: Influenza vaccine; Antibodies; Aging/immunology; Review
1. Introduction
Influenza is an increasingly common cause of hospitaliza-
tion and death in the elderly [1]. In recent severe, influenza
A/H3N2-dominated seasons, there were as many as 60,000
influenza-related deaths among persons over 65 years of age,
and the majority of these were among persons aged 75 and
older [2]. The current public health strategy for influenza
is to reduce severe outcomes such as hospitalizations and
deaths, by recommending annual vaccination for people at
elevated risk for such outcomes, including all persons over
the ageof 65 [3]. Observationalstudies suggest that influenza
vaccination is associated with enormous reductions in all
winter mortality among the elderly [4] but such studies may
Abbreviations: Ab, antibodies; GMT, geometric mean titre; HI, heam-
agglutinin inhibition; OR, odds-ratio; CDC, Centers for Disease Control and
Prevention; WHO, World Health Organization
∗
Corresponding author. Tel.: +1 301 402 8487; fax: +1 301 480 2954.
E-mail address: (L. Simonsen).
be subject to self-selection bias and overestimation of vac-
cine benefits [2]. However, because immune responses in the
elderly are known to be less vigorous than in younger adults,
there has long been concern about whether the vaccine offers
sufficient protection in this age group [5,6].
In 1989, Beyer et al. published a review of studies that
compared antibody responses to influenza vaccination in the
elderly to those of younger adults [7]. Of the 30 independent
studies reviewed, the authors found that 10 reported a better
immune response in the young, 4 reported a better response
in the elderly, and 16 did not find a significant difference
between the two groups. The authors concluded that several
important factors, such as serious illnesses among study par-
ticipants, use of medications that inhibit immune responses,
previous influenza vaccination, and the presence of high pre-
vaccinationantibodytitres,couldnotbe controlled forintheir
review. They suggested that future studies exclude subjects
for whom these factors exist. Since the 1989 review, several
published studies have investigated the effects of these con-
founding factors.
0264-410X/$ – see front matter © 2005 Elsevier Ltd. All rights reserved.
doi:10.1016/j.vaccine.2005.08.105
1160 K. Goodwin et al. / Vaccine 24 (2006) 1159–1169
Table 1
Description of adjustment factors suspected to affect vaccine antibody response and considered in multivariate analyses
Adjustment factors Definition Analysis
Living situation Community living: elderly live independently in the community Dichotomous; omitting ‘mixed’ residence
Institutional living: elderly live in an institution and are dependent on care
Mixed living: elderly live in either an institution or in the community
SENIEUR Protocol SENIEUR Protocol: excluded subjects based on SENIEUR protocol or
those with chronic diseases
Dichotomous
Non-SENIEUR Protocol: applied other, less stringent health criteria, such
as those without immune disease and concurrent illness
Previous vaccination Proportion of subjects previously vaccinated in the group, continuous
variable ranging from 0 and 100%
Dichotomous;
Previously vaccinated: >50% of subject
previously vaccinated;
Previously unvaccinated: <50% of subjects
previously vaccinated
New strain year New: strain was a novel vaccine component that study year, which had not
been used in previous years
Dichotomous
Old: strain had been component in the previous years’ vaccine
Vaccine type Split: split-virus vaccine Trichotomous
Sub-u: sub-unit or sub-virosomal vaccine
Whole: whole-virus vaccine
Dosage Continuous variable 10–50g for each vaccine component H1, H3, and B Dichotomous
Regular dose: ≤15 g
High Dose: >15 g
High pre-titre Continuous variables; values from seroprotection data measured before
vaccination, ranging from:
Dichotomous
H1N1: 0–82% H1N1
H3N2: 0–94% High Pre-titre: % subjects seroprotected
pre-vaccination>25%
B: 0–93.7% Low Pre-titre: % subjects seroprotected
pre-vaccination<25%
H3N2 and B
High Pre-titre: % subjects seroprotected
pre-vaccination>30%
Low Pre-titre: % subjects seroprotected
pre-vaccination<30%
We conducted a quantitative review of these more recent
papers. In particular, we compared the vaccine responses in
the elderly tothose of controlgroups of youngeradults.Addi-
tionally, we compared responses in the younger elderly to
the very elderly to further gain insights into the impact of
age and vaccine response. We controlled for every factor for
which we could obtain data that may have had an impact on
vaccineresponse, including living situation(institutionalized
or community living), medical history, vaccine-specific
factors such as antigen dose and route of administra-
tion, as well as all those suggested in the 1989 review
(Tables 1 and 2).
2. Materials and methods
2.1. Source of literature
Published papers from 1989 onwards that evaluated the
antibody response to the influenza vaccine in the elderly
were identified through a MEDLINE search using the terms
“influenza”, “vaccine”, “vaccination”, “elderly”, “antibody
response” and “humoral response”. We used Pubmed’s
Related Article feature and reviewed bibliographies of rel-
evant studies to identify additional articles. Only studies
available through Pubmed and published in English were
considered. We used several inclusion criteria based on the
study design and vaccine response measurements as detailed
below.
2.2. Measurements of immune response
Haemagglutinin inhibition (HI) IgG antibody titre is the
most established correlate with vaccine protectiveness [8,9].
We studied three standard measures of vaccine response:
1. Seroconversion—the percentage of subjects with a 4-fold
increase in antibody titres.
2. Seroprotection—the percentage of subjects with HI anti-
body titres ≥ 1:40 post-vaccination.
3. Geometric mean titre (GMT) of HI antibody achieved
post-vaccination.
K. Goodwin et al. / Vaccine 24 (2006) 1159–1169 1161
Table 2
Characteristics of immunization studies conducted in the elderly population since 1986 (N =48)
Study design Elderly demographics Adjustment factors
Author
a
Study
Year
b
Co
c
Young control
group under 65
years
No. of
subjects
Age
range
Mean
age
Vaccine
type
d
Vaccine
dosage
(g)
e
SENIEUR
Protocol
f
Vaccination
status prior
to study
g
Living
situation
h
New
strain
year
i
Gross [15] 1986 US 27 65–96 – Split 15 – 0%** M H3, B
Gross [15] 1986 US 113 65–96 – Split 15 – 100%** M H3, B
Palache [12] 1988 NL/IL Y 67 68–99 – Sub-unit 10 – I H3, B
Palache [12] 1988 NL/IL Y 64 68–99 – Sub-unit 20 – I H3, B
Zei [16] 1989 IT Y 24 60–77 70 Split 10 – 82%* C H3, B
Zei [16] 1989 IT Y 60 61–83 68 Sub-unit 10 – 77%* C H3, B
Chernsky [17] 1990 CA 90 >65 73.7 Whole 15 – 88%** C H3
de Bruijn [18] 1990 NL Y 57 – 80 Whole 15 Y 0%* C H3
McElhaney [19] 1990 CA Y 13 60–64 71 Whole 15 – C H3
Remarque [20] 1990 NL Y 55 71–84 79 Whole 15 Y 0%* C H3
de Bruijn [18] 1991 NL Y 55 – 79 Sub-unit 15 Y 0%* C H3, B
Glathe [21] 1991 DE Y 58 – 80 Split 15 – 95%* I H3
Glathe [21] 1991 DE Y 70 – 79 Split 15 – 30%* C H3
Gross [22] 1991 US 30 – 75 – 50 100%** C H3, B
Gross [22] 1991 US 11 85 – 50 100%** I H3, B
Lina [23] 1991 FR Y 54 65–93 79.3 Split 15 100%** C H3
McElhaney [19] 1991 CA Y 26 62–85 72 Split 15 42%* C H3, B
Powers [24] 1991 US Y 17 65–92 79 Sub-unit 15 58.8%* C H3
de Brujin [18] 1992 NL Y 26 – 78 Sub-unit 15 Y 0%* C None
Minutello [25] 1992 IT 46 65–90 73.4 Sub-unit 15 72%* C None
Bernstein [26] 1993 US 233 67–95 80.7 Sub-unit 15 97%* C H3
De Donato [27] 1993 IT 98 64–87 73 Sub-unit 15 86%** C H3
Gardner [28] 1993 US 92 67–91 79.1 Sub-unit 15 – C H3
Lina [23] 1993 FR 119 62–99 85.9 Split 15 84.9%** C H3
Gardner [29] 1994 US Y 61 70–95 81 Sub-unit 15 100%* C H3
Murasko [5] 1994 US Y 270 67–95 80.2 Sub-unit 15 97%* C H3
VanHoecke [30] 1994 SK/HU 457 65–100 79.9 Split 15 – I None
Iorio [31] 1995 IT 51 60–84 73 Sub-unit 15 – 100%* C None
Iorio [31] 1995 IT 80 63–100 80 Sub-unit 15 – 100%* I None
Lina [23] 1995 FR Y 55 60–85 68 Sub-unit 15 89%** C H3, B
Murasko [5] 1995 US Y 258 67–95 78.8 Sub-unit 15 97%* C H3, B
Bridges [32] 1996 US 86 – 82.5 – 15 – 72%* I H3
Murasko [5] 1996 US Y 214 67–95 80.1 Sub-unit – 97%* C H3
Muszkat [33] 1997 IL 62 – 68 Split – 74%* C H1
Muszkat [33] 1997 IL 114 – 81.5 Split 15 98%* I H1
Baldo [34] 1998 IT 93 65–100 – Split 15 81.7%** I H3, B
Baldo [34] 1998 IT 93 65–100 – Sub-unit 15 88.2%** I H3, B
Muszkat [35] 1998 IL 22 60–82 76.5 Split 20 100%* I H1, H3
Pregliasco [36] 1998 IT 33 65–106 – Whole 15 – I H1, H3
Pregliasco [36] 1998 IT 37 65–106 – Sub-unit 15 – I H1, H3
Squarcione [37] 1998 IT 591 >65 73.3 Split 15 – C H1, H3
Stepanova [38] 1998 SE Y 11 58–93 – Sub-unit 15 – 0%** C H1, H3
Brydak [39] 1999 PO Y 45 62–93 77.4 Split 15 – – I None
Belshe [40] 2001 US Y 50 61–91 69.8 – 15 – C B
Frech [41] 2002 CH Y 55 >60 – – 15 – C None
Hara [42] 2002 JP Y 153 66–104 84.4 Split 30 100%** I None
Ruf [43] 2002 DE 273 >60 68.1 Split 15 0%* I None
Ruf [43] 2002 DE 272 >60 67.4 Sub-unit 15 0%* I None
(–) not available, Y =Yes, blank cell=No.
a
First author and reference number.
b
October or November of the study year.
c
Country where the study took place according to International Organization for Standardization abbreviations.
d
Spilt: split-virus vaccine; Sub-u: sub-unit or sub-virosomal vaccine; Whole: whole-virus vaccine.
e
Dosage of each vaccine component, H1, H3, and B.
f
Y: excluded subjects based on SENIEUR protocol; else used less stringent health criteria for inclusion and exclusion in the study.
g
*Percent of elderly having received influenza vaccination in the previous year; **percent of elderly having ever received influenza vaccination.
h
Community living elderly; I: institutionalized elderly; M: mixed, both institutionalized and community living elderly.
i
H1, H3, or B: strain was a novel vaccine component that study year; none: all strains had been components in the previous years’ vaccine.
1162 K. Goodwin et al. / Vaccine 24 (2006) 1159–1169
Only papers reporting either seroconversion, seroprotec-
tion, or GMT results for all three of the currently circulat-
ing influenza (sub)types (A/H1N1, A/H3N2, and B) were
included in our review. If a paper presented data on two
influenzaBstrains,onlythestrainnamedfirst,usuallylabeled
B1, was included. When serological results were only shown
in figures, we carefully read numerical values from the
graphs.
Although the time to peak serum antibody response to
influenza vaccine is not clearly defined, some publications
report the peak occurs between 2 and 6 weeks after vacci-
nation [10,11]. All papers measured antibody responses at
the time of vaccination (pre-titer) and again 2–8 weeks post-
vaccination (post-titer).
2.3. Primary factor of interest: age of study participants
We selected all papers that reported data on groups of
subjects with a mean age of 65 and over. From these papers,
information on younger control groups was included in our
database whenever available. The presence of young control
groups, however, was not a requirement for studies to be
included in this review.
2.4. Adjustment factors
Table 1 describes all the adjustment factors included in
our analysis.
2.4.1. Type, dose and number of shots of inactivated
vaccine
We only included data from groups of persons that had
received a single, intramuscular dose of inactivated influenza
vaccine in our analysis. Inactivated vaccines come in several
forms (split, whole, and sub-unit) all of which were included
in our review. Researchers have proposed that increasing the
dosage of the influenza vaccine would increase the antibody
response [12]. Most studies used the recommended trivalent
influenza vaccine dosage (15 g of each of the H1N1, H3N2,
and B antigens), but we also included studies with dosages
ranging from 10 to 50 g in order to assess the effect of
vaccine dosage.
2.4.2. Health status of the study participants
Papers that specifically studied groups of elderly subjects
with severeunderlying conditions (e.g.where all subjectshad
spinal cord injuries or were on dialysis) were not included.
Most studies included in this review did not apply rigorous
health inclusion standards; however, some studiesapplied the
“SENIEUR Protocol” [13], which patients with any chronic
underlying illness, abnormal laboratory tests, or medication
use are eliminated from the study.
2.4.3. Previous vaccination
Studies of groups of subjects were included regardless of
mean pre-vaccination antibody titers and vaccination histo-
ries.
2.4.4. Living situation
We included all studies without regard to whether the
elderly subjects were living independently in the community,
in institutions dependent on care, or in a mixture of settings.
2.4.5. New vaccine component
During the 16-year period covered by this review
(1986–2002) the WHO changed the recommended vaccine
component for H3N2 approximately 12 times [14]; by con-
trast, H1N1 and B viruses have slower evolution rates, and
the vaccine components were only changed 5 and 9 times,
respectively, during the same time period [14]. Because use
of a vaccine featuring a novel antigen might affect the anti-
body response, we identified the presence or absence of a
novel vaccine component in each study.
2.5. Statistical analysis
From the papers selected for this review, we recorded as
best as we could summary information on the outcomes, age,
and adjustment factors listed above (Tables 1 and 2). We con-
structed a database with separate entries of antibody results
for each group of elderlyand controlgroup ofyounger adults.
When a study presented subgroup analyses based on vari-
ous adjustment factors, for example, comparing the antibody
response to split virus versus whole virus vaccine,we entered
each independent group observation separately. We further
refer to these entries as “sub-studies” throughout the paper.
Our main analysis compared responses in the elderly to
those in younger adults. As a secondary analysis, we also
comparedresponses in the youngerelderlytotheveryelderly.
Allfactorslisted inTable1 were consideredinbothunivariate
andmultivariateanalysis and weseparatelystudiedhowthese
factors affected responses in the elderly.
All statistical analyses were carried out with SAS version
8.02, SAS Institute Inc., Cary, NC, USA.
2.5.1. Univariate analyses
We first conducted univariate analyses based on sub-
studies weighted by the number of study participants in
each group. We compared vaccine response in terms of sero-
conversion, seroprotection, and GMT, in the elderly versus
younger adults (<58 years old). We then compared the vac-
cine response in the younger elderly and very elderly based
on the mean age of the sub-studies. The ‘younger elderly’
group was classified as sub-studies in which the mean age
of subjects was between 65 and 75 years, and the ‘very
elderly’ were classified as sub-studies in which the mean
age of subjects was over the age of 75. We also compared
the vaccine response for each individual adjustment factor
related to thevaccine andstudyparticipants (vaccine: vaccine
type, vaccine dosage, new vaccine component; participants:
living situation, health status, vaccination prior to study; see
Tables 1 and 2).
We used chi-square tests to compare seroconversion
and seroprotection (binary outcomes) in each age category
K. Goodwin et al. / Vaccine 24 (2006) 1159–1169 1163
(young adults and elderly or young elderly and very elderly),
by weighting the outcome of each sub-study by the number
of participants. By contrast, GMT was given in the original
papers as a mean estimate for each sub-study and confidence
intervals were rarely available. Therefore, we could not cal-
culate a summary estimate for GMTs that would truly reflect
the variability of this measure in the population. To compare
this outcome between young and elderly persons, we used
T-tests based on the logarithm of the mean GMT in the sub-
study, with no weighting.
2.5.2. Multivariate analysis
Webuiltlogisticregressionmodelstoexplaintheweighted
antibody vaccine response using seroconversion or sero-
protection as the outcome. We built separate models for
each combination of these two outcomes and three antigens
(H1N1, H3N2 and B) for both age comparisons—young ver-
sus elderly and younger elderly versus very elderly.
Using a stepwise regression modeling approach, we
entered age as a covariate, along with all adjustment fac-
tors, including those suggested in the 1989 review [7] (health
status, vaccination prior to study, high pre-vaccination titres)
as well living situation, mean age, antigen dose, type of vac-
cine (sub-unit or split), and novelty of vaccine antigen. The
P-value for entry in the model was set at 0.20 and the P-value
for removing factors was 0.05.
Since we did not have confidence intervals for GMT and
GMT values are widely distributed, we did not pursue mul-
tivariate models with this outcome.
3. Results
3.1. Study population and demographics
From oursearch of theliterature published in 1989 or later
we retrieved 31 papers that fit our criteria. These 31 studies
were conducted from 1986 to 2002 in North America, Japan,
Israel, and nine European countries. Several were split into
independent sub-studies based on the year of the study, pre-
vaccination prevalence, living situation, vaccine type, and
dosage. In total, 48 independent sub-studies could be iden-
tified (Table 2). The studies varied in size from 11 to 591
elderly subjects and from 10 to 222 younger control subjects.
Across all studies, the “young” age groups were comprised
of individuals aged 17–59. The “elderly” age groups were
comprised of individuals aged 58–104 years, with a mean
age ranging from 68 to 86 years. The majority of elderly
subjects hadbeen previously vaccinated, althougheight stud-
ies specifically selected for individuals that had not been
previously vaccinated. Elderly subjects were recruited from
either the community (61% of sub-studies) or from institu-
tions (36%), usually nursing homes. Only two sub-studies
(3%) recruited a mixed population of community-dwelling
and institutionalized elderly.
3.2. Vaccine response in the elderly versus younger
adults
3.2.1. Unadjusted responses (univariate regression
analysis)
Prior to vaccination, the elderly and the young had sim-
ilar antibody titres measured as GMT for all three antigens
(Table 3). However, a larger proportion of the elderly were
seroprotected before vaccination, although these differences
were not always statistically significant.
In univariate analysis, age had a significant impact on the
response tovaccinationas measuredby seroconversion, sero-
protection and GMT for each of the three vaccine antigens
(Table 4). For all three antigens, seroconversion and sero-
protection rates were significantly higher in the young. In
terms of seroconversion, age group differences were larger
for H1N1 and B antigens than for H3N2 antigens, but the
differences between the two age groups were similar in
terms of seroprotection for all three antigens. Similarly, the
post-vaccination GMT levels were also always higher in the
younger adults.
To ensure that there was not an underlying biasin thestud-
ies withoutyoung controls,whereby the elderly in these stud-
ies had abnormally low antibody responses, we performed
a univariate analysis that only included studies with young
control groups. In this sensitivity analysis we found that the
Table 3
Pre-vaccination serological measures in the young and elderly across all studies, by influenza sub-type
Vaccine component Age group Seroprotection (percentage of subjects with Ab titers > 40) GMT
No. of subjects % Positive Unadjusted OR (95% CI) No. of subjects GMT P-value
H1N1 Young 1124 28 Ref 814 24
Elderly 3516 33 1.3
*
(1.1–1.5) 3911 18 0.75
H3N2 Young 1124 31 Ref 814 32
Elderly 3516 32 1.1 (0.9–1.2) 3911 25 0.53
B Young 1124 25 Ref 814 31
Elderly 3516 40 2.0
**
(1.7–2.3) 3911 24 0.72
Ab: antibody; CI: confidence interval; Ref: reference.
*
P-value between 0.05 and 0.001.
**
P-value<0.001.
1164 K. Goodwin et al. / Vaccine 24 (2006) 1159–1169
Table 4
Post-vaccine response (unadjusted) in young vs. elderly across all studies, by influenza sub-type
Vaccine
component
Age
group
Seroconversion (percentage of subjects
with 4-fold Ab increase)
Seroprotection (percentage of subjects
with Ab titres >40)
GMT
No. of
subjects
% Positive Unadjusted OR
(95% CI)
No. of
subjects
% Positive Unadjusted OR
(95% CI)
No. of
subjects
GMT P-value
H1N1 Young 913 60 Ref 1151 83 Ref 814 140
Elderly 4492 42 0.48
**
(0.41–0.55) 4643 69 0.47
**
(0.40–0.55) 3997 83 0.02
*
H3N2 Young 913 62 Ref 1151 84 Ref 814 162
Elderly 4492 51 0.63
**
(0.55–0.73) 4643 74 0.53
**
(0.45–0.63) 3406 126 0.26
B Young 913 58 Ref 1151 78 Ref 814 234
Elderly 4492 35 0.38
**
(0.33–0.44) 4643 67 0.58
**
(0.50–0.67) 3406 100 0.03
*
Ab: antibody; CI: confidence interval; Ref: reference.
*
P-value between 0.05 and 0.001.
**
P-value<0.001.
antibody response in the elderly was substantially reduced
when the studies without young controls were excluded.
3.2.2. Adjusted responses (multivariate regression
analysis)
The models given by the stepwise regression procedure
differed somewhat for each of the six different combina-
tions of three antigens and two outcomes (seroconversion
and seroprotection) studied (Fig. 1). However, in all cases
a remarkably robust effect was obtained when comparing
the adjusted responses of the elderly to those of younger
adults, which was the primary factor of interest. For sero-
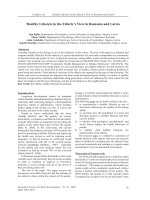
Fig. 1. Comparison of influenza vaccine adjusted and unadjusted weighted
responses in the elderly vs. young adults, measured as unadjusted and
adjusted odds-ratio, by outcome and vaccine component. An odds-ratio
below 1 indicates that the vaccine response is better in young adults than
in the elderly. Adjusted odds-ratios (OR) for age derived from individ-
ual multiple regression models that controlled for other demographic and
vaccine-specific factors that also affecting the outcome. The bars indicate
the OR point estimate and the ranges the 95% confidence limits.
protection, this adjustment reduced the odds-ratios (OR) for
H1 and B antigens from around 0.5 to around 0.25, and 0.35,
respectively, suggesting that the younger adults had a 3–4-
fold better response to the vaccine than the elderly for these
antigens. For H3 antigen, the adjustment slightly lowered the
odds-ratio from 0.53 to 0.48, suggesting that the younger
adults responded about twice as well to the vaccine as did
the elderly for this antigen. Overall, for all three antigens and
both outcomes studied, the adjusted antibody response to the
vaccine was 2–4-fold higher among the younger adults than
the elderly.
Three other factors—previous vaccination, high pre-
vaccination titre, and institutional residence—also consis-
tently influenced the antibody responseand remained inmost
models. Previous vaccination was associated with signifi-
cantly lower rates of seroprotection for H3 and B antigens
(OR: 0.76and 0.24,respectively), while high pre-vaccination
titre was associated with consistently higher seroprotection
rates for all three antigens (OR: 2.25–8.74). Institutional
residence had the most consistent impact on the antibody
response in all models with significantly higher response
rates both in terms of seroconversion and seroprotection
(OR: 1.56–3.69) for all three antigens. Indeed, the antibody
response in groups of institutionalized elderly was quite sim-
ilar to that of younger adults in the primary multivariate
analysis. As an example, for the H3 antigen, the young had a
62% seroconversion rate and 84% seroprotection rate, while
the institutionalized elderly had a 65% seroconversion rate
and 80% seroprotection rate for the same antigen.
3.3. Vaccine response comparisons within the elderly
groups
3.3.1. Unadjusted responses
In a univariate analyses comparing the antibody response
in the ‘younger elderly’ <75 years of age and the ‘very
elderly’ ≥75, the ‘very elderly’ had a significantly lower
responses in terms of seroconversion and seroprotection for
H1, H3, and B antigens, with the exception of seroprotection
for the B antigen (Table 5).
K. Goodwin et al. / Vaccine 24 (2006) 1159–1169 1165
Table 5
Post-vaccine response (unadjusted) in elderly less than 75 years vs. elderly over 75 years across all studies, by influenza sub-type
Vaccine
component
Age group Seroconversion (% of subjects with 4-fold Ab increase) Seroprotection (% of subjects with Ab titres > 40)
Subject No. % Positive Unadjusted OR (95% CI) Subject No. % Positive Unadjusted OR (95% CI)
H1N1 <75 1945 55.1 Ref 1883 74.8 Ref
>75 2492 31.7 0.38
**
(0.34–0.43) 2706 65.4 0.63
**
(0.58–0.70)
H3N2 <75 1945 57.9 Ref 1883 82.7 Ref
>75 2492 46.4 0.63
**
(0.56–0.71) 2706 68.1 0.45
**
(0.40–0.50)
B <75 1945 41.4 Ref 1883 62.3 Ref
>75 2492 29.2 0.58
**
(0.51–0.66) 2706 70.8 1.47
**
(1.34–1.60)
Ab: antibody; CI: confidence interval; Ref: reference.
**
P-value<0.001.
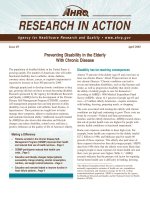
Results for all factors related to elderly study participants
and vaccine response are shown in Fig. 2. The antibody
response to vaccine did not vary significantly by vaccine
type (split, sub-unit, or whole) for any of the six combi-
nations of outcomes (seroconversion or seroprotection) and
antigens (H1N1, H3N2, and B) (P >0.05). There is no indi-
cation that increasing the dosage of antigen increases the
response to the vaccine in the elderly, but the data were
scarce as only three sub-studies identified had used a sub-
stantially elevated dosage (Table 2). High pre-vaccination
titre was associated withareduced seroconversion rateandan
increased seroprotection rate. Previous vaccination was also
associated with reduced seroconversion, but had a less sub-
stantial impact on seroprotection. Notably, institutionalized
Fig. 2. () yes; () no. Comparing elderly seroconversion and seroprotection rates (unadjusted, weighted) for each factor suspected to affect Ab vaccine
response, by six combinations of antigen and outcome studied.
*
P <0.05;
**
P <0.001.
1166 K. Goodwin et al. / Vaccine 24 (2006) 1159–1169
elderly responded remarkably better to the vaccine than did
community-dwelling elderly for all antigens and both out-
comes measured (OR; seroconversion: 2.14–4.50; seropro-
tection: 1.55–3.44) and consistently affected the OR for age
in the model.
3.3.2. Adjusted responses (multivariate regression
analysis)
In a multiple regression model, we found that the very
elderly had a reduced antibody response to all three anti-
gens when measuring seroconversion (OR: 0.32–0.61) and
to H1N1 and H3N2 when measuring seroprotection (OR:
0.62 and 0.42, respectively) compared to the younger elderly.
However, the antibody response to B as measured by sero-
protection was significantly higher in the very elderly.
4. Discussion
The approach to influenza control typically aims at reduc-
ing severe influenza-related outcomes largely by vaccina-
tion of the elderly, who are at highest risk for influenza-
related deaths. However, there is considerable evidence that
immune responses to vaccination decline substantially with
age [44,45]. Thus, it is not entirely clear how effective vacci-
nation of the elderly against influenza is in terms of reducing
severe influenza outcomes. Unfortunately, only one random-
ized placebo-controlled trial has been published in the past
three decades [46]. Although this study measured 57% effi-
cacy among people over 60 years, an age stratification sug-
gested a far lower vaccine efficacy estimate for those over 70
years, but the study was not powered to demonstrate declin-
ing efficacy with age (only 10% of study participants were
over 70). In the near absence of “gold standard” placebo-
controlled trials, evidence for the benefits of influenza vac-
cination in the elderly has to be derived from other types of
studies—including cohort studies, excess mortality studies
and studies of antibody (Ab) vaccine response. Data from
these varying types of studies, however, have produced con-
flicting results, ranging from astounding mortality benefits
measured in cohort studies of 50% reduction in all winter
deaths [4], to marginal mortality benefits [2,47].
We undertook a quantitative review of vaccine antibody
response studies published from 1989 onwards (including
studies conducted during 1986–2002). We report that the
elderly ≥65 have a significantly reduced antibody response
to vaccination compared with younger adults. After adjusting
for vaccine and host factors, vaccine response in the elderly
(seroprotection and seroconversion) was approximately 1/4
as rigorous for H1 and B antigens and about 1/2 as rig-
orous for H3 antigens, compared to the Ab response in
younger adults. In randomized placebo-controlled clinical
trials of healthy adults, the influenza vaccine was 70–90%
effective in preventing serologically confirmed influenza ill-
ness [3,48]. Taking this estimate as a gold standard, our
estimated ORcorresponds toa projectedclinical vaccine effi-
cacy in the elderly of about 17–53% efficacy for all three
antigens.
It is important to emphasize that this projected efficacy
cannot be compared to effectiveness measures from observa-
tional studies in the elderly, which predict a 50% efficacy [4],
as these studies measure highly non-specific outcomes, such
as reductions in all-cause mortality. Because most influenza-
related severe outcomes occurs during A/H3N2-dominated
seasons [1,2], the result for the H3 component is of most
relevanceto theobjectivesof influenza control.Forboth sero-
conversion and seroprotection, the elderly had a significantly
reduced response to the H3 antigen compared to the young
(adjusted OR = 0.58 and 0.48, respectively).
We tested the robustness of these odds-ratio estimates
by trying various multiple regression modeling approaches
and testing the effect of multiple factors in the models (see
Table 1). While the number of factors selected in the models
for various outcomes and antigens differed, the odds-ratio
estimate for the age component remained remarkably sta-
ble. Three other factors, namely previous vaccination, high
pre-titres, and living situation, also influenced the antibody
response significantly. Because there was likely consider-
able covariation between previous vaccination status and
pre-titres, itwas notpossible to tease out thisrelationship fur-
ther in the context of this review. Also, the model suggested
that institutionalized elderly responded far better compared
to the community-dwelling elderly, in some cases as well as
the younger adults. At least one other study has commented
on this phenomenon, suggesting that the elderly living in
institutions are better taken care of and, as a result, pos-
sibly enjoy better immune status [31]. This review, which
analyzes only group data, cannot resolve this interesting pos-
sibility. However, we believe we have clearly shown that
these factors cannot alone explain the decreased antibody
response in the elderly as some have hypothesized [7]. Our
estimated OR for age remained stable, even when all these
variablesweretakenoutofthemodels.Webelievethisconsis-
tently robust effect of age suggests that immune senescence
is playing an important role in response to the influenza
vaccine.
The question of effect of dosing could not be studied
with precision in our analysis, since only 5 of the 31 studies
included in this review had groups receiving dosages differ-
ent than the standard 15 g. Our finding that dose did not
remain in our model could probably reflect that only in one
smaller study group had received a significantly higher dose
(Table 2). However, one reviewed study that examined the
dose–response effect found little or no benefits of increasing
doses [12].
Unlikethe 1989review by Beyeret al. [7],our quantitative
review weighted the contributions of individual studies by
size ofthe groupsstudied. Andunlike these authors, our anal-
ysis andmultiple regression adjustmentprocedure uncovered
a robust result of reduced vaccine response in the elderly. We
conclude that the mixed findings by the authors of the 1989
reviewmayinpart be explainedby the lackofdetailpresented
K. Goodwin et al. / Vaccine 24 (2006) 1159–1169 1167
in the studies it reviewed at the time, which made it difficult
to characterize and control for factors that affected antibody
response. Furthermore, three of the four studies in the Beyer
reviewthatfoundabetterimmuneresponseamongtheelderly
were conducted under unique circumstances. In one case the
elderly were compared to a group of younger adults with
cystic fibrosis [49]. Two other studies involved elderly popu-
lations that had been primed for a particular vaccine antigen
earlierinlife(A/H3N2 in 1968 and A/H1N1 in1977)whereas
the younger grouphad not[50,51]. Adjusting forsuch a prim-
ing effect was not an issue for our review, because during our
studyperiod 1986–2002 there werenoliving elderly thathave
been primedto aparticular strainfor whichthe youngare not.
Thus, we believe the results from our review are more repre-
sentative for the contemporary influenza vaccine response in
the elderly.
As a caveat, we note that our analysis was done at the
group level, not individual records. In our multiple regres-
sion models, we weighted the studies and generated and
analyzed summary values for age and adjustment factors for
each sub-study. This may have led to some loss of preci-
sion, although the potential for misclassification bias seems
low. Most importantly, we do not expect bias due to mis-
classification of age, because age was a selection criterion
in the papers we reviewed. Also, our OR measurements may
not be a perfect measure of relative risk and may exagger-
ate somewhat the projected low vaccine efficacy estimate for
the elderly. Some statistical power was lost because six stud-
ies only reported seroconversion or seroprotection data, not
both. Additionally, some studies did not use the traditional
definitions forseroconversion (4-fold increase in HI antibody
titres) and seroprotection (post-vaccination HI antibody titre
≥40); but when these studies were taken out of the analy-
ses, the elderly responded slightly less vigorously than when
these studies were included.
Since as many as 70% of all influenza-related deaths cur-
rently occur among persons over the age of 75 in the US [2],
wehad initially plannedtoalsostudythe antibody responseto
influenza vaccination with increasing age among the elderly.
We were surprised to find that only 3 of the 31 studies
presented results for age breakdowns of the elderly partici-
pants. To study quantitatively the effect of age on the vaccine
response based on the published literature, we categorized
the elderly study groups into those with a mean age above or
below 75, as a best proxy for age. In univariate and multivari-
ate analysis, there was a significantly lower response in those
over 75 years of age, suggesting that Ab response declined
significantly with age among the elderly. However, since our
analysis could only be based on group mean age, we could
not further quantify the impact of increasing age within the
elderly age group. Therefore, in order to better characterize
the likely age-dependence of vaccine response, we propose
that future studies report vaccine response in the elderly
by 5 or 10 year increments. Table 6 presents a complete
list of suggestions to authors of future vaccine Ab response
studies.
Table 6
Study design recommendations for future vaccine Ab response studies
Age sub-sets Report data in 5–10 year age groups in people over
65 years
Pre-vaccination Report data on subjects that had been vaccinated in
the previous year
Serological data Report pre- and post-vaccination serological data for
all three main measurements, seroconversion,
seroprotection, and GMT
Residence Report data on residence, whether in an institution
or independently in the community
Selection criteria Select a study group that represents a realistic
population of the elderly
As antibody response is but one of several components of
the immune response, in order to fully gauge vaccine effi-
cacy in the elderly one should take into account changes not
only the adaptive immune system’s antibody response but
also age-related changes in the cellular response and the acti-
vationof theinnate immunesystem. Althoughthe underlying
mechanism of T-cell responses to influenza infection is not
fully understood they are clearly important. Several recent
studies have reported an age-related decline in the function
of a variety of T-cell sub-sets [5,52–54]. Due to concerns
about reduced vaccine response with age, several European
countries are already using an adjuvanted influenza vaccine
specifically designed for use in the elderly [25].
In the absence of further controlled clinical trials, and
given the unresolved disagreement between cohort studies
and excess mortality studies [2], evidence from immunolog-
ical studies and elucidation of the phenomena of immune
senescence are critical for our understanding of the likely
clinical response to influenza vaccine in the very elderly. At
best, such studies should consider both antibody and cellular
immunity to the influenza vaccine. Until such a comprehen-
sive understanding is achieved, we believe our finding in this
review supports the need for further research into the phe-
nomenon of immune senescence, with the hope that such
insights will eventually lead to more immunogenic vaccine
formulations.
Acknowledgement
The authors would like to thank Mr. Robert Taylor for his
assistance in editing this manuscript.
References
[1] Thompson WW, Shay DK, Weintraub E, Brammer L, Cox N, Ander-
son LJ, et al. Mortality associated with influenza and respiratory
syncytial virus in the United States. JAMA 2003;289:179–86.
[2] Simonsen L, Reichert TA, Viboud C, Blackwelder WC, Taylor RJ,
Miller MA. Impact of influenza vaccination on seasonal mortality in
the US elderly population. Arch Intern Med 2005;165(3):265–72.
[3] Centers for Disease Control and Prevention. Prevention and con-
trol of influenza. Recommendations of the Advisory Committee on
Immunization Practices (ACIP). MMWR Morb Mortal Wkly Rep
1168 K. Goodwin et al. / Vaccine 24 (2006) 1159–1169
2004;53(RR-06)1–40 (available: />mmwrhtml/rr5306a1.htm).
[4] Vu T, Farish S, Jenkins M, Kelly H. A meta-analysis of effectiveness
of influenza vaccine in persons aged 65 years and over living in the
community. Vaccine 2002;20:1831–6.
[5] Murasko DM, Bernstein ED, Gardner EM, Gross P, Munk G, Dran
S, et al. Role of humoral and cell-mediated immunity in protection
from influenza disease after immunization of healthy elderly. Exp
Gerontol 2002;37(2–3):427–39.
[6] Goronzy JJ, Fulbright JW, Crowson CS, Poland GA, O’Fallon WM,
Weyand CM. Value of immunological markers in predicting respon-
siveness to influenza vaccination in elderly individuals. J Virol
2001;75:12182–7.
[7] Beyer WE, Palache AM, Baljet M, Masurel N. Antibody induction
by influenza vaccines in the elderly: a review of the literature. Vac-
cine 1989;7(5):385–94 [Review].
[8] Hobson D, Curry RL, Beare AS, Ward-Gardner A. The role of
serum haemagglutination-inhibiting antibody in protection against
challenge infection with influenza A2 and B viruses. J Hyg (Lond)
1972;70(4):767–77.
[9] Potter CW, Oxford JS. Determinants of immunity to influenza infec-
tion in man. Br Med Bull 1979;35(1):69–75 [Review].
[10] Gross PA, Russo C, Dran S, Cataruozolo P, Munk G, Lancey SC.
Time to earliest peak serum antibody response to influenza vaccine
in the elderly. Clin Diagn Lab Immunol 1997;4(4):491–2.
[11] Rastogi S, Gross PA, Bonelli J, Dran S, Levandowski RA, Russo C,
et al. Time to peak serum antibody response to influenza vaccine.
Clin Diagn Lab Immunol 1995;2(1):120–1.
[12] Palache AM, Beyer WE, Sprenger MJ, Masurel N, de Jonge S, Vardy
A, et al. Antibody response after influenza immunization with vari-
ous vaccine doses: a double-blind, placebo-controlled, multi-centre,
dose–response study in elderly nursing-home residents and young
volunteers. Vaccine 1993;11(1):3–9.
[13] Ligthart GJ, Corberand JX, Fournier C, Galanaud P, Hijmans
W, Kennes B, et al. Admission criteria for immunogerontologi-
cal studies in man: the SENIEUR protocol. Mech Ageing Dev
1984;28(1):47–55.
[14] WHO report on global surveillance and response. 2000 WHO/CDS/
CSR/ISR/2000.1 available: />surveillance/docs/whocdscsrisr2001.html/Tableofcontents/about.htm#
Copyright.
[15] Gross PA, Quinnan Jr GV, Weksler ME, Setia U, Douglas Jr RG.
Relation of chronic disease and immune response to influenza vac-
cine in the elderly. Vaccine 1989;7(4):303–8.
[16] Zei T, Neri M, Iorio AM. Immunogenicity of trivalent subunit and
split influenza vaccines (1989–90 winter season) in volunteers of
different groups of age. Vaccine 1991;9(9):613–7.
[17] Chernesky M, O’neill D, Pickard L, Castriciano S, Kraftcheck D,
Sellors J, et al. Immunogenicity and adverse reactions of influenza
vaccination in elderly patients given acetaminophen or placebo. Clin
Diagn Virol 1993;1(2):129–36.
[18] de Bruijn IA, Remarque EJ, Beyer WE, le Cessie S, Masurel
N, Lightart GJ. Annually repeated influenza vaccination improves
humoral responses to several influenza virus strains in healthy
elderly. Vaccine 1997;15(12–13):1323–9.
[19] McElhaney JE, Meneilly GS, Lechelt KE, Beattie BL, Bleackley RC.
Antibody response to whole-virus and split-virus influenza vaccines
in successful ageing. Vaccine 1993;11(10):1055–60.
[20] Remarque EJ, de Bruijn IA, Boersma WJ, Masurel N, Ligthart GJ.
Altered antibody response to influenza H1N1 vaccine in healthy
elderly people as determined by HI, ELISA, and neutralization assay.
J Med Virol 1998;55(1):82–7.
[21] Glathe H, Bigl S, Grosche A. Comparison of humoral immune
responses to trivalent influenza split vaccine in young, middle-aged
and elderly people. Vaccine 1993;11(7):702–5.
[22] Gross PA, Levandowski RA, Russo C, Weksler M, Bonelli J, Dran
S, et al. Vaccine immune response and side effects with the use
of acetaminophen with influenza vaccine. Clin Diagn Lab Immunol
1994;1(2):134–8.
[23] Lina B, Fletcher MA, Valette M, Saliou P, Aymard M. A TritonX-
100-split virion influenza vaccine is safe and fulfills the committee
for proprietary medicinal products (CPMP) recommendations for the
European Community for Immunogenicity, in Children, Adults and
the Elderly. Biologicals 2000;28(2):95–103.
[24] Powers DC, Belshe RB. Effect of age on cytotoxic T lymphocyte
memory as well as serum and local antibody responses elicited by
inactivated influenza virus vaccine. J Infect Dis 1993;167(3):584–
92.
[25] Minutello M, Senatore F, Cecchinelli G, Bianchi M, Andreani T,
Podda A, et al. Safety and immunogenicity of an inactivated subunit
influenza virus vaccine combined with MF59 adjuvant emulsion in
elderly subjects, immunized for three consecutive influenza seasons.
Vaccine 1999;17(2):99–104.
[26] Bernstein E, Kaye D, Abrutyn E, Gross P, Dorfman M, Murasko
DM. Immune response to influenza vaccination in a large healthy
elderly population. Vaccine 1999;17(1):82–94.
[27] De Donato S, Granoff D, Minutello M, Lecchi G, Faccini M, Agnello
M, et al. Safety and immunogenicity of MF59-adjuvanted influenza
vaccine in the elderly. Vaccine 1999;17(23–24):3094–101.
[28] Gardner EM, Bernstein ED, Dran S, Munk G, Gross P, Abrutyn
E, et al. Characterization of antibody responses to annual influenza
vaccination over four years in a healthy elderly population. Vaccine
2001;19(32):4610–7.
[29] Gardner EM, Bernstein ED, Popoff KA, Abrutyn E, Gross P,
Murasko DM. Immune response to influenza vaccine in healthy
elderly: lack of association with plasma beta-carotene, retinol, alpha-
tocopherol, or zinc. Mech Ageing Dev 2000;117(1–3):29–45.
[30] Van Hoecke C, Prikazsky V, Uto I, Menschikowski C. Immuno-
genicity of an inactivated split influenza vaccine in institutionalized
elderly patients. Gerontology 1996;42(4):190–8.
[31] Iorio AM, Alatri A, Camilloni B, Neri M, Baglio G, Donatelli
I. Antibody response to 1995–1996 influenza vaccine in insti-
tutionalized and non-institutionalized elderly women. Gerontology
1999;45(1):31–8.
[32] Buxton Bridges C, Fukuda K, Holman RC, De Guzman AM, Hodder
RA, Gomolin IH, et al. Decreased antibody response among nursing
home residents who received recalled influenza vaccine and results
of revaccination. Vaccine 2000;18(11–12):1103–9.
[33] Muszkat M, Friedman G, Dannenberg HD, Greenbaum E, Lipo M,
Heymann Y, et al. Response to influenza vaccination in community
and in nursing home residing elderly: relation to clinical factors. Exp
Gerontol 2003;38(10):1199–203.
[34] Baldo V, Menegon T, Bonello C, Floreani A, Trivello R, Collab-
orative Group. Comparison of three different influenza vaccines in
institutionalised elderly. Vaccine 2001;19(25–26):3472–5.
[35] Muszkat M, Greenbaum E, Ben-Yehuda A, Oster M, Yeu’l E,
Heimann S, et al. Local and systemic immune response in nursing-
home elderly following intranasal or intramuscular immuniza-
tion with inactivated influenza vaccine. Vaccine 2003;21(11–12):
1180–6.
[36] Pregliasco F, Mensi C, Serpilli W, Speccher L, Masella P, Belloni A.
Immunogenicity and safety of three commercial influenza vaccines
in institutionalized elderly. Aging (Milano) 2001;13(1):38–43.
[37] Squarcione S, Sgricia S, Biasio LR, Perinetti E. Comparison
of the reactogenicity and immunogenicity of a split and a
subunit-adjuvanted influenza vaccine in elderly subjects. Vaccine
2003;21(11–12):1268–74.
[38] Stepanova L, Naykhin A, Kolmskog C, Jonson G, Barantceva I,
Bichurina M, et al. The humoral response to live and inactivated
influenza vaccines administered alone and in combination to young
adults and elderly. J Clin Virol 2002;24(3):193–201.
[39] Brydak LB, Machala M, Mysliwska J, Mysliwski A, Trzonkowski P.
Immune response to influenza vaccination in an elderly population.
J Clin Immunol 2003;23(3):214–22.
K. Goodwin et al. / Vaccine 24 (2006) 1159–1169 1169
[40] Belshe RB, Newman FK, Cannon J, Duane C, Treanor J, Treanor J,
et al. Serum antibody responses after intradermal vaccination against
influenza. N Engl J Med 2004;351(22):2286–94.
[41] Frech SA, Kenney RT, Spyr CA, Lazar H, Viret JF, Herzog C,
et al. Improved immune responses to influenza vaccination in the
elderly using an immunostimulant patch. Vaccine 2005;23(7):946–
50.
[42] Hara M, Tanaka K, Hirota Y. Immune response to influenza vaccine
in healthy adults and the elderly: association with nutritional status.
Vaccine 2005;23(12):1457–63.
[43] Ruf BR, Colberg K, Frick M, Preusche A. Open randomized study to
compare the immunogenicity and reactogenicity of an influenza split
vaccine with an MF59-adjuvanted subunit vaccine and a virosome-
based subunit vaccine in elderly. Infection 2004;32(4):191–8.
[44] Wick G, Grubeck-Loebenstein B. Primary and secondary alterations
of immune reactivity in the elderly: impact of dietary factors and
disease. Immunol Rev 1997;160:171–84 [Review].
[45] Weksler ME, Szabo P. The effect of age on the B-cell repertoire. J
Clin Immunol 2000;20(4):240–9 [Review].
[46] Govaert TME, Thijs CTMCN, Masurel N, Sprenger MJW, Dinant
GJ, Knottnerus JA. The efficacy of influenza vaccination in elderly
individuals. JAMA 1994;272:1661–5.
[47] Mangtani P, Cumberland P, Hodgson CR, Roberts JA, Cutts FT,
Hall AJ. A cohort study of the effectiveness of influenza vaccine in
older people, performed using the United Kingdom general practice
research database. J Infect Dis 2004;190(1):1–10.
[48] Demicheli V, Rivetti D, Deeks JJ, Jefferson TO. Vaccines for pre-
venting influenza in healthy adults. The Cochrane Database of Sys-
tematic Reviews 2004;(3). doi: 10.1002/14651858.CD001269.pub2.
[Art. No.: CD001269.pub2.].
[49] Gross PA, Weksler ME, Quinnan Jr GV, Douglas Jr RG, Gaerlan
PF, Denning CR. Immunization of elderly people with two doses of
influenza vaccine. J Clin Microbiol 1987;25(9):1763–5.
[50] Cromwell HA, Brandon FB, McLean Jr IW, Sadusk Jr JF. Influenza
immunization. A new vaccine. JAMA 1969;210(8):1438–42.
[51] Hannoun C, Barme M, Serie C, Beck H, Aquino J, Thibon M.
Antibody response to anti-A/New Jersey/76 vaccines. Dev Biol Stand
1977;39:249–52.
[52] Deng Y, Jing Y, Campbell AE, Gravenstein S. Age-related impaired
type 1 T cell responses to influenza: reduced activation ex
vivo, decreased expansion in CTL culture in vitro, and blunted
response to influenza vaccination in vivo in the elderly. J Immunol
2004;172(6):3437–46.
[53] Kang I, Hong MS, Nolasco H, Park SH, Dan JM, Choi JY, et al.
Age-associated change in the frequency of memory CD4+ T cells
impairs long term CD4+ T cell responses to influenza vaccine. J
Immunol 2004;173:673–81.
[54] Saurwein-Teissl M, Lung TL, Marx F, Gschosser C, Asch E, Blasko
I, et al. Lack of antibody production following immunization in old
age: association with CD8(+)CD28(−) T cell clonal expansions and
an imbalance in the production of Th1 and Th2 cytokines. J Immunol
2002;168(11):5893–9.