The State of Aging and Health in America pot
Bạn đang xem bản rút gọn của tài liệu. Xem và tải ngay bản đầy đủ của tài liệu tại đây (326.58 KB, 28 trang )
The State of Aging
and Health in America
About this Report:
The State of Aging and Health report consists of five sections.
The first section of the report, The Health of Older Americans,
presents data that illustrate changes that have taken place during
the past two decades in several important measures of older
Americans’ health. Five key measures show trends in life
expectancy, death rates, chronic disease, disability, and self-rated
health status. The second and third sections present the national
and state-by-state Report Card on Healthy Aging. The Report
Card includes 10 indicators divided into three groups:
• Health Behaviors
• Preventive Care and Cancer Screening
• Fall-Related Deaths and Injuries
The Report Card grades the nation and the states based on
targets set for the older population in Healthy People 2000, a
national effort to improve health by establishing health targets
and measuring progress (see Appendix, Table 5). The Report
Card uses a “Pass” or “Fail” grading system based on whether
the nation and states met, or failed to meet, a target.
The fourth section of the report, Mental Health and Aging,
presents challenges in treating mental illness among the elderly.
The section focuses on the treatment of depression in later life,
because most research on mental health services and the man-
agement of mental disorders relates to depressive disorders. The
fifth section, Training the Health Care Workforce—Present and
Future, focuses on the growing gap between older Americans’
health care needs and the knowledge of health professionals
who care for them.
Executive Summary
I
The United States population over age 65 is projected to
grow from 35 million in 2000 to 70 million in 2030. At
that time, one in five Americans will be age 65 or older.
The Merck Institute of Aging & Health and the
National Academy on an Aging Society, the policy
institute of The Gerontological Society of America,
are releasing this report to assess the health status of
older Americans and make recommendations to improve
older Americans’ future physical and mental well-being.
The most current data show that Americans, though
living longer, are not necessarily living in better health
during their senior years. Since 1990, healthy life expectancy
(the number of healthy years after age 65) has remained at
about 12 years—below the Healthy People 2000 target of
14 years for 2000.
The good news is that the current gap between life
span and healthy life span can be narrowed, and the
primary responsibility rests with older adults. Seventy
percent of the physical decline that occurs with aging is
related to modifiable factors, including smoking, poor
nutrition, lack of physical activity, injuries from falls and
the failure to use Medicare-covered preventive services.
Seniors need to start exercising, stop smoking and
engage in other healthy behaviors.
In the area of mental health, primary care physicians, if
given the right screening tools, can do a better job of diag-
nosing and treating depression and other mental disorders
among older patients. In addition, providing training and
education in geriatrics to practicing physicians, nurses, phar-
macists, and other health care professionals can help them
to better address the unique health needs of older patients.
This report is divided into five sections. Two of the
sections offer a Report Card—the first of its kind—that
shows whether older Americans are meeting specific
targets set in Healthy People 2000. The following is a
brief description of each section’s findings:
The Health of Older Americans: Americans are living
longer due to declines in heart disease and stroke mortality.
But chronic diseases, such as diabetes and high blood
“The mission of the Merck Institute of Aging & Health is to improve the health, independence
and quality of life of older adults, to help them not only survive but thrive. We hope this Report
will focus the national spotlight on the obstacles to healthy aging and serve as a catalyst for
improvement and advancement. We hope that health care professionals, policy makers and
everyone interested in the challenges and consequences of our aging society will take note of its
recommendations. Most of all, we hope this Report will serve as a national wake-up call for the
changes we must undertake if we want to create the best possible health care system, and the
best possible health care workforce, for older adults in the 21st century.”
— Dr. Patricia Barry, MD, Executive Director of the Merck Institute of Aging & Health
“For over fifty years, The Gerontological Society of America has greatly contributed to the body
of knowledge on aging and health. This Report continues and furthers that tradition. By assess-
ing the health status of older Americans and providing recommendations for health care pro-
fessionals, the Report illuminates what we as a nation must do to ensure not just a long life
but a good life for older adults. It needs to be read in the corridors of government, the halls
of medicine and newsrooms. It should become a valued reference for researchers. Above all,
this Report deserves a place on the bookshelf of anyone who is interested in providing older
adults with optimal health care.”
— Toni C. Antonucci, Ph.D., President, The Gerontological Society of America
II
pressure, are becoming more prevalent among older
adults—especially among Blacks and Hispanics. Among
those 65 to 74, the share of those reporting very good to
excellent health rose to 42 percent in 1999, from 35
percent in 1982. But those 75 or older reported little
improvement or a decline in health status.
National Report Card on Healthy Aging: The nation
failed to meet 6 of 10 national targets for improving the
health status of older Americans. While the nation met
important goals for smoking, colorectal screening, mam-
mograms, and flu vaccinations, it failed to meet targets
for physical exercise, nutrition, weight, pneumonia vacci-
nations, and injuries and deaths due to falls.
State-by-State Report Card on Healthy Aging: All
states missed the targets for physical activity, nutrition, and
weight. All states met the target for mammogram screen-
ings. Nearly all met the targets for colorectal screenings
and flu vaccinations.
Mental Health and Aging: Almost 20 percent of older
Americans experience mental disorders. Many primary
care physicians are not trained to screen for mental ill-
ness, and, unfortunately, may attribute psychiatric symp-
toms to “normal aging” or to chronic physical illness. As
a result, close to 90 percent of depressed older patients in
primary care get no treatment or inadequate treatment,
despite the availability of effective treatments. Only
3 percent receive treatment for mental disorders from
a mental health specialist.
Training the Health Care Workforce—Present and
Future: Most health care professionals do not receive the
geriatrics training necessary to respond to the unique and
complex health needs of older adults. As such, inaccurate
diagnoses and inappropriate care often result. Studies indi-
cate that older patients who receive care from geriatrics-
trained professionals show greater improvement than those
treated with usual care. According to one estimate, proper
geriatric care could reduce hospital, nursing home, and
home care costs by at least 10 percent a year, saving $133.7
billion in 2020.
Goals:
• To provide every health care professional with some
education and training in geriatrics and access to geri-
atric experts.
• To remove patient, provider, and policy barriers so that
older Americans gain access to timely and effective
mental health services.
• To achieve the national goals in reducing health risk
behaviors.
To meet these goals, the Merck Institute of Aging &
Health and the National Academy on an Aging Society,
the policy institute of The Gerontological Society of
America, call for a number of actions. The following is
an overview, with more details in the body of the report.
• Give physicians access to state-of-the-art information
and resources to help them better prevent and treat
depression, falls, urinary incontinence, and other age-
related conditions.
• Encourage physicians to screen older patients for
depression and other mental disorders.
• Expand the Medicare reimbursement system to provide
for improved mental health coverage. The federal pro-
gram also needs to cover patient care coordination and
assessment, a major component of geriatric care.
• Develop continuing education programs in geriatrics
based on effective models of practicing-physician educa-
tion, interactive sessions, and evidence-based materials.
• Encourage physicians to routinely ask and counsel
seniors about smoking, physical activity, diet and other
health risk behaviors.
• Target information and resources toward African-
Americans and Hispanics, since minority seniors are at
greater risk than whites for several chronic conditions
and health-damaging behaviors.
III
Executive Summary I
Table of Contents III
The Health of Older Americans 01
The National Report Card on Healthy Aging 04
The State-by-State Report Card on Healthy Aging 09
Mental Health and Aging 12
Training the Health Care Workforce—Present and Future 15
Appendix 19
Table of Contents
preventive health services, public health efforts, and
healthier lifestyles, the vast majority of Americans now
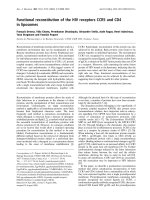
survive to age 65. Women who reach age 65 can expect
to live an additional 19 years, while men can expect to
live another 16 years (see Figure 1).
Experts disagree on whether we can expect further
gains in older Americans’ life expectancy in the 21st cen-
tury. Some argue that life expectancy cannot continue
to increase unless there are dramatic, unforeseen medical
advances in preventing and treating major causes of death,
such as heart disease and cancer. Others argue that life
expectancy will continue to increase, since future sen-
iors will benefit from continuing medical advances.
Causes of Death
In the 1980s and 1990s, the death rates for two of the
three leading killers of older Americans—heart disease
and stroke—declined by approximately one-third (see
Figure 2). In fact, decreases in seniors’ death rates for
heart disease and stroke have driven the increase in life
expectancy at age 65. Evidence suggests that, at least
for heart disease, falling death rates are due more to
treatment advances than to a reduction in the incidence
of the disease.
Yet, despite the availability of improved care,
heart disease and stroke remain major killers of older
Americans. In 2000, heart disease, stroke, and cancer
accounted for 60 percent of all deaths among people age
65 or older. The death rates for cancer and for chronic
lower respiratory diseases have increased, reflecting, in
large part, the effects of prior smoking patterns among
those age 65 or older. The death rate for diabetes also
increased over this period, due to increases in average
weight and obesity and high levels of physical inactivity
among older people.
01
Over the last century, the number of older Americans increased more than tenfold, to 35 million
people age 65 or older in 2000. Experts predict this age group will double by 2030, when one in
five Americans will be age 65 or older.
The Health
of Older Americans
f.1
THE GAP BETWEEN MALE AND FEMALE LIFE
EXPECTANCY AT AGE 65 IS NARROWING
2000
1990
1980
14.1
18.3
15.1
18.9
16.3
19.2
Source: National Center for Health Statistics, Trends in Health and Aging Database
M
F
02
Chronic Health Conditions
With earlier diagnosis and better treatment of life-threat-
ening diseases, people are living longer after the onset of
illness, but not necessarily healthier. For example, better
treatment of heart disease means that an individual may
live long enough to develop other age-related conditions,
such as arthritis and diabetes.
Prevalence of chronic diseases among older
Americans varies by race and ethnicity. Nearly 60 per-
cent of elderly blacks report high blood pressure, and
a growing share of elderly blacks and Hispanics report
problems with diabetes (see Figure 3).
Disability
Chronic conditions cause almost half of all disability
among older Americans. Between 1984 and 1995, the
prevalence of all major chronic diseases increased among
persons age 70 or older (see Figure 4).
Although chronic diseases are becoming more preva-
lent in the older population, disability rates for older
Americans have been declining in recent years. In 1982,
the disabled older population in the United States totaled
6.4 million. If the 1982 rate had continued, the number of
disabled would have climbed to about 9.3 million in 1999.
Instead, it only rose slightly, to 7 million—less than a
quarter of the increase that might have been expected
(see Figure 5).
Possible explanations for this decreased disability
include improved management and treatment of under-
lying chronic diseases, changes in health behavior, and
increased use of devices—canes, walkers, walk-in showers,
support rails, and handicapped accessible facilities—that
enable seniors to stay independently active despite physi-
cal limitations.
f.2
HEART DISEASE AND STROKE DEATH RATES HAVE
FALLEN BY ONE-THIRD SINCE 1981 (FOR THOSE AGE 65+)
3000
2500
2000
1500
1000
500
1981
Source: National Center for Health Statistics, Trends in Health and Aging Database
*COPD: Chronic obstructive pulmonary diseases, which include bronchitis, emphysema,
asthma, and other chronic respiratory diseases
Per
100,000
1982
1984
1986
1988
1990
1992
1994
1996
1998
2000
Heart
Disease
Cancer
Stroke
COPD*
Diabetes
f.3
PREVALENCE OF CHRONIC CONDITIONS AMONG
70+ GROUP VARIES CONSIDERABLY BY RACE
AND ETHNICITY, 1995
Source: Second Supplement on Aging
Black,
Non-Hispanic
Cancer
High
Blood
Pressure
Diabetes
10.5%
9.1
%
17.4%
20.4%
10.9
%
42%
58.7%
44%
21%
White,
Non-Hispanic
Hispanic
f.4
HIGHER SHARE OF THOSE AGE 70+ REPORT HAVING
SELECTED CHRONIC CONDITIONS
Source: Supplement on Aging and Second Supplement on Aging
Heart Disease
Cancer
Stroke
Diabetes
Hypertension
Arthritis
55%
58%
10%
12%
12%
19%
8%
9%
46%
45%
16%
21%
1984
1995
Self-Reported Health Status
Perhaps the best measure of seniors’ health is their self-
reported health status. How do older Americans’ view their
own physical health? Here, the answer depends on which
group of older Americans is surveyed.
For example, self-reported health status varies by race
(see Figure 6). Among older persons in every age group,
blacks were much less likely than whites to report their
health as very good or excellent.
Self-reported health status also varies by age. Among
those ages 65 to 74, the percentage reporting very good
or excellent health increased from 35 percent in 1982
to 42 percent in 1999. The oldest age groups, however,
reported only modest improvements in health status.
About 33 percent of those ages 75 to 84 reported their
health as very good or excellent in 1982, compared with
35 percent in 1999. Among those age 85 or older, the per-
centage that rated their health as very good or excellent
actually declined. This decline is perhaps not surprising
given the greater proportion of older persons surviving to
old age with chronic conditions. However, this is of great
significance to health planners and policy makers since
those age 85 or older are the fastest growing group of
older Americans and the group that generates the greatest
demand for health and long-term care services.
Americans can improve the odds for healthy aging
simply by taking advantage of recommended preventive
health services and by making healthy lifestyle changes.
In fact, 70 percent of the physical decline that occurs with
aging is related to modifiable factors, including smoking,
poor nutrition, physical inactivity, and failure to use
preventive and screening services (National Center for
Chronic Disease Prevention and Health Promotion, 1999).
Research shows that simple behavioral changes can
improve the health condition of even the oldest old. The
challenge is to encourage people to reduce preventable
health risks, thereby increasing the number of additional
healthy years they can expect to live.
03
f.6
SELF-REPORTED EXCELLENT OR VERY GOOD HEALTH
VARIES BY AGE AND RACE, 1982 AND 1999
Source: National Center for Health Statistics, Trends in Health and Aging Database
75-84 YRS
Total
Population
1982
African
Americans
1982
Total
Population
1999
42%
35%
35%
65-74 YRS
26%
27%
33%
36%
31%
24%
23%
22%
African
Americans
1999
85+ YRS
f.5
NUMBER OF CHRONICALLY DISABLED AMERICANS AGE
65+ LESS THAN PROJECTED
12
8
4
1982
Source: National Long-Term Care Survey , 1982-1999
Millions
1989
1994
1999
Expected number if disability
rate had not changed since 1982
Actual number of chronically
disabled Americans, age 65
04
This section includes the National Report Card on Healthy Aging (see Table 1). The Report Card
shows the nation’s most current data for the indicator, and a grade of either “Pass” or “Fail”
relative to the Healthy People 2000 target. The rest of the section describes the indicators in
greater detail. Although Healthy People 2000 established several targets for improving the
health of the older population, the Report Card focuses on 10 modifiable factors that have the
greatest potential to promote healthy aging.
The National Report
Card on Healthy Aging
SUMMARY OF FINDINGS:
• The nation met 4 of the 10 Healthy People
2000 targets for the older population—
mammography, colorectal screening, flu
vaccinations and smoking.
• The older population failed to achieve the
targets set for physical activity, nutrition,
weight, pneumonia vaccinations, hospital-
izations due to hip fractures and deaths due
to falls.
Current Data For
Persons Age 65 Healthy People
Indicator or Older (Year) 2000 Target* Grade
Health Behaviors
1. No Physical Activity During 34.6 (2000) 22 Fail
Leisure-Time In Past Month (%)
2. Overweight (%) 37.1 (1999) 20 Fail
3. Eating 5+ Fruits/Veg. Daily (%) 31.8 (2000) 50 Fail
4. Current Smoker (%) 11.1 (1997/98) 15 Pass
Preventive Care and
Cancer Screening
5. Flu Vaccine in Past Year (%) 64 (2000) 60 Pass
6. Ever had Pneumonia 53 (2000) 60 Fail
Vaccine (%)
7. Mammogram within 68 (2000) 60 Pass
Past 2 Years (%)
8. Ever had Colorectal 48.5 (1999) 40 Pass
Screening (%)
Fall-Related Deaths
and Injuries (per 100,000)
9. Hip Fractures, 65+ 863 (1998) 607 Fail
10. Fall-related Deaths, 85+ 162.7 (1998) 105 Fail
THE NATIONAL REPORT CARD ON HEALTHY AGING
Table 1
* See Appendix, Table 5, for a full description of Healthy People 2000 targets.
05
Health Behaviors
Healthy People 2000 included several targets for improving
older Americans’ quality of life through simple lifestyle
changes. Research has shown that healthy lifestyles are
more influential than genetic factors in helping older
people avoid the decline traditionally associated with aging.
Older adults who are physically active, eat a healthy diet, do
not smoke, and maintain a healthy body weight can extend
their healthy years and improve their quality of life. Since
all are behaviors individuals can change, they represent an
area in which significant future progress is achievable.
Indicator 1: No physical activity during leisure-time
in the past month
• Physical activity is the key to healthy aging. In fact,
older people have more to gain than younger people by
becoming more active because they are at higher risk of
developing problems that regular physical activity can
prevent, such as obesity, high blood pressure, diabetes,
osteoporosis, stroke, depression, colon cancer, and
premature death.
• Most older Americans are not active enough to achieve
the health benefits associated with physical activity, and
the Healthy People 2000 target related to physical activity
showed little improvement at the end of the decade. In
2000, 35 percent of older adults reported being physi-
cally inactive during the past month (see Figure 7).
Indicator 2: Overweight
• Maintaining a healthy body weight is important for
older Americans’ health, since being overweight or
obese is associated with a greater risk of diseases, such
as cardiovascular disease and diabetes, and can worsen
existing conditions, such as arthritis.
• Between 1990 and 1998, there has been little change in
the share of overweight older Americans. Currently, the
percent of older Americans who are overweight is nearly
twice the national target of 20 percent (see Figure 8).
• There has been an increase in the share of older Americans
that is obese. Obesity is defined as 30 pounds over an
individual’s recommended Body Mass Index. Obesity is a
particularly severe problem among older black Americans.
In 1999, more than 25 percent of older blacks were obese.
A Healthy People 2000 target for obesity does not exist.
Indicator 3: Five or more fruits
and vegetables daily
• Poor nutrition increases a person’s risk for many con-
ditions (including high blood pressure, osteoporosis,
and arthritis) and diseases (including cardiovascular
diseases, diabetes, and certain cancers) in later life.
Older Americans consume too much saturated fat and
too few fruits and vegetables that are high in vitamins,
minerals, and carbohydrates.
f.8
PERCENT OF OLDER AMERICANS WHO ARE OVERWEIGHT
IS NEARLY TWICE THE NATIONAL TARGET
Source: CDC, Behavioral Risk Factor Surveillance System Online Prevalence Database
1990
35%
35.7%
34.8%
36.3%
35.1%
36.6%
1992
1993
1994
1998
1999
20% - YEAR 2000 TARGET
35.5%
37.3%
37.9%
37.1%
1997
1996
1995
1991
f.7
SHARE OF 65+ WHO REPORT NO PHYSICAL ACTIVITY
DURING LEISURE TIME STILL MISSES TARGET
Source: CDC, Behavioral Risk Factor Surveillance System Online Prevalence Database
1990
42.6%
37.4%
40.1%
38.3%
39%
34.6%
1992
1994
1996
1998
2000
22% - YEAR 2000 TARGET
• Current recommendations call for the consumption of
five or more servings of fruits and vegetables every day.
This goal set forth in Healthy People 2000 has not been
met (see Figure 9).
Indicator 4: Current smoker
• Smoking is the single most preventable cause of death
and disease in the United States. Smoking contributes
substantially to chronic disease and disability.
• The majority of older Americans do not smoke.
However, the percentage of older black males who
smoke is still considerably above the Healthy People
2000 target of 15 percent (see Figure 10).
CALL TO ACTION:
Physicians need to be more active in promoting healthy
behaviors for older patients. Physician-based interven-
tions are very influential with seniors. Studies have shown
that a physician’s advice to quit smoking plays a key role
in smoking cessation. Educational materials should be
made available to physicians to encourage them to rou-
tinely ask seniors about smoking, physical activity, diet,
and other health risk behaviors. The responsibility, how-
ever, should not fall only on physicians. Public awareness
campaigns could be developed to encourage older people
to talk to their physicians about the benefits of healthy
lifestyle changes.
Preventive Care and Cancer Screening
Healthy People 2000 included several goals that focused
on improving the use of preventive care health services,
such as immunizations and cancer screening tests.
Although older adults are more likely now than in the past
to use preventive health services, need for improvement
still exists.
Preventive Care
Pneumonia and influenza are the fifth-leading cause
of death among older Americans. More than 60,000
people 65 and older died of these illnesses in 2001.
Vaccinations can prevent these illnesses or substantially
reduce their severity. The costs of vaccinations are
covered under Medicare.
Indicator 5: Flu vaccine in past year
• Between 1989 and 2000, flu vaccinations for persons
age 65 and older doubled, and the target of 60 percent
established in Healthy People 2000 was met. However,
coverage needs to expand among older black and
Hispanic persons (see Figures 11 and 12).
Indicator 6: Ever had pneumonia vaccine
• Pneumonia vaccinations more than tripled between 1989
and 2000. However, coverage among older blacks and
Hispanics needs to greatly increase to meet the Healthy
People 2000 target of 60 percent (see Figures 11 and 12).
Cancer Screening
Some cancers, such as colorectal cancer and breast
cancer, can be treated if detected in their early stages.
Both Medicare and Medicaid cover mammograms.
06
f.9
SHARE OF 65+ WHO CONSUME 5+ FRUITS/VEGETABLE
SERVINGS DAILY HIGHER THAN FOR OTHER AGE GROUPS,
BUT STILL BELOW TARGET, 2000
Source: CDC, Behavioral Risk Factor Surveillance System Online Prevalence Database
Age 35-49
31.8%
20.2%
24.6%
Age 65+
50% - YEAR 2000 TARGET
Age 50-64
f.10
SHARE OF BLACK MALES 65+ WHO ARE CURRENT
SMOKERS EXCEEDS TARGET
30
20
10
1990-
1991-
Source: National Center for Health Statistics, Trends in Health and Aging Database
(Note: 1996 data not available)
Percent
Black Males
White Males
Black Females
White Females
1992-
1993-
1994
1995
1997-
1998-
15% YEAR
2000 TARGET
07
Indicator 7: Mammogram within past two years
• Between 1987 and 2000, the percentage of women age
65 or older who had a mammogram within the preced-
ing two years tripled, and racial and ethnic disparities
narrowed considerably. In 2000, all racial and ethnic
groups had reached the Healthy People 2000 target of
60 percent (see Figure 13).
Indicator 8: Ever had colorectal cancer screening
• Colorectal cancer is the second-leading cause of cancer
deaths in the U.S. Early detection greatly increases the
chances of survival, and detection procedures may
actually prevent the disease through the removal of
colon polyps. Regular colorectal screening is recom-
mended beginning at age 50. Medicare covers screen-
ing tests for those over age 65.
• In 1999, 49 percent of older Americans reported that
they have had a sigmoidoscopy or colonoscopy exam,
considerably above the Healthy People 2000 target of
40 percent.
CALL TO ACTION:
To reduce illness and death associated with influenza and
pneumonia infections, new strategies must be developed
to promote the use of Medicare-covered vaccination
services among racial and ethnic minority groups.
Fall-Related Deaths and Injuries
Healthy People 2000 included several goals for reducing
fall-related injury and death rates among older Americans.
Unintentional injuries are the eighth-leading cause of
deaths among adults age 65 or older, and they are a
major cause of disabilities and hospitalization. Falls and
fall-related injuries are the leading cause of injury death
among those 85 or older. Hip fractures are one of the
most serious outcomes associated with falls. Half of all
older adults hospitalized for hip fractures cannot return
home or live independently after their injuries.
Indicator 9: Hip fracture hospitalizations for
persons 65+
• Since 1990, hip fracture hospitalization rates among
adults age 65 or older have increased. Healthy People
2000’s goal was to reduce the rate of hospitalization
among adults age 65 or older to no more than 607 per
f.11
FLU VACCINATIONS FOR PERSONS AGE 65+ EXCEED
TARGET; PNEUMONIA LAGS BEHIND
60
50
40
30
20
10
1989
Source: National Health Interview Survey
Percent
1991
1993
1995
1997
1998
1999
Pneumonia
Vaccinations
70
60% - YEAR
2000 TARGET
2000
Flu Vaccinations
f.12
WHILE WHITES AGE 65+ APPROACH OR HAVE MET
NATIONAL IMMUNIZATION TARGETS, OTHER RACE
AND ETHNIC GROUPS FALL BEHIND, 2001
Source: National Health Interview Survey
Black,
Non-Hispanic
Flu vaccinations
in past year
Ever received
pneumonia
vaccine
32.9%
34.8%
65.4%
White,
Non-Hispanic
Hispanic
48.6%
51.8%
57.8%
60% - YEAR 2000 TARGET
f.13
IN 2000, ALL WOMEN AGE 65+ MET TARGET
FOR MAMMOGRAMS
60
50
40
30
20
10
1987
Source: National Health Interview Survey
Percent
1990
1991
1993
1994
1998
1999
70
60% - YEAR
2000 TARGET
2000
White, Non-Hispanic
Black, Non-Hispanic
Hispanic (N/A 1987)
100,000 persons. The 1998 rate was 863 per 100,000 per-
sons—42 percent higher than the target (see Figure 14).
Indicator 10: Deaths from falls and fall-related
injuries for persons age 85+
For people age 85 or older, unintentional fall-related
death rates gradually increased from 1990 through 1998,
exceeding the target for 2000 (see Figure 15).
CALL TO ACTION:
It is time to develop and implement a national strategy
for the prevention of falls among seniors. Because
adults 85 or older are the fastest-growing segment of
the elderly population, hip fracture hospitalization
rates and fall-related death rates will continue to climb
unless fall prevention strategies are improved. The most
effective fall prevention programs use a multifaceted
approach that includes education, exercise, vision
screenings, medication review, and home modifications
(installing grab bars and handrails, and improving light-
ing). Also, new products such as protective hip pads and
impact-absorbing floor materials can reduce fall-related
injuries and deaths.
08
f.14
HIP FRACTURES AMONG THE OLDER POPULATION
STILL EXCEED TARGET
Source: Trends in Health and Aging Database
National Center for Health Statistics
1990
757
841
776
815
814
818
1992
1993
1994
1998
607 - YEAR 2000 TARGET
934
879
863
1997
1996
1995
1991
f.15
FALL-RELATED DEATHS FOR PEOPLE AGE 85+
STILL EXCEED TARGET
Source: National Vital Statistics System
1990
147.3
149.5
143.1
147
147.5
152
1992
1993
1994
1998
105 - YEAR 2000 TARGET
159.6
160.3
162.7
1997
1996
1995
1991
09
SUMMARY OF FINDINGS:
At the state level, there has been
mixed progress:
• No states met all the targets.
• All states failed to meet targets for
physical activity, nutrition, and
weight for older Americans.
• All states, except Delaware, failed
to meet the target for pneumonia
vaccinations.
• All states met the target for mammo-
gram screenings.
• Only Nevada failed to meet the
smoking reduction target.
• Hawaii was most often ranked in the
top five. Kentucky was most often in
the bottom five.
• 48 states met the target for colorectal
cancer screening.
• 46 states met the target for flu
vaccinations.
• Variation among states can be signif-
icant. For example, in Colorado,
which ranked first in the category of
older Americans receiving flu vacci-
nations, 75 percent of older adults
got a flu shot—while the District of
Columbia ranked last in that cate-
gory, with only 55 percent of older
adults vaccinated (see Table 2).
STATES SHOW CONSIDERABLE VARIATION IN REPORT CARD RANKINGS
Table 2
* See Appendix, Table 5, for a full description of Healthy People 2000 targets.
** There is no state data available for Indicator 9.
Number of
Best Ranked Worst Ranked Healthy People States That
Indicator State State 2000 Target* Met Target
Health Behaviors
1. No Physical Activity During Utah (22) Kentucky (50) 22 0
Leisure-Time In Past Month (%)
2. Overweight (%) Hawaii (32) North Dakota (44) 20 0
3. Eating 5+ Fruits/Veg. Daily (%) Mass. (45) Mississippi (20) 50 0
4. Current Smoker (%) Utah (5) Nevada (18) 15 50
Preventive Care and
Cancer Screening
5. Flu Vaccine in Past Year (%) Colorado (75) D.C. (55) 60 46
6. Ever had Pneumonia Delaware (60) D.C. (34) 60 1
Vaccine (%)
7. Mammogram within Arizona (85) Indiana (65) 60 51
Past 2 Years (%)
8. Ever had Colorectal Delaware (61) Oklahoma (33) 40 48
Screening (%)
Fall-Related Deaths and
Injuries per 100,000**
10. Fall-related Deaths, 85+ California (85) Minnesota (270) 105 N/A
The State-by-State Report
Card on Healthy Aging
This section includes the Report Card for the 50 states and the District of Columbia. Table 2 presents,
for each indicator, the best- and worst-ranked states, and how many states met each target. For each
state and the District of Columbia, the Report Card displays the state's most current data for the indi-
cator, and a grade of either “Pass” or “Fail” relative to the Healthy People 2000 target (see Table 3).
State rankings are also presented. However, because state-level data are not available for some indi-
cators, the states are graded on fewer targets than the nation as a whole.
10
Data Rank Grade Data Rank Grade Data Rank Grade Data Rank Grade Data Rank Grade
35.6 29 Fail 40.4 39 Fail 33.1 29 Fail 12.0 41 Pass 63.6 42 Pass
29.5 9 Fail 36.8 10 Fail 31.6 32 Fail 14.0 50 Pass 59.0 50 Fail
34.9 27 Fail 38.1 17 Fail 23.2 47 Fail 10.2 24 Pass 72.1 5 Pass
32.2 17 Fail 39.1 27 Fail 35.7 17 Fail 11.6 39 Pass 64.2 40 Pass
28.5 7 Fail 36.9 12 Fail 38.6 7 Fail 8.5 7 Pass 68.8 17 Pass
26.5 6 Fail 36.8 11 Fail 34.8 20 Fail 8.2 5 Pass 74.6 1 Pass
33.8 22 Fail 38.6 21 Fail 33.9 26 Fail 10.3 27 Pass 66.0 29 Pass
36.6 31 Fail 42.8 49 Fail 37.6 9 Fail 10.1 20 Pass 68.2 18 Pass
28.7 8 Fail 33.6 2 Fail 24.4 46 Fail 8.6 9 Pass 55.0 51 Fail
31.9 16 Fail 38.8 25 Fail 32.1 31 Fail 9.9 18 Pass 62.8 44 Pass
40.3 43 Fail 37.7 16 Fail 21.3 49 Fail 12.4 45 Pass 59.5 47 Fail
24.4 3 Fail 32 1 Fail 41.6 3 Fail 7.1 2 Pass 72.6 3 Pass
24.8 4 Fail 39.7 35 Fail 36.8 12 Fail 10.1 21 Pass 67.7 22 Pass
42.2 46 Fail 38.2 18 Fail 35.2 19 Fail 10.3 28 Pass 66.7 27 Pass
33.6 21 Fail 38.7 23 Fail 36.2 14 Fail 12.8 47 Pass 65.0 33 Pass
35.5 28 Fail 40.4 40 Fail 27.3 44 Fail 8.0 4 Pass 69.6 12 Pass
41.4 44 Fail 39.3 32 Fail 34.1 23 Fail 10.0 19 Pass 64.3 38 Pass
50.4 51 Fail 39.2 28 Fail 21.1 50 Fail 13.7 49 Pass 64.8 35 Pass
49 50 Fail 38.7 24 Fail 27.4 43 Fail 10.6 30 Pass 59.5 49 Fail
34 23 Fail 37.5 13 Fail 38.4 8 Fail 9.3 12 Pass 72.9 2 Pass
31.5 14 Fail 36 4 Fail 40.2 4 Fail 10.3 25 Pass 63.0 43 Pass
32.8 19 Fail 39.6 34 Fail 45.1 1 Fail 9.2 11 Pass 67.8 20 Pass
30.3 10 Fail 39.3 33 Fail 42.1 2 Fail 9.9 17 Pass 66.8 26 Pass
37 34 Fail 43.5 50 Fail 34 24 Fail 9.5 13 Pass 65.5 31 Pass
43 48 Fail 38.4 20 Fail 20.4 51 Fail 11.3 36 Pass 62.0 45 Pass
39.1 40 Fail 38.6 22 Fail 29 41 Fail 13.2 48 Pass 69.3 15 Pass
33.4 20 Fail 38.3 19 Fail 31.5 33 Fail 11.2 34 Pass 71.4 8 Pass
39.3 41 Fail 39.2 29 Fail 34 25 Fail 9.9 16 Pass 67.5 25 Pass
34.3 24 Fail 37.6 14 Fail 30.8 36 Fail 18.0 51 Fail 59.5 48 Fail
37 35 Fail 41.3 45 Fail 36.8 13 Fail 12.3 44 Pass 64.9 34 Pass
34.4 25 Fail 40.7 43 Fail 34.7 21 Fail 9.0 10 Pass 64.3 39 Pass
32.5 18 Fail 36.4 6 Fail 31.2 34 Fail 12.1 43 Pass 70.8 10 Pass
38.5 37 Fail 39.8 37 Fail 32.8 30 Fail 9.6 15 Pass 64.1 41 Pass
36.6 32 Fail 41.1 44 Fail 27.1 45 Fail 10.9 32 Pass 64.4 37 Pass
34.4 26 Fail 43.9 51 Fail 38.9 6 Fail 8.3 6 Pass 66.0 30 Pass
41.8 45 Fail 36.4 7 Fail 27.7 42 Fail 12.5 46 Pass 67.7 21 Pass
43.8 49 Fail 35.9 3 Fail 29.7 38 Fail 11.2 35 Pass 70.6 11 Pass
25.5 5 Fail 42.1 47 Fail 36.9 11 Fail 10.2 23 Pass 67.5 24 Pass
30.9 12 Fail 42.2 48 Fail 29.3 39 Fail 8.6 8 Pass 64.4 36 Pass
38.4 36 Fail 39.2 30 Fail 29.9 37 Fail 11.2 33 Pass 71.8 6 Pass
38.9 39 Fail 39.7 36 Fail 29.1 40 Fail 10.1 22 Pass 69.0 16 Pass
39.6 42 Fail 41.9 46 Fail 34.3 22 Fail 12.0 42 Pass 69.6 13 Pass
42.8 47 Fail 36.2 5 Fail 39.2 5 Fail 11.7 40 Pass 68.0 19 Pass
31.7 15 Fail 36.7 9 Fail 31.1 35 Fail 10.5 29 Pass 67.5 23 Pass
22.4 1 Fail 36.6 8 Fail 36.2 15 Fail 5.3 1 Pass 70.9 9 Pass
36.2 30 Fail 37.6 15 Fail 33.6 27 Fail 8.0 3 Pass 71.5 7 Pass
38.7 38 Fail 38.9 26 Fail 35.4 18 Fail 11.5 38 Pass 66.7 28 Pass
22.6 2 Fail 39.2 31 Fail 35.9 16 Fail 9.6 14 Pass 69.6 14 Pass
36.8 33 Fail 40.2 38 Fail 22.9 48 Fail 10.9 31 Pass 61.3 46 Pass
30.3 11 Fail 40.5 42 Fail 37.4 10 Fail 10.3 26 Pass 65.5 32 Pass
31.3 13 Fail 40.4 41 Fail 33.6 28 Fail 11.3 37 Pass 72.6 4 Pass
Alabama
Alaska
Arizona
Arkansas
California
Colorado
Connecticut
Delaware
Dist. of Columbia
Florida
Georgia
Hawaii
Idaho
Illinois
Indiana
Iowa
Kansas
Kentucky
Louisiana
Maine
Maryland
Massachusetts
Michigan
Minnesota
Mississippi
Missouri
Montana
Nebraska
Nevada
New Hampshire
New Jersey
New Mexico
New York
North Carolina
North Dakota
Ohio
Oklahoma
Oregon
Pennsylvania
Rhode Island
South Carolina
South Dakota
Tennessee
Texas
Utah
Vermont
Virginia
Washington
West Virginia
Wisconsin
Wyoming
No Physical Activity
during Leisure-Time,
2000 (%)
Overweight,
1998-2000 (%)
Eating 5 or More Fruits
and Vegetables,
1998-2000
Smoking,
1998-2000 (%)
Flu Vaccination,
1997-1999 (%)
STATE-BY-STATE REPORT CARD ON HEALTHY AGING
Table 3
Data Rank Grade Data Rank Grade Data Rank Grade Data Rank Grade N/A
50.7 23 Fail 73.9 25 Pass 48.7 30 Pass 91.8 4
41.4 49 Fail 81.6 4 Pass 58.2 2 Pass - -
56.3 5 Fail 85.0 1 Pass 45.0 40 Pass 192.4 42
44.8 47 Fail 66.6 48 Pass 43.2 43 Pass 120.3 17
53.4 18 Fail 81.3 7 Pass 56.4 6 Pass 85.1 1
58.2 2 Fail 75.5 19 Pass 54.9 9 Pass 188.7 41
46.0 42 Fail 79.3 11 Pass 53.7 15 Pass 102.6 11
59.8 1 Fail 81.9 3 Pass 61.0 1 Pass 155.1 31
33.7 51 Fail 84.5 2 Pass 57.3 5 Pass 92.1 5
49.5 30 Fail 81.4 6 Pass 53.1 17 Pass 92.3 6
49.6 28 Fail 69.2 44 Pass 53.7 14 Pass 158.5 33
53.8 15 Fail 78.1 13 Pass 56.3 7 Pass 138.3 27
52.7 19 Fail 69.7 43 Pass 47.7 33 Pass 217.3 47
48.8 32 Fail 72.6 30 Pass 48.5 31 Pass 89.2 3
45.6 43 Fail 64.7 51 Pass 47.0 36 Pass 127.8 21
56.3 4 Fail 70.0 41 Pass 50.0 25 Pass 193.8 44
49.4 31 Fail 75.2 21 Pass 44.1 42 Pass 158.2 32
45.4 46 Fail 68.4 45 Pass 39.1 50 Fail 129.6 24
37.4 50 Fail 70.5 37 Pass 44.9 41 Pass 97.3 9
53.7 17 Fail 76.1 16 Pass 49.1 28 Pass 182.4 38
47.6 38 Fail 80.3 9 Pass 51.6 18 Pass 97.9 10
54.8 11 Fail 80.7 8 Pass 46.5 38 Pass 96.7 8
51.7 21 Fail 79.1 12 Pass 55.9 8 Pass 105.3 13
48.8 33 Fail 67.0 47 Pass 57.3 4 Pass 270.1 50
48.2 36 Fail 66.1 50 Pass 42.9 45 Pass 143.1 29
48.6 34 Fail 70.4 38 Pass 47.1 35 Pass 164.4 34
56.0 8 Fail 72.4 31 Pass 49.8 26 Pass 216.7 46
52.3 20 Fail 66.6 49 Pass 42.3 47 Pass 193.1 43
57.9 3 Fail 74.0 24 Pass 50.4 22 Pass 93.7 7
55.2 10 Fail 77.0 14 Pass 51.1 20 Pass 105.7 14
45.6 44 Fail 73.0 28 Pass 45.7 39 Pass 88 2
51.7 22 Fail 73.3 26 Pass 48.2 32 Pass 232.1 48
44.4 48 Fail 73.1 27 Pass 50.2 24 Pass 103.9 12
54.7 12 Fail 75.7 18 Pass 46.6 37 Pass 134.8 25
47.9 37 Fail 76.2 15 Pass 51.2 19 Pass 187.3 40
47.4 39 Fail 71.3 35 Pass 47.3 34 Pass 123.4 19
47.2 40 Fail 70.1 39 Pass 32.8 51 Fail 145.4 30
56.1 7 Fail 76.1 17 Pass 53.7 16 Pass 178.8 37
49.7 27 Fail 75.1 22 Pass 43.0 44 Pass 121.9 18
50.1 26 Fail 81.5 5 Pass 50.5 21 Pass 140.2 28
49.5 29 Fail 79.4 10 Pass 41.6 48 Pass 117.3 16
45.5 45 Fail 74.6 23 Pass 49.1 27 Pass 184.9 39
50.2 24 Fail 69.8 42 Pass 42.9 46 Pass 128.5 22
50.2 25 Fail 71.7 33 Pass 50.3 23 Pass 114.9 15
55.4 9 Fail 70.9 36 Pass 54.7 10 Pass 129 23
54.1 14 Fail 72.3 32 Pass 48.8 29 Pass 208.8 45
54.4 13 Fail 73.0 29 Pass 54.4 12 Pass 137.4 26
53.7 16 Fail 75.4 20 Pass 53.9 13 Pass 174.1 36
46.9 41 Fail 71.6 34 Pass 39.6 49 Fail 127.4 20
48.2 35 Fail 70.1 40 Pass 57.8 3 Pass 240.6 49
56.1 6 Fail 68.1 46 Pass 54.7 11 Pass 171.9 35
Alabama
Alaska
Arizona
Arkansas
California
Colorado
Connecticut
Delaware
Dist. of Columbia
Florida
Georgia
Hawaii
Idaho
Illinois
Indiana
Iowa
Kansas
Kentucky
Louisiana
Maine
Maryland
Massachusetts
Michigan
Minnesota
Mississippi
Missouri
Montana
Nebraska
Nevada
New Hampshire
New Jersey
New Mexico
New York
North Carolina
North Dakota
Ohio
Oklahoma
Oregon
Pennsylvania
Rhode Island
South Carolina
South Dakota
Tennessee
Texas
Utah
Vermont
Virginia
Washington
West Virginia
Wisconsin
Wyoming
Pneumonia
Vaccination,
1997, 1999 (%)
Mammograms,
1998-2000 (%)
Colorectal Cancer
Screening,
1997, 1999 (%)
Fall-related Deaths, 85+
1997-1999
(per 100,000)
11
Older Americans’ Use of
Mental Health Services
Although adults age 65 or older comprise 12 percent
of the U.S. population, they use a disproportionately
lower share of inpatient and outpatient mental
health services.
• Older Americans account for only 7 percent of all
inpatient mental health services, 6 percent of commu-
nity-based mental health services, and 9 percent of
private psychiatric care (Persky, 1998).
• It is estimated that only half of older adults who
acknowledge mental health problems actually receive
treatment from any health care provider, and fewer
than 3 percent of those receive outpatient mental
health treatment by specialty mental health
providers—a rate that is lower than for any other
adult age group (Lebowitz et al., 1997).
Barriers to Mental Health Care
Older Americans’ underutilization of mental health
services has a number of causes:
Patient Barriers: Older adults often mistakenly believe
that mental health problems such as depression are nat-
ural conditions of older age, especially with prolonged
bereavement. According to a National Mental Health
Association survey, about 58 percent of those age 65
or older believe that it is “normal” for people to get
depressed as they grow older. While depression is not
a normal part of the aging process, it is likely to occur
when other chronic medical conditions are present (see
Figure 16). Unfortunately, symptoms of depression
often go unrecognized and untreated when they coin-
cide with other medical illnesses in later life. Older
adults with mental disorders tend to emphasize physical
complaints rather than psychological troubles in clinical
settings, making the detection of mental illness less
likely. This may be due, in part, to heightened concerns
about the stigma of mental illness within this generation
of older adults. This applies particularly to older men,
who have the highest suicide rate in the United States
(see Figure 17).
Provider Barriers: Most older adults who receive mental
health services obtain them in the context of a visit with
their primary care provider. Unfortunately, many primary
The first report of the U.S. Surgeon General on mental health (U.S. Department of Health and
Human Services, 1999), stated that almost 20 percent of older adults experience mental disorders
that are not a part of “normal aging.” Although there are effective treatments available for most
mental disorders, many older adults are never screened for or diagnosed with these illnesses, so
they do not receive treatment.
Mental Health
and Aging
12
13
care physicians receive insufficient training in mental
health and in geriatric assessment and care. Many physi-
cians mistakenly believe that depression is an inevitable
consequence of an older person’s physical illness and
disability. One study found that only 11 percent of
depressed patients in primary care received adequate
antidepressant treatment, while 34 percent received
inadequate treatment, and 55 percent received no treat-
ment (Katon et al., 1992).
Undetected or untreated, mental disorders such as
depression can cause severe impairment and can even be
fatal. In studies of older adults who committed suicide,
nearly all had major depression. Studies have found that
many older adults who committed suicide had visited a
primary care physician very close to the time of the sui-
cide—20 percent on the same day, 40 percent within one
week, and 70 percent within one month of the suicide
(Conwell, 1994).
Policy Barriers: Medicare’s higher reimbursement for
physical ailments than for mental health conditions
presents a barrier for older Americans in terms of
access to, and payment for, mental health services.
Current Medicare coverage rules require seniors to
pay a 50 percent co-payment for most outpatient
mental health services compared with 20 percent for
general medical services. The current disparity in
coverage between mental and physical disorders serves
to further the misperception of mental illness as “not
a health problem” and fails to acknowledge the fact
that treatment in elderly persons can be just as success-
ful as treatment in young persons. When properly
diagnosed and treated, 65 to 80 percent of depressed
older adults improve with medication, psychotherapy,
or a combination of both—a success rate higher than
many current common medical treatments for non-
psychiatric illnesses (U.S. Department of Health and
Human Services, 1999).
The Future Need for
Trained Professionals
According to the Surgeon General’s report, “disability
due to mental illness in individuals over 65 years old
will become a major public health problem in the near
future.” The number of older adults with major psy-
chiatric disorders is expected to increase dramatically
over the coming three decades to 15 million individuals,
compared with about 7 million in 2000. This growth
will have a major impact on the need for geriatric
mental health services and will result in a significant
increase in health service utilization and costs. In
1996, for example, the United States spent more
than $69 billion for the direct treatment of mental
disorders (or more than 7 percent of national health
expenditures).
According to the Federal Administration on Aging’s
2001 report, Older Adults and Mental Health, “more
geriatric mental health professional and paraprofessional
personnel are needed in the fields of medicine, mental
health, and social services.” Today, the nation has an esti-
mated 200 to 700 geropsychologists, and 2,400 geriatric
psychiatrists. Yet, current estimates suggest that at least
5,000 of each specialty are necessary to meet current
national needs, and shortages are expected to become
more severe in the coming decades as the number of
older Americans continues to grow (for a more detailed
discussion see page 15).
f.16
DEPRESSION OFTEN CO-EXISTS WITH OTHER
CHRONIC CONDITIONS
Source: Health and Retirement Study, 2000
Taking Medication for
High Blood Pressure
46%
33%
21%
21%
Treated for Cancer
in Past 2 Years
Activities Limited Because
of Lung Problem
Have Had a
Heart Attack
f.17
SUICIDE DEATH RATES HIGHEST AMONG
MALES AGE 65+, 1999
60
50
40
30
20
10
5-14
Source: National Center for Health Statistics, Trends in Health and Aging Database
Per
100,000
15-19
20-24
25-34
35-44
45-54
55-64
65-74
75-84
85+
Males
Females
CALL TO ACTION:
Primary care physicians are the main entry points for older
adults in need of mental health care. Yet the lack of
detection and treatment of mental illness in the primary
care setting is well documented. For these reasons, reform
must focus on improving the primary care treatment
of older adults with mental disorders. To reach this goal,
the Merck Institute of Aging & Health and the National
Academy on an Aging Society propose the following steps:
• Integrate mental health professionals into the primary
care setting. Several studies have shown that models of
collaborative care, including community mental health
teams and the pairing of mental health professionals
(including geriatric nurse specialists and geriatric social
workers) with primary care physicians, are effective and
economical ways to improve access and care for older
adults (Unutzer et al., 1999).
• Screen older adults for depression. In 2002, the U.S.
Preventive Services Task Force of the Agency for
Healthcare Research and Quality published recommen-
dations for systematic screening as a means of improving
the detection of depression in older adults. At the
same time, the Task Force has recommended that clin-
ical practices should have a well-functioning system in
place to follow depression screening with accurate
diagnosis, treatment, and follow-up. Currently, it is
estimated that only one-third of primary care providers
use screening tests for depression.
• Expand the Medicare reimbursement system for mental
health care of older adults. Currently, Medicare has
limited coverage for mental health care, excludes certain
qualified mental health providers, and covers few
mental health drug expenses. The disparity in
Medicare reimbursement between physical and
mental treatments serves to further the stigma, myths,
and misperceptions surrounding mental illness in
older adults. The current coverage rules also fail to
recognize that cost-effective treatments for late-life
mental illnesses are now available.
14
15
Less than half of medical schools have geriatric programs,
and less than half of baccalaureate nursing programs have
full-time faculty certified in geriatric nursing. A mandatory
geriatrics rotation in all medical schools would be wel-
comed, but it would not solve the problem. There are
approximately 650,000 physicians in the U.S. About
16,000 new doctors graduate from medical schools each
year. If geriatric training was required in every medical
school today, it would still take more than 40 years for
all practicing physicians to be replaced by those with
geriatric training.
The U.S. cannot afford to wait that long. In fewer
than 10 years, the baby boomers will start turning 65.
Although schools of medicine, nursing, and social work
are beginning to take steps to attract new students to the
field of geriatrics, it is imperative that the existing health
care workforce—physicians, nurses, therapists, pharma-
cists, and social workers—receive the training and educa-
tion necessary to address the needs of their expanding
pool of older patients.
Older Adults’ Use of Services
Older adults tend to use health services more than
younger adults do. Patients 65 or older visit physicians
an average of 11.4 times a year, compared with 7.2 visits
for the population between the ages of 45 and 65. The
oldest old—those at least 85—average 15 physician visits
each year (see Figure 18).
As a result, though adults 65 or older made up only
12 percent of the population in 2000, they made 24.3
percent of all physician office visits that year—about
200.3 million visits, according to the National Center
for Health Statistics (NCHS). About 45 percent of all
As the nation’s older population grows, the U.S. will require a well-trained workforce of health care
professionals. Compared with younger adults, older Americans use more services provided by
physicians, nurses, pharmacists, physical therapists, and other practitioners. Unfortunately, only a
small share of the 660,000 medical doctors in practice today—including specialists whose patients
are disproportionately elderly—receive the training and education in geriatrics necessary to provide
older Americans with the best possible care.
Training the Health Care
Workforce—Present and Future
f.18
AVERAGE NUMBER OF PHYSICIAN VISITS HIGHEST
AMONG PERSONS 65+, 1999
Source: Department of Health and Human Services
85+
7.2
15.0
11.4
65-84
Age 45-64
visits made by older adults are to primary care physicians
(see Figure 19).
For most medical specialists, older adults represent a
disproportionate share of their patients (see Table 4). For
family practitioners, 20.4 percent of their total patient
visits in 2000 were made by people age 65 or older, and
for internists, older adults made 39 percent of all visits.
The percentages were higher for cardiologists (59.7 per-
cent), ophthalmologists (51.5 percent), and urologists
(53.1 percent).
Unique Medical Needs of Older Adults
Many, if not most, health care professionals are not
trained to recognize the health needs of older adults.
Older Americans often have three or more chronic
medical conditions, take multiple daily medications, and
respond to treatments and medications differently than
do younger persons. Health care professionals not
trained in geriatric care may make incorrect diagnoses.
Medication-related problems among the elderly, includ-
ing improper dosing and adverse reactions, may account
for as many as 17 percent of hospitalizations of older
Americans, and may cost approximately $20 billion a
year in hospital stays (GAO, 1995).
Health problems in older adults are often misdiag-
nosed, overlooked, or dismissed as normal conditions of
aging because physicians are not trained to distinguish
diseases and impairments from the normal physiological
changes associated with aging. Physicians often consider
conditions like memory loss or incontinence to be expect-
ed side effects of aging, though appropriate interventions
can improve these conditions. Studies also suggest that
physicians hesitate to prescribe exercise regimens, smok-
ing cessation programs or cholesterol lowering strategies
to older patients, even though evidence shows that they
benefit from such therapies as well as younger persons.
The Role of Geriatrics-Trained
Health Care Professionals
Health care professionals who are trained in geriatrics can
help to maintain the health and quality of life of older
patients. The complex needs of older patients often require
a team of health care providers with aging-related expertise
to work together to assess the patient’s physical and mental
well being and to coordinate care in a variety of settings—
the patient’s home, the physician’s office, the hospital, and
the nursing home. Geriatric-care teams also work cooper-
atively with caregivers, such as family and friends, who
play a crucial role in helping the older patient maintain
health and independence.
16
f.19
45 PERCENT OF ALL VISITS BY PERSONS AGE 65+
ARE TO PRIMARY CARE PHYSICIANS, 1999-2000
Source: National Center for Health Statistics, Trends in Health and Aging Database
GP & FP
1.8%
4.7%
19.4%
1.2%
26%
3.1%
5.5%
4.6%
1.1%
12.8%
2%
13.1%
4.4%
Internal Med
General Surgery
OBGYN
Othopedic
Cardiovascular
Dermatology
Urology
Psychiatry
Neurology
Opthamology
Otolaryngology
All Others
Specialty Percentage of Total Visits in:
1981 1991 2000
All Specialties 18.4 23.2 24.3
General/Family Practice 19.3 19.9 20.4
Internal Medicine 34.4 37.7 39.0
Cardiology 46.1 53.4 59.7
Ophthalmology 39.3 55.0 51.5
Urology 37.6 45.8 53.1
General surgery 20.1 32.2 30.1
Neurology 17.7 19.9 28.5
Dermatology 13.4 27.9 26.3
Otolaryngology 16.9 17.7 22.3
Orthopedic surgery 13.7 17.9 20.4
Psychiatry 4.6 7.0 6.6
Obstetrics/gynecology 2.6 4.5 4.7
PERCENTAGE OF TOTAL VISITS TO VARIOUS
MEDICAL SPECIALTIES MADE BY PEOPLE
AGE 65 OR OLDER, 1981, 1991, 2000.
Table 4
Source: National Ambulatory Medical Care Survey
17
Specialty health care professionals could also benefit
from training in geriatrics. A cardiologist, for example, may
be more likely to look for signs of depression, which often
worsens conditions like hypertension and heart disease.
Family doctors and internists may be more likely to help
frail patients prevent fall-related injuries by reviewing
medications and checking vision.
Older patients who receive specialized geriatric care
tend to do better than those who receive usual care
(Kovner et al., 2002). In one study, patients who received
inpatient and outpatient care in geriatric units experienced
large reductions in functional decline and improvements
in mental health at no additional cost. In another study,
older patients cared for by nurses trained in geriatrics had
fewer readmissions to the hospital and were less likely to
be transferred from nursing facilities to a hospital for
inappropriate reasons.
Cost Savings
The financial benefits of care by specially trained
physicians and other health care workers are potentially
enormous. The Alliance for Aging Research estimates
that proper geriatric care could reduce hospital, nursing
home, and home care costs by at least 10 percent a
year, saving $50.4 billion in 2000 and $133.7 billion
in 2020. As one example, fall-related injuries among
older Americans cost $20.2 billion in direct medical
costs each year, according to the Centers for Disease
Control and Prevention (CDC). The CDC notes that the
number of falls could be reduced substantially through
a prevention strategy of exercise, vision correction,
medication review, and home modifications, such as
bathroom grab rails.
Shortages of Trained Professionals
The projected increase in the number of older baby
boomers comes alongside another demographic certainty:
The decline in the size of the working-age population
needed to support rising numbers of older Americans.
In 2000, there were three workers to support every
senior; by 2044, there will be two workers for every
senior, according to the Social Security Administration.
This projection has profound implications for the
health care workforce. The number of trained profes-
sionals, most of them baby boomers themselves, may
decline as the need for their services rises. For example,
about half of registered nurses are at least 45 years old,
higher than the average across all occupations. Their
retirement will aggravate an already severe nursing
shortage. The U.S. Bureau of Labor Statistics estimates
that employers will need to find replacements for
331,000 RNs between 1998 and 2008.
Medical schools have yet to make the same commit-
ment to geriatrics that they have made to pediatrics. In
2000, there were 62,386 pediatricians to treat 59 million
children up to age 14 (one pediatrician for every 945
children) compared with 9,000 geriatricians to treat about
35 million persons 65 and over (one for every 3,888
older persons). It is estimated that the U.S. needs 20,000
physician-geriatricians to adequately care for the current
older population. By 2030, the nation will need 36,000
geriatricians, according to estimates by the Alliance for
Aging Research.
Only 14 of the nation’s 145 medical schools include
geriatrics in their required courses. While 86 medical
schools offer an elective in geriatrics, only 3 percent of
medical students choose to register for these courses.
Less than one-half of 1 percent of medical school faculty
are geriatrics specialists. Though residency programs in
family practice and internal medicine require some geri-
atrics training, the length of rotation is not specified
(Alliance For Aging Research, 2002).
In the nursing field, less than 1 percent of the
nation’s 2.2 million practicing RNs are certified in geri-
atrics. In 2000, only 5 percent of all nurses who completed
either a clinical nurse specialist or nurse practitioner
program indicated gerontology as their specialty area.
Only 30 of the more than 670 baccalaureate nursing
programs met all the criteria for an exemplary geriatrics
education, such as including a stand-alone geriatrics
course and at least one full-time faculty member nation-
ally certified in geriatrics (Kovner et al., 2002).
Other health care professionals also lack specialized
training in gerontology. Only 720 of 200,000 pharmacists
have geriatric certification, according to the Commission
for Certification in Geriatric Pharmacy. Though the
Bureau of Labor Statistics notes that demand for social
workers with geriatrics training is projected to grow, only
a small percentage of graduating social workers report
majors in gerontology.
In addition, the supply of paraprofessionals in the
long-term care industry—home health aides, nursing
assistants, and personal aides—falls short of meeting
demand. Low wages and poor training are causing yearly
turnover rates estimated at about 45 percent in nursing
homes. A 2001 report by the Paraprofessional Healthcare
Institute notes that this caregiver gap will widen over the
next 30 years—when the elderly population will double—
while the population of traditional caregivers is expected
to grow by only 7 percent.
18
CALL TO ACTION
To prepare for the coming demographic realities, the
U.S. must take immediate steps to reform professional
health education, equipping future physicians, nurses,
and other health workers with skills in geriatrics.
Medical schools must create programs in geriatrics.
Nursing programs must introduce geriatrics content
into their required curriculum. Students in health pro-
fessional education programs should have required
courses concerning the care of older adults.
However, the nation also must ensure that the cur-
rent workforce of health care professionals develops
the necessary knowledge and techniques to address
the complexity of delivering care to the already grow-
ing elder population. The goal: to provide every health
care worker today with some education and training
in geriatrics.
To reach this goal, the Merck Institute of Aging &
Health and the National Academy on an Aging Society
propose the following steps:
• Engage physicians, nurses, and other health care pro-
fessionals in lifelong training in geriatric medicine.
Academic schools of medicine, nursing, and social
work must develop continuing education programs in
geriatrics for local professionals. Education programs
should be geared to professionals who do not have
any training in geriatrics and to those who need to
maintain existing expertise. Academies and boards
that represent specialties should work with universi-
ties on course development and encourage their
members to take these courses.
• Mandate a specified number of credits in geriatrics as
a condition for license renewal. This would apply to
states with requirements for continuing medical edu-
cation (CME) for the relicensing of physicians, nurses,
pharmacists, and other health care professionals.
• Base CME for physicians in geriatrics on new models
of practicing-physician education. Research shows that
formal CME conferences are not effective (Oxman,
2002). The Practicing Physician Education Project
funded by the John A. Hartford Foundation and the
American Geriatrics Society, found that models using
small groups, physician leaders in the community, and
interactive case studies were able to make a differ-
ence. For example, toolkits on memory loss and incon-
tinence help physicians to improve the way in which
they evaluate and treat these conditions (Barry, 2002).
• Require that state regulators, who oversee nursing
homes, assisted living facilities, and home health
agencies, provide specialized geriatrics training to
their paraprofessional staff. These workers should
develop specific skills related to caring for patients
with Alzheimer’s disease, physical disabilities, and
depression.
• Congress must reconsider its reimbursement policies
under Medicare. Although Medicare reimburses for
individual conditions, it does not reimburse primary
care physicians or case managers for the time it takes
to coordinate care among the many providers who
may be treating an older person. Congress should pass
the Geriatric Care Act (S. 2057/H.R. 3027), which would
authorize Medicare coverage of geriatric assessment
and care coordination services for frail or impaired
older adults.
19
Indicator Healthy People 2000 Tar get
Health Behaviors
1. No Physical Activity During Leisure-Time No more than 22% people age 65+ with no leisure-time activity
2. Overweight No more than 20% people age 20+ who are overweight (BMI >= 27.3)*
3. Eating 5+ Fruits/Veg. Daily At least 50% people age 2+ who eat 5+ servings of fruit/vegetables a day*
4. Current Smoker No more than 15% people age 18+ who smoke*
Preventive Care and Cancer Screening
5. Flu Vaccine in Past Year At least 60% of people age 65+ who had a flu shot within the past year
6. Ever had Pneumonia Vaccine At least 60% of people age 65+ who had ever received a pneumonia vaccination
7. Mammogram within Past 2 Years At least 60% of women age 70+ who had a mammogram within the past 2 years
8. Ever had Colorectal Screening At least 40% people age 50+ who have ever received a sigmoidoscopy*
Fall-related Deaths and Injuries
9. Hip Fractures No more than 607 per 100,000 hospitalizations for hip fractures, adults 65+
10. Fall-related Deaths No more than 105 per 100,000 deaths from falls and fall-related injuries, adults 85+
Data Sources
Behavioral Risk Factor Surveillance System
The BRFSS is the world's largest telephone survey used
to track health risks in the United States. The Centers
for Disease Control and Prevention created a standard
questionnaire for states to collect data on an ongoing
basis that can be compared across states. The BRFSS is
administered and supported by the Division of Adult and
Community Health, National Center for Chronic
Disease Prevention and Health Promotion at the CDC.
For more information, go to:
Health and Retirement Study
The Health and Retirement Study (HRS) surveys over
22,000 Americans age 50 and older every two years. The
HRS collects data about the physical and mental health
of Americans as well information about older Americans'
insurance coverage, financial status, family support sys-
tems, labor market status, and retirement planning. For
more information, go to: />National Ambulatory Medical Care Survey
The National Ambulatory Medical Care Survey (NAMCS)
is a national survey providing data about the availability
and use of ambulatory medical care services. Information
in the survey is taken from the perspective of the physician.
Data results from the survey are based on a sample of visits
to nonfederally employed office-based physicians, most of
whom provide direct patient care. For further information,
go to: />National Center for Health Statistics,
Trends in Health and Aging Database
The NCHS electronic data warehouse on Trends in
Health and Aging provides data about trends in health-
Appendix
REPORT CARD INDICATORS AND HEALTHY PEOPLE 2000 TARGETS
Table 5
* No specific target for people age 65+ identified.