Chemical evolution of volatile organic compounds in the outflow of the Mexico City Metropolitan area potx
Bạn đang xem bản rút gọn của tài liệu. Xem và tải ngay bản đầy đủ của tài liệu tại đây (10.16 MB, 23 trang )
Atmos. Chem. Phys., 10, 2353–2376, 2010
www.atmos-chem-phys.net/10/2353/2010/
© Author(s) 2010. This work is distributed under
the Creative Commons Attribution 3.0 License.
Atmospheric
Chemistry
and Physics
Chemical evolution of volatile organic compounds in the outflow of
the Mexico City Metropolitan area
E. C. Apel
1
, L. K. Emmons
1
, T. Karl
1
, F. Flocke
1
, A. J. Hills
1
, S. Madronich
1
, J. Lee-Taylor
1
, A. Fried
1
, P. Weibring
1
,
J. Walega
1
, D. Richter
1
, X. Tie
1
, L. Mauldin
1
, T. Campos
1
, A. Weinheimer
1
, D. Knapp
1
, B. Sive
2
, L. Kleinman
3
,
S. Springston
3
, R. Zaveri
4
, J. Ortega
4,*
, P. Voss
5
, D. Blake
6
, A. Baker
6
, C. Warneke
7
, D. Welsh-Bon
7
, J. de Gouw
7
,
J. Zheng
8
, R. Zhang
8
, J. Rudolph
9
, W. Junkermann
10
, and D. D. Riemer
11
1
National Center for Atmospheric Research, Boulder, CO, USA
2
University of New Hampshire, Durham, NH, USA
3
Brookhaven National Laboratory, Upton, NY, USA
4
Pacific Northwest National Laboratory, Richland, WA, USA
5
Smith College and the University of Massachusetts, Amherst, MA, USA
6
University of California, Irvine, CA, USA
7
National Oceanic and Atmospheric Administration, Boulder, CO, USA
8
Department of Atmospheric Sciences, Texas A&M, College Station, TX, USA
9
York University, Toronto, Ontario, Canada
10
Institute for Meteorology and Climate Research, IMK-IFU, Research Center Karlsruhe, Garmisch-Partenkirchen, Germany
11
University of Miami, Rosenstiel School of Marine and Atmospheric Sciences, Miami, FL, USA
*
currently at: the National Center for Atmospheric Research, Boulder, CO, USA
Received: 07 October 2009 – Published in Atmos. Chem. Phys. Discuss.: 12 November 2009
Revised: 12 February 2010 – Accepted: 20 February 2010 – Published: 8 March 2010
Abstract. The volatile organic compound (VOC) distribu-
tion in the Mexico City Metropolitan Area (MCMA) and its
evolution as it is uplifted and transported out of the MCMA
basin was studied during the 2006 MILAGRO/MIRAGE-
Mex field campaign. The results show that in the morning
hours in the city center, the VOC distribution is dominated by
non-methane hydrocarbons (NMHCs) but with a substantial
contribution from oxygenated volatile organic compounds
(OVOCs), predominantly from primary emissions. Alkanes
account for a large part of the NMHC distribution in terms of
mixing ratios. In terms of reactivity, NMHCs also dominate
overall, especially in the morning hours. However, in the af-
ternoon, as the boundary layer lifts and air is mixed and aged
within the basin, the distribution changes as secondary prod-
ucts are formed. The WRF-Chem (Weather Research and
Forecasting with Chemistry) model and MOZART (Model
for Ozone and Related chemical Tracers) were able to ap-
proximate the observed MCMA daytime patterns and ab-
Correspondence to: E. C. Apel
()
solute values of the VOC OH reactivity. The MOZART
model is also in agreement with observations showing that
NMHCs dominate the reactivity distribution except in the
afternoon hours. The WRF-Chem and MOZART models
showed higher reactivity than the experimental data during
the nighttime cycle, perhaps indicating problems with the
modeled nighttime boundary layer height.
A northeast transport event was studied in which air orig-
inating in the MCMA was intercepted aloft with the De-
partment of Energy (DOE) G1 on 18 March and downwind
with the National Center for Atmospheric Research (NCAR)
C130 one day later on 19 March. A number of identical
species measured aboard each aircraft gave insight into the
chemical evolution of the plume as it aged and was trans-
ported as far as 1000km downwind; ozone was shown to be
photochemically produced in the plume. The WRF-Chem
and MOZART models were used to examine the spatial ex-
tent and temporal evolution of the plume and to help inter-
pret the observed OH reactivity. The model results generally
showed good agreement with experimental results for the to-
tal VOC OH reactivity downwind and gave insight into the
distributions of VOC chemical classes. A box model with
Published by Copernicus Publications on behalf of the European Geosciences Union.
2354 E. C. Apel et al.: Chemical evolution of volatile organic compounds
detailed gas phase chemistry (NCAR Master Mechanism),
initialized with concentrations observed at one of the ground
sites in the MCMA, was used to examine the expected evo-
lution of specific VOCs over a 1–2 day period. The models
clearly supported the experimental evidence for NMHC oxi-
dation leading to the formation of OVOCs downwind, which
then become the primary fuel for ozone production far away
from the MCMA.
1 Introduction
The influence of large urban centers on regional atmospheres
is a topic of increasing interest to the atmospheric science
community as the number of megacities (cities with popula-
tions >10 million people) continues to grow. Mexico City
is a megacity that has continued to grow in both popula-
tion and area and is one of the largest cities in the world.
Numerous studies have reported (e.g., Molina and Molina,
2002) on both the current status of air quality in the Mex-
ico City Metropolitan Area (MCMA) and on more fully un-
derstanding the root causes of air pollution in the area. Al-
though lagging most US and European cities, MCMA has
implemented new technologies to help improve air quality;
overall, air quality has improved over the last decade even
though very high emissions of ozone precursors, nitrogen ox-
ides (NO
x
) and VOCs, as well as primary particulate matter
(PM) remain (Molina and Molina, 2002). Fewer studies have
looked at the outflow from the city in terms of spatial extent
and temporal evolution. This is of topical interest since the
export of pollutants from megacities and concentrated urban
centers to downwind areas is of growing concern and has
led to an awareness that regional areas may be impacted by
this outflow and that urban centers downwind may experi-
ence significantly greater challenges with their air pollution
mitigation strategies because of the importation of pollutants.
This can also happen on inter-continental spatial scales. A
prime example is in the western United States where concern
has heightened over pollutants being transported across the
Pacific from the rapidly industrializing Asian subcontinent
(e.g., Jacob et al., 2003; Parrish et al., 2004).
Tracking the export of pollutants and understanding the
impact of large urban centers on downwind air quality is sci-
entifically challenging and requires a synthesis of observa-
tional data and modeling results. The MIRAGE-Mex field
experiment was designed to characterize the chemical and
physical transformations and the ultimate fate of pollutants
exported from the MCMA, and was part of the MILAGRO
group of field campaigns. An overview of the field campaign
is given by Molina et al. (2008, 2010). The MCMA, located
in an elevated basin, is relatively isolated from other large
urban centers and, in this respect, can be considered a pollu-
tion point source, making it a good candidate for this study.
A combination of ground-based experiments, aircraft exper-
iments with different but overlapping spatial coverage and
instrument payloads, and zero-dimensional, regional, and
global models were used to investigate plumes as they exited
the MCMA and evolved in space and time. This evolution
involves significant chemical transformations which, in turn,
require instrumentation capable of measuring the secondary
products that result from atmospheric processing. To track
the outflow it is necessary to first quantify the composition
of air in the MCMA basin. This was done with a network
of three instrumented sites set up along the statistically most
significant outflow path: T0, located approximately 11km
miles north-northeast of downtown Mexico City; T1, located
approximately 32 km northeast of T0; and T2, located ap-
proximately 64 km northeast of the city. For the analysis
presented here, we take advantage of measurements from
T0 and T1, sites that were heavily instrumented for trace-
gas analysis as well as from the DOE G1 aircraft, which
repeatedly sampled MCMA air aloft, and the NCAR C130
aircraft which made measurements over the MCMA and up
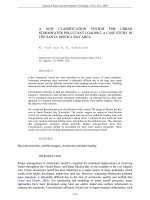
to 1000km downwind of the city. Figure 1 (top panel) shows
all of the flight tracks taken by the C130 during the experi-
ment with the 19 March flight shown in green as it will be
highlighted in the discussion section. There were a number
of flights in which the C130 flew over the city including the
T0, T1, and T2 ground stations and these are shown in the
lower panel of Fig. 1. A box is drawn around the area that is
defined in this paper as the MCMA for over-flight analyses.
In this paper we focus specifically on the characterization
of volatile organic compounds (VOCs) in the MCMA, both
on the ground and aloft and on the emission, transport, and
transformation of VOCs downwind of the metropolitan area.
Measurable VOCs as defined here consist of non-methane
hydrocarbons (NMHCs) and oxygenated volatile organic
compounds (OVOCs), including formaldehyde. NMHCs
have primary anthropogenic emission sources which can in-
clude evaporative emissions, exhaust, industrial, liquefied
petroleum gas, and biomass burning. Sources of OVOCs
include primary anthropogenic emissions, primary biogenic
emissions, biomass burning, and secondary photochemical
formation from both anthropogenic and biogenic sources.
Measurements of numerous VOCs on the ground and from
the C130 and G1 were used to characterize the initial emis-
sion conditions, fingerprint the signature of MCMA plumes,
and follow the plumes in space and time.
The regional model, WRF with tracers, and the global
chemical transport model, MOZART (Emmons et al.,
2010a), were used during the experiment to aid in the flight
planning, to locate plumes and to help determine when and
where the various aircraft would intercept the plumes. Post-
experiment, WRF-Chem (Grell et al., 2005; Tie et al., 2009),
and MOZART were used to characterize the air masses as
they were transported from the MCMA and, at times, en-
countered by the aircraft, in which case comparisons be-
tween the measurements and models could be made. A pho-
tochemical 0-D box model, the NCAR Master Mechanism
Atmos. Chem. Phys., 10, 2353–2376, 2010 www.atmos-chem-phys.net/10/2353/2010/
E. C. Apel et al.: Chemical evolution of volatile organic compounds 2355
Fig. 1. (top panel) Map of Mexico and the flight tracks taken by
the NCAR C130 during the experiment. The flight track for the
19 March outflow event is shown in green. (bottom panel) Map
showing the T0, T1 and T2 sampling sites, the box (outlined in
blue) showing the MCMA as defined in this paper for over-flight
analyses and the flight tracks (red) that passed through the box.
(Madronich, 2006) initialized by ground-based measure-
ments, was used to help interpret observed product VOC
species downwind. The transformation of VOCs from pri-
mary to secondary species and its impact on the reactivity of
the VOC mix downwind is discussed.
An important concept in this paper is the “OH reactivity”
(or OH loss rate) provided by individual and classes of VOC
species. This will be used to help understand the chemical
transformation of air parcels as they are exported out of and
downwind of the MCMA. For organic compounds the VOC
+ OH reaction initiates the oxidation sequence producing or-
ganic peroxy radicals, shown here for alkanes,
RH+OH+O
2
→ RO
2
+ H
2
O (R1)
where RH represents a VOC with abstractable hydrogen to
produce water and an alkyl peroxy radical. Next, the alkyl
peroxy radical may react with NO when present,
RO
2
+ NO→ RO+NO
2
(R2)
to produce an alkoxy radical that reacts with O
2
,
RO+O
2
→ carbonyls+HO
2
(R3)
Alternatively, under low NO
x
conditions, the peroxy radi-
cals may react with each other to produce species that may be
water-soluble, form aerosols or further react with OH. These
conditions were rarely experienced during this study. Ozone
production scales with OH reactivity when NO
x
is elevated.
Reaction (R1) represents a major sink term for OH radicals
in the atmosphere. The overall sink term is estimated by cal-
culating OH loss frequencies (product of concentration and
rate coefficient) for all individually measured species,
n
i
k
(VOC
i
+OH)
[VOC
i
] (R4)
which gives the OH reactivity, the term used in this paper.
The ability of models to reproduce the OH reactivity is an
important step in predicting ozone production (Stroud et al.,
2008; Tie et al., 2009). Carbon monoxide (CO) and nitrogen
dioxide (NO
2
), and to a smaller extent methane (CH
4
) are
also contributors to the OH loss rate, especially in the city.
CO will be discussed in this context.
2 Experimental technique
2.1 Measurements overview
A number of coordinated ground-based and aircraft-based
experiments were conducted in March of 2006. As men-
tioned in the introduction, aircraft measurements from the
NCAR C130 and the DOE G1 are used as well as ground-
based VOC measurements from the T0 site (city center) and
the T1 site (outside city center and to the northeast). The
geographical location and coverage by aircraft are shown in
Fig. 1.
For the C-130 aircraft, a total of 12 flights took place
between 4 and 29 March. Two flights (10 and 11) were
short flights of three hours duration, while the others were
approximately eight hours. Some of the flights were de-
signed to fly over remote regions either to detect long-range
plume transport (more than 1000km from the Mexico City)
or to measure biomass fire plumes. Figure 1 (top panel)
shows a map of Mexico with all of the C-130 flight paths
superimposed. For this paper, we selected flights in which
the flight paths crossed over Mexico City and/or intercepted
plumes downwind (northeast) of the city. Flight 7 (19 March,
shown in green) will be discussed in the context of transport
of the Mexico City plume. Figure 1 (lower panel) shows
paths taken for the three research flights that crossed over the
www.atmos-chem-phys.net/10/2353/2010/ Atmos. Chem. Phys., 10, 2353–2376, 2010
2356 E. C. Apel et al.: Chemical evolution of volatile organic compounds
city. Measurements of VOCs were made on the C130 with
three methods: canister collection for subsequent analysis
in the laboratory, proton transfer mass spectrometry (PTR-
MS), and the Trace Organic Gas Analyzer (TOGA), an in-
situ gas chromatograph/mass spectrometer (GC-MS). The
canister measurements were made by the UC Irvine group
and included a full suite of NMHC, organic nitrates, and
halogenated species. The NCAR TOGA instrument con-
tinuously measured every 2.8 min 32 species including se-
lect NMHCs, halogenated compounds, and monofunctional
non-acid OVOCs. The NCAR PTR-MS targeted 12 ions and
included aromatics and OVOCs. Combined, good coverage
was obtained but, for most VOC species, at lower time res-
olution than is available for continuous measurements for
species such as O
3
, NO
x
, CO, etc. The TOGA measure-
ments for OVOCs were used in this analysis. Formaldehyde
was continuously measured on the C-130 with a Difference
Frequency Generation Absorption Spectrometer (DFGAS)
(Weibring et al., 2007).
The C-130 MCMA over-flights were used to characterize
the VOC emission signatures aloft. In addition, the C-130 in-
tercepted a plume on 19 March that had been sampled a day
earlier by the G1. This was a NE transport event at high alti-
tude (4–5.2 km). Air with one to two day transport time from
the source was sampled (Voss et al., 2010). As in all flights, a
full suite of physical measurements was obtained. A compre-
hensive suite of trace gas and aerosol data was also obtained
on both the C130 and G1 aircraft at varying frequencies, with
the fastest measurements taken at 1 Hz, e.g., O
3
, CO, NO,
NO
2
, and NO
y
. The C130 and DC-8 flight data are archived
at The G1
flight data are archived at />20Field%20Programs/2006MAXMex/.
2.2 Specific VOC measurements
2.2.1 Ground-based measurements
Canister measurements conducted by the University of Cal-
ifornia, Irvine (UCI) were used to characterize the NMHCs
at the T0 and T1 sites. Air samples were collected in previ-
ously evacuated canisters. At T0, individual canisters were
filled to 350–700 hPa over 30–60 min with variable sampling
times; a total of 200 canisters were collected. At T1, canis-
ters were filled to 1000 hPa with the sampling time centered
at midnight, 3a.m., 6 a.m., etc.; a total of 200 canisters were
collected. Flow was controlled during sample collection with
a mass flow controller at both sites. After collection, the can-
isters were transported back to the UCI laboratory and ana-
lyzed for more than 50 trace gases comprising hydrocarbons,
halocarbons, dimethyl sulfide (DMS), and alkyl nitrates. In
brief, each sample of 1520±1 cm
3
(STP) of air was precon-
centrated in a trap cooled with liquid nitrogen, the trap was
then warmed by ∼80
◦
C water, releasing the VOCs into the
carrier flow where it was split into six streams, each stream
being directed to a different gas chromatograph with a spe-
cific column and detector combination. The sample con-
tacts only stainless steel from the sample canister to the 6-
port splitter and is connected to the columns via Silcosteel®
tubing (0.53 mm O.D.; Restek Corporation). The columns
are all cryogenically cooled during injection and then fol-
low prescribed temperature ramp programs. The sample split
is highly reproducible as long as the specific humidity of
the injected air is above a certain level, estimated to be 2 g
H
2
O/kg air. This was ensured by adding ∼2.4 kPa of water
into each evacuated canister just before they were sent out to
the field. The low molecular weight NMHCs were separated
by a J&W Scientific Al
2
O
3
PLOT column (30 m, 0.53mm)
connected to a flame ionization detector (FID). The detec-
tion limit of each NMHC is 1 pptv. All NMHCs were cali-
brated against whole air working standards, which had been
calibrated against NIST and Scott Specialty Gases standards.
The precision of the C
2
-C
4
NMHC analysis was ±3% when
compared to NIST standards during the Non-Methane Hy-
drocarbon Intercomparison Experiment (NOMHICE) (Apel
et al., 1994, 1999). Further details are given by Colman et
al. (2001).
Continuous measurements of 38 masses associated with
VOCs were made at the T0 site by the Texas A&M PTR-
MS from 5 to 31 March (except from the 23rd through the
26th). The measurements from this group discussed here are
acetaldehyde, methanol, acetone, and methyl ethyl ketone
(MEK). The T0 measurements were made on the rooftop
of a five-story building. A detailed description of the in-
strument and measurement procedures has been provided
by Fortner et al. (2009). A 14-ft 0.25-in OD PFA tubing
was used as the inlet (5-ft above the roof surface) through
which about 30 SLPM sample flow was maintained by a
diaphragm pump. During operation, the drift tube pres-
sure was maintained at 2.1 millibars and an E/N ratio of
115 Townsend (1Td= 10
17
V cm
2
molecule
−1
) was utilized.
Each of the masses was monitored for 2 s and it took ap-
proximately two min to complete one selected ion monitor-
ing (SIM) scan. Backgrounds were checked for ∼15min ev-
ery three hours removing VOCs from the airflow using a cus-
tom made catalytic converter. Calibrations were performed
daily using commercial standards (Spectra Gases) including
alkenes, oxygenated VOCs, and aromatics. The interpreta-
tion of mass spectral assignments was based on literature rec-
ommendations by de Gouw and Warneke (2007) and Rogers
et al. (2006). For species that could not be calibrated on-
site, concentrations were determined based on ion-molecular
reactions using rate constants reported by Zhao and Zhang
(2004).
In addition to the canister measurements of VOCs at T1,
on-line continuous measurements were made with a PIT-
MS (Warneke et al., 2005; de Gouw et al., 2009) operated
by the National Oceanic and Atmospheric Administration
(NOAA). The instrument is similar to a PTR-MS, but uses
an ion trap as a mass spectrometer. Measurements for the
Atmos. Chem. Phys., 10, 2353–2376, 2010 www.atmos-chem-phys.net/10/2353/2010/
E. C. Apel et al.: Chemical evolution of volatile organic compounds 2357
following compounds were utilized in this paper: methanol,
acetaldehyde, acetone, and methyl ethyl ketone (MEK). An
on-line gas chromatograph with flame ionization detection
(GC-FID), operated by NOAA was also used at T1 to mea-
sure a number of different hydrocarbon species. In this paper,
the UCI canister measurements for NMHCs are used, primar-
ily to ensure consistency between measurements from the T0
andT1 sites. A full description of the T1 VOC measurements,
including techniques, is given by de Gouw et al. (2009).
Formaldehyde (CH
2
O) measurements were made with a
modified Aero-Laser AL4001, a commercially available in-
strument, by the Institute for Meteorology and Climate Re-
search (IMK-IFU, Research Center Karlsruhe, Garmisch-
Partenkirchen). This instrument is based on the Hantzsch
technique which is a sensitive wet chemical fluorimetric
method that is specific to CH
2
O. The transfer of formalde-
hyde from thegas phase into the liquid phase is accomplished
quantitatively by stripping the CH
2
O from the air in a strip-
ping coil with a well defined exchange time between gas and
liquid phase. Formaldehyde was measured at two minute
time intervals at both the T0 and T1 sites. A full description
of the instrument and its performance is given in Junkermann
and Burger (2006), and an instrumental intercomparison in
Hak et al. (2005).
2.2.2 Aircraft – NCAR C130 and DOE G1
The analyses of canisters collected on the ground and in the
air (C130) are identical. Unlike the ground-based canister
sample collection, the aircraft canisters were pressurized to
3500 hPa without using a flow controller which resulted in
sample collection times ranging from approximately 30 sec-
onds to two min. The number of canisters committed to par-
ticular flight legs for individual flights was variable since
the total number of canisters available per flight was finite
(72). The PTR-MS flown on the C130 has been thoroughly
described in the literature (e.g., Lindinger et al., 1998; de
Gouw and Warneke, 2007). For this deployment, 12 ions
were targeted for analysis (Karl et al., 2009). These included
OVOCs, acetonitrile, benzene, toluene, and C8 and C9 aro-
matics, as well as the more polar species acetic acid and
hydroxyacetone. The measurement frequency was variable
but the suite of measurements was typically recorded each
minute; during some over-city runs the instrument recorded
benzene and toluene measurements at 1 Hz in order to obtain
flux profiling in the MCMA (Karl et al., 2009).
The TOGA instrument has not been previously described
in the literature although there are some similarities to a pre-
vious version of the instrument which have been documented
(Apel et al., 2003). The system is composed of the inlet,
cryogenic preconcentrator, gas chromatograph, mass spec-
trometer, zero air/calibration system, and the data system.
All processes and data acquisition are computer controlled.
The basic design of the cryogenic preconcentrator is similar
to the system described by Apel et al. (2003). Three traps are
used; a water trap, anenrichment trap and a cryofocusing trap
with no adsorbents in any of the traps. The gas chromato-
graph (GC) is a custom designed unit that is lightweight and
temperature programmable. The GC is fitted with a Restek
MTX-624 column (I.D. = 0.18µm, length =8m).
An Agilent 5973 Mass Spectrometer with a fast electron-
ics package was used for detection. A non-standard three-
stage pumping system was used consisting of a Varian 301
turbomolecular pump, an Adixen (model MDP 5011) molec-
ular drag pump and a DC-motor scroll pump (Air Squared,
model V16H30N3.25). The sample volume during this ex-
periment was 33ml. Detection limits were compound de-
pendent but ranged from sub-pptv to 20 pptv. The initial
GC oven temperature of 30
◦
C was held for 10 s followed
by heating to 140
◦
C at a rate of 110
◦
C min
−1
(60 s). The
oven was then immediately cooled to prepare for the next
sample. Helium was used as the carrier gas at a flow rate
of 1 ml min
−1
. The system was calibrated with an in-house
gravimetrically prepared mixture that had 25 of a targeted
32 compounds. Post-mission calibrations were performed to
obtain response factors for the seven compounds not in the
standard. The calibration mixture was dynamically diluted
with scrubbed ambient (outside aircraft) air to mixing ratios
near typically observed levels. A full description of the in-
strument will be available in a future publication.
The 32 compounds TOGA targeted included OVOC,
NMHC, halogenated organic compounds and acetonitrile.
Simultaneous measurements were obtained for all com-
pounds every 2.8min. Measurement comparisons for TOGA
and the canister system were excellent for co-measured
NMHCs and halogenated VOCs (
a.
gov/cgi-bin/arcstat-b). Agreement between TOGA and the
C130 PTR-MS were also generally good (usually within
20%) for co-measured species but with greater overall dif-
ferences than with the canister/TOGA measurements.
The DOE G1 was also equipped with a PTR-MS that mea-
sured similar species to the NCAR PTR-MS system. On
18 March, the DOE-G1 and NCAR C-130 flew side-by-side
transects over the T1 site (21:15–21:36 UTC) for intercom-
parison purposes. The two PTR-MS instruments were com-
pared to TOGA showing good agreement for a number of
species such as acetone and benzene but discrepancies on the
order of 30% for other species (Ortega et al., 2006). A lim-
ited number of canister samples were also collected on the
G1 and analyzed for a suite of NMHCs by York University.
The York group participated in the NOMHICE program and
showed excellent agreement with reference results (Apel et
al., 1994, 1999). The majority of the DOE G1 flight hours
were carried out in and around the MCMA at altitudes rang-
ing from 2.2 to 5 km. These measurements were used to ex-
amine the gas phase and aerosol chemistry above the surface.
Table 1 lists the species, measured from the instruments
described above, that were used in the analyses presented
here. References to other VOC measurements and complete
data sets are given at the bottom of the table.
www.atmos-chem-phys.net/10/2353/2010/ Atmos. Chem. Phys., 10, 2353–2376, 2010
2358 E. C. Apel et al.: Chemical evolution of volatile organic compounds
Table 1. Measurements from different platforms during MIRAGE-
MEX
1
.
Compound C-130 T0 T1 G1
Ethane UCI UCI UCI York
Propane UCI UCI UCI York
i-Butane TOGA/UCI UCI UCI York
n-Butane TOGA/UCI UCI UCI York
i-Pentane TOGA/UCI UCI UCI York
n-Pentane TOGA/UCI UCI UCI York
n-Hexane UCI UCI UCI York
n-Heptane UCI UCI UCI York
n-Octane UCI UCI UCI York
Ethene UCI UCI UCI York
Propene UCI UCI UCI York
1-Butene UCI UCI UCI York
i-Butene UCI UCI UCI York
trans-2-Butene UCI UCI UCI York
cis-2-Butene UCI UCI UCI York
1,3-Butadiene UCI UCI UCI York
1-Pentene UCI UCI UCI York
trans-2-Pentene UCI UCI UCI York
2-Methyl-2-Butene UCI UCI UCI York
2-Methyl 1-Propene UCI UCI UCI York
Ethyne UCI UCI UCI York
Benzene TOGA UCI UCI PNNL
Toluene TOGA/PTR-MS UCI UCI PNNL
Ethyl-benzene TOGA UCI UCI York
m-Xylene TOGA UCI UCI York
p-Xylene TOGA UCI UCI York
o-Xylene TOGA UCI UCI York
Xylenes PNNL
Formaldehyde DFGAS IMK-IFU IMK-IFU
Acetaldehyde TOGA Texas A&M NOAA PNNL
Propanal TOGA
Butanal TOGA
Methanol TOGA Texas A&M NOAA PNNL
Ethanol TOGA
Acetone TOGA Texas A&M NOAA PNNL
MEK TOGA Texas A&M NOAA PNNL
MTBE TOGA
CO NCAR UCI UCI BNL
Methane UCI UCI UCI
1
Additional measurements were made of VOCs. For UCI, more complete NMHC
measurements are shown in Table 2. For all measurements made at T0 and or T1,
please see the archive cdp.ucar.edu. For the G1 VOC measurements please see the
archive />2.3 Models
An important objective of this study was the intensive use
of models of different scales to help interpret the measure-
ments and to study the chemical evolution of the Mexico
City plume. Models employed included a regional cou-
pled chemistry-meteorology model (WRF-Chem), a chem-
ical transport model (MOZART-4), and a 0-D chemical box
model (NCAR Master Mechanism – MM).
WRF-Chem is a next-generation mesoscale numerical
weather prediction system designed to serve both operational
forecasting and atmospheric research needs. Modifications
to the WRF-Chem chemical scheme specific for this study
are described by Tie et al. (2007, 2009). The WRF-Chem
version of the model, as used in the present study, includes
an on-line calculation of dynamical inputs (winds, tempera-
ture, boundary layer, clouds), transport (advective, convec-
tive, and diffusive), dry deposition (Wesely et al., 1989), gas
phase chemistry, radiation and photolysis rates (Madronich
and Flocke, 1999; Tie et al., 2003), and surface emissions
including an on-line calculation of biogenic emissions (US
EPA Biogenic Emissions Inventory System (BEIS2) inven-
tory). The ozone formation chemistry is represented in the
model by the RADM2 (Regional Acid Deposition Model,
version 2) gas phase chemical mechanism (Chang et al.,
1989) which includes 158 reactions among 36 species. In
this study, the model resolution was 6× 6km in the horizon-
tal direction, in a 900 × 900 km domain centered on Mexico
City. The model simulation covers 1–30 March 2006.
The chemical scheme of WRF-Chem, RADM2, simplifies
the numerous and complex VOC reactions into a relatively
smaller set. For example, all potential alkane species (each
with different reaction rates) are simplified by usingjust three
alkanes with reaction rate coefficients separated by defined
ranges. A single surrogate alkane is used to represent all
alkane species that have rate constants with the hydroxyl rad-
ical of less than 6.8 × 10
−12
cm
3
molec
−1
s
−1
, while alkane
species with reaction rate constants greater than this are rep-
resented by other surrogate species. The same simplification
is done for alkenes, aromatics and OVOCs. For more de-
tail on the emissions and chemical scheme used, see Tie et
al. (2009) and references therein.
MOZART-4 (Model for Ozone and Related chemical
Tracers, version 4) is a global chemical transport model for
the troposphere, driven by meteorological analyses (Emmons
et al., 2010a). The results shown here are from a simulation
driven by the National Centers for Environmental Prediction
(NCEP) Global Forecast System (GFS) meteorological fields
(i.e., wind, temperature, surface heat and water fluxes), and
have a horizontal resolution of 0.7
◦
×0.7
◦
, with 42 vertical
levels between the surface and 3hPa. Model simulations at
2.8
◦
×2.8
◦
starting July 2005 were used to initialize the 0.7
◦
simulation on 1 March 2006.
The MOZART-4 standard chemical mechanism includes
85 gas-phase species, 12 bulk aerosol compounds that are
solved with 39 photolysis and 157 gas-phase kinetic reac-
tions. Lower hydrocarbons and OVOCs are included ex-
plicitly (e.g., ethane, ethene, propane, propane, methanol,
ethanol, formaldehyde, acetaldehyde), while higher VOCs
are represented as a lumped alkane (BIGANE), lumped
alkene (BIGENE) and lumped aromatic (TOLUENE). Prod-
ucts of these species (e.g., MEK, higher aldehydes), there-
fore, are represented as lumped species; modeled acetalde-
hyde also is a lumped species which includes some contribu-
tion from other compounds.
The global emission inventories used in this simulation in-
clude the POET (Precursors of Ozone and their Effects in
the Troposphere) database for 2000 (Granier et al., 2004)
(anthropogenic emissions from fossil fuel and biofuel com-
bustion), and the Global Fire Emissions Database, version 2
(GFED-v2) (van der Werf et al., 2006). The global invento-
ries have been replaced with updated regional estimates for
Atmos. Chem. Phys., 10, 2353–2376, 2010 www.atmos-chem-phys.net/10/2353/2010/
E. C. Apel et al.: Chemical evolution of volatile organic compounds 2359
Table 2. Mean methane, carbon monoxide and nonmethane hydrocarbon mixing ratios obtained during sampling the month of March 2006.
Standard deviations are given in parentheses. T0 and T1 daytime samples were collected between 09:00 and 18:00 local time. The latter two
columns show mixing ratios averaged over 24h for T0 and T1, respectively. Units are pptv except where noted.
Compound T0 Day T1 Day T0 24-h T1 24-h
Methane (ppmv) 2.52 (0.97) 1.95 (0.17) 2.88 (1.14) 2.05 (0.26)
CO (ppbv) 1197 (908.0) 364 (199.2) 1862 (1351.9) 500 (337.0)
Ethane 6447 (5728) 2436 (1737) 13916 (11726) 3001 (2637)
Ethene 7808 (7458) 1894 (1681) 13876 (11415) 3206 (2895)
Ethyne 10 158 (8682) 2597 (2163) 16278 (13117) 3688 (2956)
Propane 37 536 (34211) 7993 (7222) 78 341 (64263) 16 536 (19693)
Propene 1765 (1961) 484 (511) 4005 (3580) 1092 (1152)
i-Butane 8266 (10 547) 1091 (954) 11692 (9759) 2105 (2099)
n-Butane 20 332 (19516) 3142 (2818) 33 114 (24619) 6093 (6084)
1-Butene + i-Butene 1022 (1016) 288 (154) 1913 (1552) 534 (456)
trans-2-Butene 311 (412) 29 (30) 497 (432) 84 (98)
cis-2-Butene 330 (456) 23 (28) 440 (407) 57 (68)
i-Pentane 8380 (9089) 910 (718) 9244 (7468) 1407 (1150)
n-Pentane 5016 (4546) 644 (502) 6138 (4243) 946 (758)
1,3-Butadiene 122 (140) 46 (31) 327 (311) 113 (108)
1-Pentene 264 (355) 43 (27) 291 (275) 75 (61)
Isoprene 134 (58) 16 (19) 213 (134) 49 (54)
trans-2-Pentene 440 (645) 23 (16) 540 (529) 65 (65)
cis-2-Pentene 235 (353) 21 (12) 274 (279) 46 (39)
3-Methyl-1-butene 126 (165) 21 (14) 144 (131) 35 (28)
2-Methyl-2-butene 606 (864) 56 (43) 748 (701) 114 (114)
n-Hexane 4493 (6004) 330 (277) 4453 (4599) 521 (472)
n-Heptane 679 (707) 109 (109) 909 (708) 153 (137)
n-Octane 245 (197) 61 (59) 302 (192) 81 (70)
n-Nonane 123 (93) 35 (29) 223 (170) 46 (39)
Decane 224 (114) 36 (26) 445 (328) 43 (29)
2,2-Dimethylbutane 656 (539) 145 (88) 907 (621) 195 (134)
2,3-Dimethylbutane 2959 (2267) 496 (388) 4506 (3098) 697 (584)
2-Methylpentane 2894 (2852) 430 (304) 3699 (2680) 624 (458)
3-Methylpentane 2057 (2057) 277 (209) 2644 (1945) 413 (318)
2,4-Dimethyllpentane 301 (272) 37 (33) 440 (318) 54 (46)
2,2,4-Trimethylpentane 1045 (1018) 155 (125) 1380 (1008) 205 (160)
2,3,4-Trimethylpentane 335 (324) 57 (48) 503 (379) 79 (68)
Cyclopentane 365 (320) 54 (37) 464 (324) 75 (57)
Methylcyclopentane 960 (924) 126 (103) 1193 (836) 198 (165)
Cyclohexane 301 (217) 68 (47) 417 (261) 89 (64)
Benzene 1703 (1903) 410 (277) 2040 (1599) 577 (477)
Toluene 10649 (7888) 1257 (1138) 20 846 (16241) 1875 (1565)
Ethylbenzene 938 (877) 97 (98) 1581 (1312) 174 (182)
m-Xylene 845 (849) 68 (80) 1362 (1198) 151 (164)
p-Xylene 373 (402) 29 (36) 545 (478) 58 (65)
o-Xylene 404 (392) 38 (46) 641 (529) 77 (86)
iso-Propylbenzene 40 (35) 6 (5) 74 (57) 10 (9)
n-Propylbenzene 116 (103) 16 (18) 236 (201) 37 (49)
3-Ethyltoluene 244 (258) 24 (24) 511 (445) 52 (60)
4-Ethyltoluene 138 (142) 14 (14) 268 (217) 32 (35)
2-Ethyltoluene 108 (107) 11 (11) 187 (155) 24 (28)
1,3,5-Trimethylbenzene 115 (118) 11 (11) 295 (273) 31 (39)
1,2,4-Trimethylbenzene 834 (869) 85 (77) 1945 (1707) 194 (236)
www.atmos-chem-phys.net/10/2353/2010/ Atmos. Chem. Phys., 10, 2353–2376, 2010
2360 E. C. Apel et al.: Chemical evolution of volatile organic compounds
Asia and Mexico. For anthropogenic Asian emissions, the
2006 inventory of Zhang et al. (2009) has been used. The an-
thropogenic emissions from the Mexico National Emissions
Inventory (NEI) for 1999 ( />mexico.html) were used, with gridding to 0.025
◦
based on
population and road locations. Updated inventories exist for
MCMA, as summarized by Fast et al. (2009), but were not
used in this MOZART simulation. The fire emissions for
North America have been replaced by an inventory based
on MODIS fire counts with daily time resolution, following
Wiedinmyer et al. (2006). See Emmons et al. (2010b) for
further details.
The NCAR Master Mechanism is a 0-D model with de-
tailed gas phase chemistry consisting of ∼5000 reactions
among ∼2000 chemical species combined with a box model
solver. User inputs include but are not limited to species of
interest, emissions, temperature, and boundary layer height.
This model computes the time-dependent chemical evolution
of an air parcel initialized with known composition, assum-
ing no additional emissions, no dilution, and no heteroge-
neous processes (Madronich, 2006). Any input parameter
may be constrained with respect to time. Photolysis rates are
calculated using the Tropospheric Ultaviolet-Visible (TUV)
model (Madronich and Flocke, 1999), included in the code
package.
3 Discussion and results
3.1 MCMA measurements
3.1.1 Characterization of VOCs at T1 and T0
Table 2 shows the mean methane, carbon monoxide, and
NMHC mixing ratios obtained during March 2006, at T0
and T1 using the UCI canister measurements. The first two
columns represent the samples collected between 9:00 and
18:00 local time for T0 and T1, respectively. The second two
columns show averaged mixing ratios for T0 and T1, respec-
tively, over the full 24 h period. The median [CO] at T1 is
about a third of the T0 (CO) with corresponding lower val-
ues for the NMHCs at T1 as well. These data along with a
more complete data set supplied by UCI were used to derive
NMHC abundance and OH reactivity for the T0 and T1 sites.
Data from the Texas A&M PTR-MS (T0) and the NOAA
PIT-MS (T1) were used for the OVOC abundance and reac-
tivity (see Table 1).
The daytime data were used to determine ratios of the
various NMHCs to CO ([NMHC]
pptv
/[CO]
ppbv
). Compar-
ing these ratios to other data sets can yield insight into the
city emissions. If the correlation between species is high,
then an emission ratio can be determined, which can yield
further insight into the fuel type used and combustion effi-
ciency, and serve as useful input for developing emission in-
ventories. The first and third columns of Table 3 show the
Table 3. Ratios of NMHCs to CO (ppbv ppmv
−1
). The T0 and T1
ratios are from daytime samples between 09:00 and 18:00. The r
2
value is shown for each ratio obtained at T0 and T1. Emission ratios
for US cities are shown for comparison
1
.
T0 T1 US Cities
Compound ratio r
2
ratio r
2
emission ratio
Ethane 7.40 0.73 3.00 0.14 2.40
Ethene 8.40 0.99 7.90 0.85 4.10
Ethyne 9.60 0.99 8.20 0.87 3.40
Propane 41.50 0.76 49.30 0.71 3.80
Propene 2.60 0.93 2.90 0.70 1.00
i-Butane 4.80 0.44 5.30 0.71 0.90
n-Butane 15.10 0.69 15.30 0.71 1.40
1-Butene + i-Butene 1.10 0.88 1.20 0.72 0.38
trans-2-Butene 0.22 0.47 0.24 0.71
cis-2-Butene 0.17 0.31 0.16 0.61
i-Pentane 2.70 0.24 3.20 0.89 2.90
n-Pentane 2.10 0.46 2.10 0.84 1.20
1,3-Butadiene 0.22 0.88 0.30 0.83
1-Pentene 0.08 0.16 0.12 0.57
Isoprene 0.08 0.71 0.11 0.50
trans-2-Pentene 0.17 0.18 0.16 0.77
cis-2-Pentene 0.08 0.14 0.09 0.74
3-Methyl-1-butene 0.04 0.20 0.05 0.37
2-Methyl-2-butene 0.23 0.19 0.23 0.59
n-Hexane 1.50 0.19 1.30 0.80 0.60
n-Heptane 0.38 0.53 0.33 0.67 0.20
n-Octane 0.11 0.59 0.12 0.36 0.10
n-Nonane 0.09 0.57 0.07 0.37
Decane 0.15 0.40 0.06 0.30
2,2-Dimethylbutane 0.41 0.79 0.36 0.88
2,3-Dimethylbutane 2.20 0.92 1.40 0.70
2-Methylpentane 1.40 0.51 1.20 0.87
3-Methylpentane 1.00 0.51 0.86 0.88
2,4-Dimethyllpentane 0.21 0.77 0.12 0.86
2,2,4-Trimethylpentane 0.59 0.63 0.41 0.81
2,3,4-Trimethylpentane 0.25 0.78 0.18 0.84
Cyclopentane 0.18 0.59 0.15 0.86
Methylcyclopentane 0.44 0.51 0.45 0.86
Cyclohexane 0.18 0.84 0.16 0.77
Benzene 0.93 0.93 1.20 0.89 0.70
Toluene 7.50 0.63 5.20 0.88 2.70
Ethylbenzene 0.88 0.68 0.42 0.83 0.40
m-Xylene 0.76 0.58 0.33 0.74 0.60
p-Xylene 0.37 0.61 0.14 0.70 0.30
o-Xylene 0.36 0.60 0.19 0.73 0.50
iso-Propylbenzene 0.04 0.79 0.02 0.58
n-Propylbenzene 0.11 0.77 0.08 0.70
1,2,4-Trimethylbenzene 0.84 0.68 0.28 0.53
1
Baker et al. (2008)
([NMHC]
pptv
/[CO]
ppbv
) data obtained from the canisters at
T0 and T1, respectively. The second and fourth columns
show the r
2
values for the T0 and T1 data, respectively. The
fifth column shows ratios obtained by averaging values from
28 US cities (Baker et al., 2008). Large differences are evi-
dent for some species between the MCMA data and the aver-
aged US city data. It should be noted that ratios of NMHCs
to CO can vary substantially from city to city (Warneke et
al., 2007; Baker et al., 2008), particularly for light alka-
nes. However, in no US city do ratios approach the MCMA
Atmos. Chem. Phys., 10, 2353–2376, 2010 www.atmos-chem-phys.net/10/2353/2010/
E. C. Apel et al.: Chemical evolution of volatile organic compounds 2361
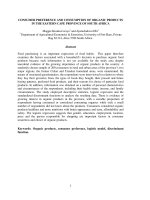
Fig. 2. The top 20 compounds measured at T0 (top panel) and T1
(lower panel) in terms of mixing ratios between 09:00 and 18:00
local time averaged over the month of March 2006. Shown to the
right of each bar graph is a breakdown, for T0 and T1, respectively,
of all of the species measured in terms of the sums of the mixing
ratios for each compound class.
ratios for propane, i-butane, and n-butane. This is most
likely attributable to the widespread use of liquid petroleum
gas (LPG) in cooking fuel in Mexico City (Blake and Row-
land, 1995, Velasco, 2006). Note that the NMHC/CO ra-
tios at the T0 and T1 sites are very similar for most com-
pounds. Notable exceptions are ethane, toluene, ethyl ben-
zene, and the xylenes with the emission ratios markedly
higher at the T0 site, likely due to strong local emissions.
The NMHC/CO ratios at both sites for the BTEX (benzene,
toluene, ethyl benzene, xylenes) compounds are enhanced
relative to vehicle exhaust (Zavela et al., 2006) and indicate
significant industrial emissions. Karl et al. (2009) and Fort-
ner et al. (2009) noted that toluene appears to have significant
industrial sources within the city that would increase its ratio
to CO. There are also significant differences versus US cities
(not shown in table), in the ratios of ethene and propene, two
highly reactive species, to CO. The most important source of
alkenes is believed to be vehicle emissions and differences in
combustion efficiencies can contribute to the differences in
the ratio (Doskey et al., 1992; Altuzar et al., 2004; Velasco
et al., 2005) but LPG and industrial emissions (Fried et al.,
2009) can also be important.
For most measured species, a strong diurnal variation was
observed with high mixing ratios at night when VOC emis-
sions accumulated in a shallow boundary layer, and lower
mixing ratios during the day when VOCs were mixed in a
deeper boundary layer and were removed by photochemistry.
However, diurnal patterns in VOC measurements were sub-
stantially different for oxygenated VOCs, indicative of sec-
ondary production occurring from the processing of NMHCs
(de Gouw et al., 2009).
Figure 2 graphically shows the 20 most abundant VOCs
(NMHCs and OVOCs) as measured at the T0 and T1 sites,
top panel and bottom panel, respectively. The measurements
for T0 and T1 are daytime averaged values obtained between
09:00 and 18:00 local time. For a detailed discussion of the
T1 analysis, including diurnal profiles of select VOC species,
please see de Gouw et al. (2009). The bar graphs show the
species from left to right in descending order of abundance
with the mixing ratios given in pptv on the y-axis. To the
right of each bar graph is a pie chart showing the breakdown
of the most abundant species summed by compound class.
Both the T0 and T1 ground sites show high mixing ratios for
a number of NMHC and OVOC species. Propane is the most
abundant species with an average value over 30 ppbv at T0
and approximately 8ppbv at T1. Aromatics result from ve-
hicle emissions but are also widely used in paints, and indus-
trial cleaners and solvents. Aldehydes result from fossil fuel
combustion and are formed in the atmosphere from the oxi-
dation of primary NMHCs (Atkinson, 1990). The two most
prevalent ketones, acetone and methyl ethyl ketone, are be-
lieved to have primary sources similar to the aromatic com-
pounds but with a higher fraction of emissions from paints
and solvents compared to mobile sources. Secondary sources
of these species were found to be large at T1 (de Gouw et
al., 2009). Less is known about the emissions of the al-
cohols. But methanol is one of the most prevalent VOCs
with average mixing ratios of approximately 20ppbv at T0
and 4ppbv at T1, during a season when biogenic emissions
are believed to be low. Methanol concentrations averaged ∼
50 ppbv during the morning rush hour (Fortner et al., 2009).
Strong correlations of methanol with CO were observed. The
aldehydes are present in relatively higher amounts at T1 ver-
sus the T0 site. Biomass burning is also a source for all of
the aforementioned VOC species at T0 or T1 but is minor
relative to mobile and industrial emissions (de Gouw et al.,
2009; Karl et al., 2009). There are other OVOC species that
were not measured at either one or both the T0 and T1 sites
in this study and these include but are not limited to methyl
tertiary butyl ether (MTBE), a gasoline additive, multifunc-
tional group species such as glyoxal, (Volkamer et al., 2007),
methyl glyoxal, ethyl acetate (Fortner et al., 2006) and two
of the primary oxidation products of isoprene, methyl vinyl
ketone and methacrolein.
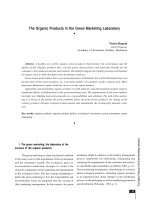
Figure 3 displays data in a similar fashion to Fig. 2, but
shows the VOC OH reactivity results in bar graphs and pie
charts. The bar graphs show the top 20 measured VOC
species in terms of their daytime averaged contribution to
the OH reactivity in s
−1
(primary y-axis) and percent OH
reactivity (secondary y-axis). The total averaged over-the-
day reactivity for the measured VOC compounds is 19.7 s
−1
www.atmos-chem-phys.net/10/2353/2010/ Atmos. Chem. Phys., 10, 2353–2376, 2010
2362 E. C. Apel et al.: Chemical evolution of volatile organic compounds
Fig. 3. The top 20 compounds measured at T0 (top panel) and T1 (bottom panel) in terms of OH reactivity between 09:00 and 18:00 local
time averaged over the month of March 2006. Shown in the first pie chart to the right of each bar graph is the breakdown for the relative
contributions from NMHCs and OVOCs for T0 and T1, respectively. Shown in the second pie chart is the breakdown in terms of each
compound class.
for T0 and 4.4s
−1
for T1. The pie charts break the reactiv-
ity down further, the left pie chart showing the breakdown
in terms of NMHC reactivity and OVOC reactivity and the
right pie chart in terms of compound class. It is clear that,
averaged over the daytime period, NMHCs provide the ma-
jority of the measured VOC reactivity for T0 and T1 (78%
and 57%, respectively), and OVOCs provide the remaining
measured VOC reactivity with 22% and 43%, respectively.
The two most important factors in the difference between the
VOC distributions shown for T0 and T1 are that there are
more industrial emissions at T0 and the air is more processed
(aged) at T1.
Despite the fact that the NMHCs provide the majority of
the overall VOC reactivity at these sites, the two individ-
ual VOCs with the highest OH reactivity are formaldehyde
and acetaldehyde. A number of previous studies have found
high ambient levels of formaldehyde in the MCMA (Baez, et
al., 1995, 1999; Grutter et al., 2005; Volkamer et al., 2005).
Zavala et al. (2006), Garcia et al. (2006) and Lei et al. (2009)
concluded that a significant amount of formaldehyde is asso-
ciated with primary emissions, particularly from mobile ex-
haust and this has a large impact on the local radical budget.
Interestingly, the third most important VOC is ethene which
reacts relatively quickly to form formaldehyde (e.g., Wert et
al., 2003) and is therefore an important contributor to sec-
ondary formaldehyde formation. Indeed, fast 1-s HCHO ob-
servations by Fried et al. (2010) over Mexico City also show
the importance of secondary sources. On-road vehicle emis-
sions of acetaldehyde were measured by Zavala et al. (2006)
who found significant levels of this species in vehicle exhaust
although the levels were found to be lower than formalde-
hyde emissions by a factor of 5–8. Baez et al. (1995, 2000)
measured carbonyls in the 1990s in Mexico City and found
high values of acetaldehyde, of the same order of magnitude
reported here. Propene exceeds propane for reactivity despite
its much lower abundance (Fig. 2) due to its high reactivity.
Nevertheless, propane, although slow reacting, still plays an
important role in the OH reactivity throughout the MCMA
Atmos. Chem. Phys., 10, 2353–2376, 2010 www.atmos-chem-phys.net/10/2353/2010/
E. C. Apel et al.: Chemical evolution of volatile organic compounds 2363
(Velasco, 2007) because of its high mixing ratio. Propene
oxidation readily yields acetaldehyde formation. For the T0
and T1 analyses, 4 of the top 20 species contributing most
to the OH reactivity are OVOCs. The present study presents
the most complete coincident VOC coverage to date in the
MCMA and as a result there are differences in the attribution
of VOC OH reactivity when compared to previous studies
(Velasco et al., 2007), however, most of these differences are
due to the more complete measurements of OVOCs in this
study, which highlights their importance in the overall pic-
ture of VOC OH reactivity.
It is instructive to examine the OH (VOC) reactivity di-
urnal profiles at the ground sites, T0 and T1. As indicated
earlier, the T0 canister NMHC measurements were not ob-
tained at regular time intervals whereas the T1 canister data
were, with collections taking place every three hours (mid-
night, 3:00a.m., 6a.m., etc.). For T0, there are relatively few
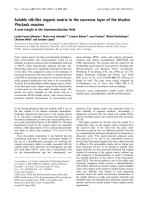
measurements from 21:00 to 04:00. Figure 4 shows the di-
urnal OH reactivity profiles for T0 and T1 averaged over the
month of March 2006. The total reactivity shown here only
includes the NMHC and OVOC contributions. A clear peak
in the total reactivity profile is observed in the morning hours
with the maxima reached at both sites during the morning
rush hour: ∼50 s
−1
at T0 and ∼14s
−1
at T1. For both sites,
the OVOCs contribute a relatively larger portion in the after-
noon to the total reactivity with the OVOCs surpassing the
NMHCs in their contribution to the OH reactivity in the af-
ternoon hours at T1. These observations may be attributed to
high mixing ratios at night when VOC emissions accumulate
in a shallow boundary layer followed by further reduction of
the boundary layer height in the morning together with some
contribution from traffic and industry during the early morn-
ing before the boundary layer has expanded. During the day,
VOCs are mixed in a deeper boundary layer, processed by
photochemistry and the emissions decrease after the morn-
ing rush hour (Velasco et al., 2007), all causing a decrease in
mixing ratios.
To test the ability of models to capture the VOC OH
reactivity, WRF-Chem and MOZART simulated the diur-
nal profile for the VOC OH reactivity for the MCMA. Fig-
ure 5 shows the results of these simulations (WRF-Chem,
top panel, MOZART, middle panel) along with the diurnal
OVOC reactivity fraction from each model and the experi-
mental data (lower panel). The WRF-Chem results are cen-
tered at T1 and have a horizontal resolution of 6×6 km. The
MOZART grid box size is 0.7
◦
×0.7
◦
(∼75×75 km
2
region)
covering the greater MCMA, including T0 and T1. The
time steps were slightly different for the model output and
the experimental data. Both models reproduce some of the
features shown in the experimental data. The daytime pat-
terns and absolute values from both models approximate the
experimental data although there are some key differences.
The WRF-Chem model captures moderately well the total
VOC reactivity during the daytime beginning with the hours
between 6a.m. and 9p.m. However, the model does not
Fig. 4. Diurnal OH reactivity data for T0 (upper panel) and T1
(lower panel) averaged over the month of March 2006. The reactiv-
ity data is broken down into NMHCs and OVOCs. The T0 diurnal
data is incomplete because of a lack of measurements at the time
periods shown.
capture well the relative contribution of OVOCs to the to-
tal VOC reactivity (panel c), underestimating their contri-
bution. It is assumed that the large MOZART grid box for
Mexico City can be appropriately compared to the T1 data,
as T1 is more indicative of the urban/suburban character of
the MCMA basin as opposed to strictly the urban city center.
The MOZART simulation looks quite similar to the obser-
vations for the reactivity during the morning rush hour; how-
ever, the model underestimates the VOC reactivity during the
remaining daytime hours. In spite of these differences, the
relative contributions to the reactivity from OVOCs are bet-
ter represented in MOZART than in the WRF-Chem model
www.atmos-chem-phys.net/10/2353/2010/ Atmos. Chem. Phys., 10, 2353–2376, 2010
2364 E. C. Apel et al.: Chemical evolution of volatile organic compounds
Fig. 5. Diurnal OH reactivity data for T1 averaged over the
month of March 2006 from the WRF-Chem model (top panel) and
MOZART (middle panel). The reactivity data is broken down into
NMHCs and OVOCs. The bottom panel shows the relative contri-
bution of OVOCs to the total VOC reactivity for both models and
the experimental data.
Fig. 6. The top 20 compounds measured from T0 (top panel), T1
(middle panel), and theC130 platform(lower panel), and interms of
mixing ratios averaged over the month of March 2006, at 3:00 PM,
local time. Shown to the right of each bar graph is a breakdown, for
T0, T1 and the C130, respectively, for all of the species measured
in terms of the sums of the mixing ratios for each compound class.
(lower panel). Large differences between measurements and
models occur at night. For the WRF-Chem simulations, there
is a problem with either the nighttime emissions or the PBL
height; a simulated shallow PBL height would lead to higher
surface concentrations during the night which could poten-
tially explain the results. For MOZART, there are clear indi-
cations from a number of tracers (e.g., CO, not shown) that
the boundary layer height drops too quickly at night.
3.1.2 C130 over-flight results
The over-flight data is defined to be the data collected aloft
within the grid box shown in the lower panel of Fig. 1.
Approximately 75% of the C130 MCMA over-flight data
were collected between 13:00 and 17:00 local time. Figure 6
Atmos. Chem. Phys., 10, 2353–2376, 2010 www.atmos-chem-phys.net/10/2353/2010/
E. C. Apel et al.: Chemical evolution of volatile organic compounds 2365
(lower panel) shows the averaged mixing ratios for the top
20 VOCs obtained on the C130 during the over-flights and
the pie chart to the right of the bar chart gives the break-
down in terms of compound classes. For comparison, the top
and middle panels show data obtained from the T0 and T1
sites, respectively, for a similar sample analysis time period
(15:00, local time) with compound class breakdowns shown
at the right of each bar graph. There are some interesting
similarities and contrasts between the aircraft data aloft and
the ground-based measurements.
For the C130 over-flights, the most abundant species mea-
sured was methanol, followed by propane and then other
NMHC and OVOC species. Four of the top 5 and 8 of the
top 20 measured VOCs were OVOCs. It is interesting to note
that methanol was the most prevalent VOC measured aloft
(C130) and at the T0 ground site at 15:00, whereas at the
T1 site the most prevalent VOC was formaldehyde. Figure 7
shows the OH reactivity data presented in a similar fashion
to Fig. 3. In all three locations, the two VOCs that have
the greatest influence on OH reactivity are formaldehyde and
acetaldehyde. The top four species in the C130 over-flight
analyses are OVOCs. Dilution results in the diminution of
the total measured OH reactivity to 1.9 s
−1
, but it is clear
from the pie chart distributions that the data aloft represent
more photochemically processed air than T0 and T1. Fig-
ure 8 gives insight into differences between the surface and
aloft in terms of atmospheric processing. It presents results
from a MOZART model simulation over the entire month of
March 2006 showing the time series for acetaldehyde and its
source contributions at the surface (764hPa) and at 692hPa
(∼800 m above surface). Primary emissions are shown to-
gether with secondary production from a number of precur-
sor species. Primary emissions clearly dominate at the sur-
face whereas secondary production dominates aloft demon-
strating the much larger degree of photochemical aging aloft
compared to the surface in the model.
3.2 VOC Evolution in MCMA plumes
On 19 March the C-130 intercepted three times an MCMA
outflow plume that had been sampled a day earlier by the G1
over the source region. This was a typical NE transport event
at altitudes ranging from 3–5.2km. Air with a one to two day
transport time from the source was sampled. Figure 9 shows
the results of a MOZART simulation of the CO outflow from
the city. Superimposed on the plume are flight tracks from
the G1 on 18th March and from the C130 on 19th March.
The points of interception of the plume are marked for the G1
which intercepted the plume as it was emerging from the city
during a transect that occurred between the times of 14:20
and 15:20 local time on the 18th and the C130 which inter-
cepted the plume on the 19th. Also shown in the figure are
the OH reactivity distributions in terms of NMHCs, OVOCs,
and CO for the T0 and T1 sites at 9:00a.m., the G1 during the
transect, and the C130 during the plume interception that oc-
curred at the furthest point from the city. Each day in Mexico
City, there is a near complete turnover of air in the MCMA
basin (de Foy et al., 2006). Thus, it serves the purposes of
this discussion to consider the morning hours as the start-
ing point of the plume evolution. Following morning emis-
sions from traffic, industry and cooking, etc., into a shallow
boundary layer, the boundary layer rises and the fresh emis-
sions are mixed upwards and eventually transported out of
the city. The total VOC reactivity is dominated by NMHCs
in the morning with CO playing a relatively minor role com-
pared to the VOCs. The total measured OH (VOC) reactivity
at 9:00 a.m. at T0 is 50 s
−1
and 14 s
−1
at T1. A large part of
the OH reactivity is provided by alkenes and aromatics (50%
of total VOC OH reactivity, with 30% from alkenes and 20%
from aromatics at T0, not shown in the figure), species that
have relatively short lifetimes under the conditions present in
the basin. It is apparent from the data that rapid photochem-
istry occurs that quickly transforms the OH (VOC) reactivity
from being dominated by NMHCs to being dominated by
OVOCs aloft (G1), as noted earlier (see Fig. 8), and further
downwind (C130 plumes). At the C130 sampling point, a
large part of the VOC reactivity is provided by the OVOCs:
aldehydes (65%); alcohols (15%); ketones (3%). The pro-
portional contributions from NMHCs were alkanes (10%),
alkenes (5%), and aromatics (2%). As shown in the figure,
CO plays a relatively more important role in OH reactivity
compared to VOCs as the plume ages.
Along with other trace gas measurements aboard the
C130, MTBE was used to verify when the C130 intercepted
urban plumes. Figure 10 (top panel) shows a time series al-
titude trace and the lower panel a time series of the TOGA
MTBE data for 19 March. The TOGA has the capability
of detecting this species down to the 1 pptv level which was
very useful in this study. The trace shows the interception
points of the plume downwind. Points 1 and 2 (∼15:15 and
∼16:00, respectively) are clearly interceptions of the same
plume layer upon descent and ascent and these are identified
as a single point in Fig. 9. Point 3 (∼17:00) is an interception
of the plume at a lower altitude upon return into the MCMA.
The higher mixing ratios of MTBE at the beginning and the
end of the flights were obtained during transects over the city.
In addition to the identification with trace gas measurements,
balloon soundings verified that the C130 intercepted a plume
that originated in the MCMA one day earlier (Voss et al.,
2007).
Figure 11 shows plots from the 18 and 19 March data that
demonstrate some salient points with regard to photochem-
ical processes occurring during the outflow event. The fig-
ure shows plots of species versus CO mixing ratios measured
aboard the G1 and C130 during the 18 and 19 March flights,
respectively. The top panel shows plots of O
3
versus CO for
the C130 aircraft and the G1 aircraft. Note the difference
in slopes between the two measurement platforms. Tie et
al. (2009) recently examined the relationship between O
3
and
CO as measured by the C130 aircraft during MIRAGE-Mex
www.atmos-chem-phys.net/10/2353/2010/ Atmos. Chem. Phys., 10, 2353–2376, 2010
2366 E. C. Apel et al.: Chemical evolution of volatile organic compounds
Fig. 7. The top 20 compounds measured from T0 (top panel), T1 (middle panel) and the C130 platform (lower panel), in terms of OH
reactivity averaged over the month of March 2006, at 03:00 p.m. Shown in the first pie chart to the right of each bargraph is the breakdown
for the relative contributions from NMHCs and OVOCs for T0 and T1, respectively. Shown in the second pie chart is the breakdown in terms
of each compound class.
which covered a wide range of regimes from fresh emis-
sions to air that had aged more than two days. The Tie et
al. (2009) results from the entire study showed that the O
3
-
CO correlation is non-linear with a much greater slope ob-
served when CO concentrations are less than 400ppbv (aged
air) than in less aged air (>400 ppbv). Parrish et al. (1998)
studied O
3
-CO correlations at a number of surface sites
and found varying slopes of (O
3
)/(CO) under different
conditions (locations), with larger O
3
-CO slopes often occur-
ring during individual transport events, implying increased
Atmos. Chem. Phys., 10, 2353–2376, 2010 www.atmos-chem-phys.net/10/2353/2010/
E. C. Apel et al.: Chemical evolution of volatile organic compounds 2367
Fig. 8. A MOZART model run over the entire month of March
2006 showing acetaldehyde time series at two different altitudes, at
the surface (764 hPa) and at 692 hPa. Primary emissions are shown
in red whereas secondary production from a number of precursor
species are kept track of in the model run and their contributions to
the total acetaldehyde mixing ratios are shown in different colors.
Fig. 9. MOZART depiction of the of the CO outflow from the 19
March plume. Superimposed on the plume are flight tracks from
the G1 (white) on 18th March and from the C130 (black) on 19th
March. The G1 intercepted the plume as it was emerging from the
city during a transect that occurred between the times of 14:20 and
15:20 local time on the 18th and the C130 which intercepted the
plume on the afternoon of the 19th. The OH reactivity distributions
in terms of NMHCs, OVOCs, and CO at 09:00 a.m. are shown for
the T0 and T1 sites, the G1 during the transect, and the C130 during
the plume interception that occurred at the furthest point from the
city.
O
3
production efficiency during these events. These results
are consistent with the study by Wood et al. (2009) who
found that the ratio (O
3
)/(CO) increases with the age of
MCMA plumes. The lower panel shows plots of benzene
Fig. 10. Time series traces for the altitude (toppanel) and the TOGA
measurements of MTBE (bottom panel) during the 19 March flight
in which the outflow plume was followed. Red circles mark the re-
gions on the altitude profile where the plume was intercepted. These
interception regions are seen on the MTBE profile and are labeled
as 1, 2, and 3.
versus CO. Benzene is not expected to be produced photo-
chemically and has a long lifetime (>5 days) relative to the
age of air mass (<2 days) at the time of the measurement.
Thus, a good correlation is expected from either measure-
ment platform with a slope equal to the emission ratio. This
is indeed what is observed with the slopes from the G1 or
the C130 being similar, with differences within experimental
error.
Shorter – lived species do not generally correlate with CO
except for very short photochemical ages due to the fact
that the loss rate of these species is rapid compared to CO,
i.e., correlations can exist only for fresh emissions. Thus,
a different approach is necessary to examine the possible
photochemical production of species that react quickly. In
Fig. 12, we show plots of acetaldehyde, methyl tertiary butyl
ether (MTBE), and toluene from the entire MIRAGE-Mex
C130 experiment versus the calculated photochemical life-
time. Before discussing the details of Fig. 12, a brief discus-
sion is given below of the photochemical lifetime calculation.
Along with CO, toluene and benzene are emitted di-
rectly by vehicles. Both react with the hydroxyl radical
(OH), but at different rates; the OH-benzene rate constant
is 1.22×10
−12
cm
3
molecules
−1
s
−1
while the OH-toluene
rate constant is 5.63×10
−12
cm
3
molec
−1
s
−1
(Atkinson and
Arey, 2003). Thus, more photochemically aged plumes
should have smaller toluene/benzene ratios. Using an
www.atmos-chem-phys.net/10/2353/2010/ Atmos. Chem. Phys., 10, 2353–2376, 2010
2368 E. C. Apel et al.: Chemical evolution of volatile organic compounds
Fig. 11. Plots of CO mixing ratios versus ozone and benzene mea-
sured aboard the G1 and C130 during the 18 March (blue) and
19 March (red and green) flights, respectively. The C130 data
shown in the top panel is from the NASA one minute data merge
() and encompasses data collected dur-
ing the outlow event from UTC 2100 to UTC 2400. It excludes
data from the boundary layer run during this time period since
these data are not part of the outflow event. The C130 data shown
in the bottom panel is taken from the NASA TOGA data merge
(). The green data points encompass
the data for the entire flight and the red data points encompass data
from the outflow similar to the C130 data in the top panel. The
slopes and intercepts are shown for each respective set of G1 and
C130 data. The benzene/CO slope does not change whether ob-
served in or out of the outflow.
estimate of the emission ratio of toluene to benzene of 5
(Zavala, 2006; Karl et al., 2009, and this study) and an aver-
age measured OH concentration (3.5×10
6
molec cm
−3
), the
photochemical age of the air mass can be estimated (Roberts
et al., 1984; McKeen et al., 1996; Gelencs
´
er et al., 1997) by
Fig. 12. Plots of acetaldehyde, methyl tertiary butyl ether (MTBE),
and toluene all ratioed to CO versus the photochemical lifetime
for the entire MIRAGE-Mex C130 experiment. Regression lines
(dashed) are drawn through each compound data set. Solid lines
are drawn showing the calculated expected pseudo first order de-
cay with time for each respective compound using the highest mix-
ing ratios as the starting point for the decay curve. An average
experimentally-derived value of [OH] = 3.2×10
6
was used in the
calculations. The toluene/benzene emission ratio used in the calcu-
lations of photochemical lifetime is 5:1 (Karl et al., 2009; Zavala et
al., 2006).
t =
1
[
OH
][
k
toluene
− k
benzene
]
(R5)
·
ln
[toluene]
[benzene]
t=0
− ln
[toluene]
[benzene]
The emission ratio of toluene to benzene results from a
combination of sources including mobile, fire (Yokelson et
al., 2007; Crounse et al., 2009) and industrial (Karl et al.,
2009).
In Fig. 12, regression lines (dashed) are drawn through
each compound data set. In addition, lines (solid) are drawn
showing the calculated expected pseudo first order decay
with time using the highest mixing ratios as the starting point
for the decay curve. Note that for toluene, a species for which
there is no expected photochemical production, the calcu-
lated decay closely matches the observed decay. For MTBE,
also a species that is not expected to be produced photochem-
ically, the calculated decay is somewhat, although not dra-
matically, slower than the observed decay. Some differences
in the calculated versus observed decay are expected and may
be attributable to the mixing of air masses of different ages
since Reaction (R5) is valid only for an isolated air parcel.
However, for acetaldehyde, the expected decay is much faster
than the observed decay which is compelling evidence for
photochemical production with time for this species. Like
formaldehyde, numerous VOC precursors lead to its produc-
tion. These include ethane, C
4
, C
5
, C
6
alkanes and alkenes,
Atmos. Chem. Phys., 10, 2353–2376, 2010 www.atmos-chem-phys.net/10/2353/2010/
E. C. Apel et al.: Chemical evolution of volatile organic compounds 2369
Fig. 13. Results of a MM model run initialized with T0 data as a
function of the processing time as calculated by the Master Mecha-
nism. In order to eliminate the effects of dilution, the speciated data
are normalized to carbon monoxide concentrations.
methyl ethyl ketone, ethanol, etc., which can lead to a con-
tinuous production of acetaldehyde as the plume progresses
in space and time.
To take a closer look at processes leading to acetaldehyde
and other OVOC production, we utilized the NCAR Mas-
ter Mechanism. The box model offers an opportunity to ex-
amine chemical transformations of an isolated urban plume
at a level of detail that is impractical to implement in cur-
rent 3D models. More detail on the box model study will
be given in a future publication and we will restrict our dis-
cussion here to looking at trends and results for a subset of
VOC species that are discussed elsewhere in this paper. The
model starting point VOC mixing ratios are the T0 condi-
tions at 9:00 a.m., i.e., the same conditions that result in the
OH reactivity plot for T0 in Fig. 9. In addition to the VOC
input, ozone was set to 35ppbv, NO to 50ppbv, and methane
and CO were set to their averaged measured values of 2200
and 3600 ppbv, respectively. Figure 13 shows a plot of ratios
of species concentrations to [CO] as a function of the time
of day as calculated by the Master Mechanism. The species
concentrations are normalized to carbon monoxide concen-
trations to eliminate the effects of dilution. To test the model
we also included the ratio of peroxyacetyl nitrate (PAN) to
peroxypropionyl nitrate (PPN) in the model run. In this run
we started at zero for PAN and PPN and generated mixing
ratios with the photochemistry in the model. It takes time to
spin up to the correct values. In the model, the production of
acetone outpaces its decay (relative to CO) over the period of
the study and the results are consistent with the data shown in
Fig. 11. Because of their high reactivity, formaldehyde and
acetaldehyde decay more quickly than they are produced de-
spite significant production over the course of several days.
In the absence of production, the values for formaldehyde
and acetaldehyde would quickly fall to near zero during day-
time photochemical processing. The photochemical process-
ing results shown here are consistent with modeling results
obtained by Sommariva et al. (2008). Data taken from the
C130 as it intercepted the plume at t = 1.6 days, i.e., the af-
ternoon of the following day, are shown as colored dots on
the figure. The indicator of plumes 1 and 2 in this figure
refer to the plumes shown in Fig. 10 in the Mexico City out-
flow on 19 March. The processing time presented here is
consistent with results obtained from balloon profiling of the
outflow by Voss et al. (2010). In the real world the plume
is not an isolated air parcel and it may be perturbed by ad-
ditional sources such as biomass burning and mixing with
other urban sources (see Voss et al. (2010) for more discus-
sion). Biomass burning influences, for example, would tend
to increase the measured to modeled values of all parameters
shown in the plot. Despite these complications, the general
trends are reproduced for the VOC species and the model
closely predicts the PAN/PPN ratio. Measured formaldehyde
values are clearly higher than the modeled values. A possible
reason for this is that there are additional formaldehyde pre-
cursors that were not accounted for in the model. This is will
be the subject of a future publication by Fried et al. (2010).
As a test of the sensitivity of the model to specific com-
pounds, we ran the model, again initialized at T0 with
and without methanol and ethanol which are precursors to
formaldehyde and acetaldehyde, respectively, as shown by
the following reactions (e.g., Atkinson, 1989):
CH
3
OH+OH → CH
2
OH+H
2
O (R6)
CH
2
OH+O
2
→ HCHO+HO
2
(R7)
CH
3
CH
2
OH+OH → CH
2
CH
2
OH+H
2
O (R8)
CH
2
CH
2
OH+O
2
→ CH
3
CHO+HO
2
(R9)
Ethanol was estimated from the TOGA data by using
TOGA-derived emission ratios. The results, shown in
Fig. 14, indicate that methanol is an important contributor
to formaldehyde formation, e.g., two days downwind, the
sensitivity study predicts that methanol oxidation contributes
∼20% of the formaldehyde. The study also indicates that
ethanol is an important contributor to acetaldehyde formation
both near field and far field with contributions up to ∼30%
of the acetaldehyde mixing ratio. Methanol has been mea-
sured for a number of years (e.g., Singh et al., 1995) and its
distributions are beginning to be understood (e.g., Heikes et
al., 2002; Galbally et al., 2002; Millet et al., 2008), however,
the sources of methanol in the MCMA are uncertain, given
the magnitude of mixing ratios observed in this study (see
Figs. 2, 5), even though there is some indication that indus-
trial sources and solvent usage may be important (Velasco et
al., 2005). Because of its relatively low reactivity, methanol’s
influence on formaldehyde formation is less pronounced in
www.atmos-chem-phys.net/10/2353/2010/ Atmos. Chem. Phys., 10, 2353–2376, 2010
2370 E. C. Apel et al.: Chemical evolution of volatile organic compounds
Fig. 14. Results of a MM model run to test of the sensitivity of
the model to specific compounds. The model was initialized with
T0 data and results are shown with respect to time for formalde-
hyde and acetaldehyde concentrations with and without methanol
and ethanol in the starting data to test to the contribution from alco-
hols to the respective aldehyde concentrations.
the near field but still significant and because of its low reac-
tivity it can continue to produce formaldehyde far downwind
of the source given sufficient NO
x
and sunlight. Ethanol on
the other hand has been scarcely measured and is most often
not included in model simulations. This is of topical inter-
est as ethanol is being added to motor fuels throughout large
regions of the world.
To further examine the characteristics of the 19 March
plume, we utilized both MOZART and the WRF-Chem
model. Figure 15 shows the plume from a MOZART sim-
ulation for ozone produced from emissions in Mexico City
and its surrounding areas (top left panel) and VOC OH reac-
tivity (top right panel). It is interesting to note the extent of
the plume into the US at 620 hPa (∼4 km). Also shown in the
lower panels of the figure are curtain plots of the VOC OH
reactivity taken at points along latitude transects (red) that
coincide with latitudes for which sampling of the plume oc-
curred from the G1 and C130 platforms. The bottom red line
represents the approximate latitude for Mexico City and this
is also the approximate latitude where the G1 sampling took
place on 18 March. The top two red lines represent latitudes
where the C130 intercepted the plume during the 19 March
flight. At the various latitudes, the OH reactivity is broken
down into the reactivity originating from the NMHCs and
OVOC compound classes. The reactivity is captured quite
well in the model as the plume evolves, diffuses and is trans-
ported, including the essential feature of the increasing rel-
ative importance of OVOCs versus NMHCs as the plume
evolves (see Fig. 9 for a comparison with measurements).
The model shows a maximum in the distribution at a height
of 4km at 27.2 N. Recall from Fig. 10 that the measurements
on board the C130 showed an outflow maximum at approx-
imately 5km altitude, indicating a minor model error in the
transport height of the pollution.
Figure 16 shows a vertical cross-section from a WRF-
Chem regional model run extending from the MCMA to
1000 km downwind that included chemistry as discussed by
Tie et al., 2009. The species tracked in the figure are grouped
and include CO, relatively slow reacting VOCs (alkanes), re-
active to very reactive VOCs (alkenes and aromatics), and
OVOCs. The rate of the alkenes +aromatics reactions with
OH is high (about 20–100 times higher than the CO +OH
reaction rate). As discussed earlier, this fast reaction leads
to high OH reactivity in the city area, and this is normally
a major contributor to the high rate of ozone formation in
Mexico City (Madronich, 2006; Tie et al., 2007, 2009). As
a result, a large portion of the reactive alkenes+ aromatics
is chemically destroyed near the city, and a smaller amount
of alkenes+ aromatics is transported downwind of the city,
leading to a small contribution to the OH reactivity in the
aged plume, in accord with observations. OVOCs have pri-
mary and secondary sources but as we have seen, these
species are primarily secondary products downwind of the
city, produced by chemical reactions of numerous VOC pre-
cursors including the reactions of OH with alkanes, alkenes,
aromatics, and other OVOCs. Thus, consistent with exper-
imental results, the model results indicate that OVOCs are
continuously produced along the plume and this significantly
contributes to the OH reactivity near the city but, more im-
portantly in a relative sense, in the aged plume. The rate
of alkane reactions with OH is relatively low compared to
alkenes and aromatics. As a result, alkanes contribute to
the OH reactivity in both young and aged plumes, but are
usually not the dominant species in either. Note that the
values derived from the model (Fig. 16) versus the mea-
surements (Fig. 9) are in reasonable agreement. Similar
to the MOZART results, the WRF-Chem model predicts a
lower outflow altitude than the measurements would suggest
(Fig. 10).
Atmos. Chem. Phys., 10, 2353–2376, 2010 www.atmos-chem-phys.net/10/2353/2010/
E. C. Apel et al.: Chemical evolution of volatile organic compounds 2371
Fig. 15. MOZART simulation for ozone produced from emissions in Mexico City and its surrounding areas (top left panel) and VOC OH
reactivity (top right panel). Curtain plots of the VOC OH reactivity taken at points along latitude transects (red) that coincide with latitudes in
which sampling of the plume occurred from the G1 and C130 platforms. The bottom red line represents the approximate latitude for Mexico
City and this is also the approximate latitude where G1 sampling took place on 18 March. The top two red lines represent latitudes where
the C130 intercepted the plume during the 19 March flight. At the various latitudes, the OH reactivity is broken down into the reactivity
originating from the NMHCs and OVOC compound classes.
4 Summary and conclusions
The VOC distribution in the Mexico City Metropolitan Area
and its evolution as it is uplifted and transported out of
the MCMA basin was studied during the MIRAGE-Mex
field campaign. The ground-based and in-situ aircraft mea-
surements of VOCs were analyzed, and interpreted with
a global model, MOZART, a regional chemical/transport
model (WRF-Chem), and a box model (NCAR Master
Mechanism). The results show that in the morning hours
(6 a.m.–9 a.m.) near the city center, the VOC mixing ratio
distribution is dominated by NMHCs (vs. OVOCs). Even
though there is a substantial contribution from OVOCs, most
of these are likely primary emissions during this time pe-
riod. Alkanes account for a large part of the VOC burden.
NMHCs dominate the overall OH reactivity, especially in the
morning hours. However, in the afternoon, as the bound-
ary layer lifts and air is mixed and aged within the basin,
the distribution changes as secondary products are formed
from the primary emissions. The WRF-Chem model and
MOZART were able to approximate the observed MCMA
daytime patterns and absolute values of the VOC OH reac-
tivity. The MOZART model is also in agreement with ob-
servations showing that NMHCs dominate the reactivity dis-
tribution except in the afternoon hours. Discrepancies with
the models were observed during the evening hours, most
likely due to an under-prediction of the PBL height during
nighttime and early morning; in addition, WRF-Chem under-
predicts the contribution of OVOCs to the VOC reactivity
during the daytime.
Instruments on-board the G1 and C130 aircraft measured
the VOC distributions aloft over the MCMA, mostly dur-
ing the afternoon hours. The observations show that as air
is uplifted, rapid chemical processing occurs, leading to a
distribution that is dominated by OVOCs. The MOZART
model simulation for the month of March shows that pri-
mary emissions for one of the most important OVOCs, ac-
etaldehyde, dominate at the surface whereas secondary pro-
duction dominates aloft, in accord with experimental obser-
vations of the increasing importance of OVOCs aloft and the
www.atmos-chem-phys.net/10/2353/2010/ Atmos. Chem. Phys., 10, 2353–2376, 2010
2372 E. C. Apel et al.: Chemical evolution of volatile organic compounds
Fig. 16. WRF-Chem regional model run extending from the
MCMA to 1000 km downwind. The panels show the OH reactiv-
ity contributions from CO and various VOCs as calculated by the
model from 0-1000 km downwind.
decreasing importance of NMHCs as they are reacted away
to form products.
In addition, a northeast transport event was studied in
which air originating in the MCMA was intercepted aloft
with the DOE G1 on 18 March and downwind with the Na-
tional Center for Atmospheric Research NCAR C130 one
day later on 19 March. It was shown that ozone was pho-
tochemically produced in the plume. The NCAR Master
Mechanism was used to help interpret the results using the
VOC distributions from the city center for the model ini-
tialization. These results showed that the mixing ratios and
general trend of important species downwind could be repro-
duced using the detailed chemistry of the MM. A sensitivity
test was also performed by including the alcohols, methanol
and ethanol, in one of the simulations and excluding them
in another. These results showed that methanol and ethanol
are important precursors to formaldehyde and acetaldehyde
downwind and that it is clearly important to measure these
species in major field campaigns with their importance in-
creasing because of increased usage in fuel formulations.
The WRF-Chem model and MOZART were used to examine
the spatial and temporal extent of the 19 March plume and
also to interpret the OH reactivity in the downwind plume.
The results showed generally good agreement for the total
VOC OH reactivity downwind and also gave insight into the
distributions of VOC chemical classes downwind. The mod-
els clearly support the experimental evidence for NMHCs
fueling the formation of OVOCs downwind, which then be-
come the primary fuel for ozone production downwind of the
city.
Acknowledgements. The authors would like to thank University
of New Hampshire students Karl Haase, Rich Luciano, and
Theresa Balanger for their incredible work with chromatograms.
Thanks also to Geoff Tyndall and Rebecca Hornbrook for helpful
discussions. We gratefully acknowledge the NASA Tropospheric
Chemistry Program for funding this research (award number
NNG06GB29G). The National Center for Atmospheric Research is
sponsored by the National Science Foundation.
Edited by: L. Molina
References
Altuzar, V., Tom
´
as, S. A., Zelaya-Angel, O., S
´
anchez-Sinencio, F.,
and Arriaga, J. L.: Atmospheric ethene concentrations in Mexico
City: Indications of strong diurnal and seasonal dependences,
Atmos. Env., 39, 5219–5225, 2005.
Apel, E. C., Calvert, J. G., and Fehsenfeld, F. C.: The Non-Methane
Hydrocarbon Intercomparison Experiment (NOMHICE): Tasks
1 and 2, J. Geophys. Res., 99(D8), 16651–16664, 1994.
Apel, E. C., Calvert, J. G., Gilpin, T., Parrish, D. D., and Fehsenfeld,
F. C.: The Non-Methane Hydrocarbon Intercomparison Experi-
ment (NOMHICE): Task 3, J. Geophys. Res., 104, 26069–26086,
1999.
Apel, E. C., Hills, A. J., Lueb, R., Zindel, S., Eisele, S., and
Riemer, D. D.: A Fast-GC/MS system to measure C
2
to C
4
carbonyls, and methanol aboard aircraft, J. Geophys. Res., 108,
8794, doi:10.1029/2002JD003199, 2003.
Atkinson, R. and Arey, J.: Chem. Rev., 103, 1–246, 2003.
Atkinson, R.: Gas phase tropospheric chemistry of organic com-
pounds: a review, Atmos. Environ., 24A, 1–41, 1990.
Atkinson, R., Kinetics and mechanisms of the gas phase reactions
of the hydroxyl radical with organic compounds, J. Phys. Chem.
Ref. Data, Monograph 1, 1, 4605–4638, 1989.
Baez, A. P., Belmont, R., and Padilla, H.: Measurements of
formaldehyde and acetaldehyde in the atmosphere of Mexico
City, Environ. Poll., 89, 163–167, 1995.
Baez, A. P., Padilla, H., Torres, M. C., and Belmont, R.: Ambi-
ent levels of carbonyls in Mexico City, Atmosfera, 13, 121-131,
2000.
Baker, A. K., Beyersdorf, A. J., Doezema, L. A., Katzenstein, A.,
Meinardi, S., Simpson, I. J., Blake, D. R., and Rowland, F. S.:
Measurements of nonmethane hydrocarbons in 28 United States
cities, Atmos. Environ., 42, 170–182, 2008.
Baker, A., et al.: VOC Measurements in the MCMA basin during
MIRAGE –MEX, Atmos. Chem, Phys., to be submitted, 2010.
Blake, D. and Rowland, F. S.: Urban leakage of liquefied Petroleum
Gas and Its Impact on Mexico City Air Quality, Science, 269,
953-956, 1995.
Atmos. Chem. Phys., 10, 2353–2376, 2010 www.atmos-chem-phys.net/10/2353/2010/
E. C. Apel et al.: Chemical evolution of volatile organic compounds 2373
Chang, J. S., Binkowski, F. S., Seaman, N. L., McHenry, J. N.,
Samson, P. J., Stockwell, W. R., Walcek, C. J., Madronich, S.,
Middleton, P. B., Pleim, J. E., and Lansford, H. H.: The re-
gional acid deposition model and engineering model, State-of-
Science/Technology, Report 4, National Acid Precipitation As-
sessment Program, Washington DC, USA, 1989.
Colman, J. J., Swanson, A. L., Meinardi, S., Sive, B. C., Blake, D.
R., and Rowland, F. S.: Description of the analysis of a wide
range of volatile organic compounds in whole air samples col-
lected during PEM-Tropics A and B, Anal. Chem., 73, 3723–
3731, 2001.
Crounse, J. D., DeCarlo, P. F., Blake, D. R., Emmons, L. K., Cam-
pos, T. L., Apel, E. C., Clarke, A. D., Weinheimer, A. J., Mc-
Cabe, D. C., Yokelson, R. J., Jimenez, J. L., and Wennberg, P.
O.: Biomass burning and urban air pollution over the Central
Mexican Plateau, Atmos. Chem. Phys., 9, 4929–4944, 2009,
/>de Foy, B., Varrela, J. R., Molina, L., and Molina, M.: Rapid ven-
tilation of the Mexico City basin and regional fate of the urban
plume, Atmos. Chem. Phys., 6, 2321–2335, 2006,
/>de Gouw, J. A., Goldan, P. D., Warneke, C., Kuster, W. C.,
Roberts, J. M., Marchewka, M., Bertman, S. B., Pszenny, A.
A., and Keene, W. C.: Validation of proton-transfer reaction-
mass spectrometry (PTR-MS) measurements of gas-phase or-
ganic compounds in the atmosphere during the New Eng-
land Air Quality Study (NEAQS), J. Geophys. Res., 108,
doi:10.1029/2003JD003863, 2003, 2002.
de Gouw, J., Warneke, C., Karl, T., Eerdekens, G., Van der Veen,
C., and Fall, R.: Sensitivity and specificity of atmospheric trace
gas detection by proton-transfer-reaction mass spectrometry, Int.
J. Mass Spect., 223–224, 365–382, 2003.
de Gouw, J. A., Middlebrook, A. M., Warneke, C., et al.: Budget
of organic carbon in a polluted atmosphere: Results from the
New England Air Quality Study in 2002, J. Geophys. Res., 110,
D16305, doi:10.1029/2004JD005623, 2005.
de Gouw, J. and Warneke, C.: Measurements of volatile organic
compounds in the earth’s atmosphere using proton-transfer-
reaction mass spectrometry, Mass Spectrom. Rev., 26, 223–257,
2007.
de Gouw, J. A., Welsh-Bon, D., Warneke, C., Kuster, W.C., Alexan-
der, L., Baker, A. K., Beyersdorf, A. J., Blake, D. R., Cana-
garatna, M., Celada, A. T., Huey, L. G., Junkermann, W., Onasch,
T. B., Salcido, A., Sjostedt, S. J., Sullivan, A. P., Tanner, D.
J., Vargas, O., Weber, R. J., Worsnop, D. R., Yu, X. Y., and
Zaveri, R.: Emission and chemistry of organic carbon in the
gas and aerosol phase at a sub-urban site near Mexico City in
March 2006 during the MILAGRO study, Atmos. Chem. Phys.,
9, 3425–3442, 2009,
/>Doskey, P. V., Porter J. A., and Scheff, P. A.: Source fingerprints for
volatile non-methane hydrocarbons, J. Air Waste Manag. Assoc.
42, 1437–1445, 1992.
Emmons, L. K., Walters, S., Hess, P. G., Lamarque, J F., Pfis-
ter, G. G., Fillmore, D., Granier, C., Guenther, A., Kinnison, D.,
Laepple, T., Orlando, J., Tie, X., Tyndall, G., Wiedinmyer, C.,
Baughcum, S. L., and Kloster, S.: Description and evaluation of
the Model for Ozone and Related chemical Tracers, version 4
(MOZART-4), Geosci. Model Dev., 3, 43–67, 2010a.
Emmons, L. K., Apel, E. C., Lamarque, J F., et al.: Impact of Mex-
ico City emissions on regional air quality from MOZART-4 sim-
ulations, Atmos. Chem. Phys. Discuss., 10, 3457–3498, 2010b,
/>Fast, J. D., de Foy, B., Acevedo Rosas, F., Caetano, E., Carmichael,
G., Emmons, L., McKenna, D., Mena, M., Skamarock, W.,
Tie, X., Coulter, R. L., Barnard, J. C., Wiedinmyer, C., and
Madronich, S.: A meteorological overview of the MILAGRO
field campaigns, Atmos. Chem. Phys., 7, 2233–2257, 2007,
/>Fast, J. D.: Evaluating simulated primary anthropogenic and
biomass burning organic aerosols during MILAGRO: implica-
tions for assessing treatments of secondary organic aerosols, At-
mospheric Chemistry and Physics Discussions, 9, 4805–4871,
2009.
Fortner, E. C., Zheng, J., Zhang, R., Berk Knighton, W., Volka-
mer, R. M., Sheehy, P., Molina, L., and Andr
´
e, M.: Measure-
ments of Volatile Organic Compounds Using Proton Transfer
Reaction – Mass Spectrometry during the MILAGRO 2006 Cam-
paign, Atmos. Chem. Phys., 9, 467–481, 2009,
/>Fried, A. Weibring, P., Walega, J., et al.: Detailed Comparisons of
Airborne Tunable Diode Laser Absorption Spectroscopy Mea-
surements of Formaldehyde with Box Model Calculations during
the 2006 INTEX-B Campaign over Mexico, the Gulf of Mex-
ico and the Remote Pacific Ocean, in preparation, Atmos. Chem,
Phys., 2010.
Galbally, I. E. and Kirstine, W.: The production of methanol by
flowering plants and the global cycle of methanol, J. Atmos.
Chem., 43, 195–229, 2002.
Garcia, A. R., Volkamer, R., Molina, L. T., Molina, M. J., Samuel-
son, J., Mellqvist, J., Galle, B., Herndon, S. C., and Kolb, C. E.:
Separation of emitted and photochemical formaldehyde in Mex-
ico City using a statistical analysis and a new pair of gas-phase
tracers, Atmos. Chem. Phys., 6, 4545–4557, 2006,
/>Gelencs
´
er, A., Siszler, K., and Hlavay, J.: Toluene-benzene concen-
tration ratio as a tool for characterizing the distance from vehic-
ular emission sources, Environ. Sci. Technol., 31, 2869–2872,
1997.
Granier, C. et al.: Present and future surface emissions of
atmospheric compounds, European Commission report EVK
2199900011, />php, 2004.
Grell, G. A., Peckham, S. E., Schmitz, R., McKeen, S. A., Wilczak,
J., and B. Eder, Fully coupled ”online” chemistry within the
WRF model, Atmos. Environ. 39, 6957–6975, 2005.
Grutter, M., Flores, E., Andraca-Ayala, G., and Baez, A.: Formalde-
hyde levels in downtown Mexico City during 2003, Atmos. Env-
iron., 39, 1027–1034, 2005.
Hak, C., Pundt, I., Trick, S., Kern, C., Platt, U., Dommen, J.,
Ord
´
o
˜
nez, C., Pr
´
ev
ˆ
ot, A. S. H., Junkermann, W., Astorga-
Llor
´
ens, C., Larsen, B. R., Mellqvist, J., Strandberg, A., Yu, Y.,
Galle, B., Kleffmann, J., L
¨
orzer, J. C., Braathen, G. O., and
Volkamer, R.: Intercomparison of four different in-situ tech-
niques for ambient formaldehyde measurements in urban air, At-
mos. Chem. Phys., 5, 2881–2900, 2005,
/>Heikes, B. G., Chang, W., Pilson, M. E. Q., Swift, E., Singh, H.
www.atmos-chem-phys.net/10/2353/2010/ Atmos. Chem. Phys., 10, 2353–2376, 2010
2374 E. C. Apel et al.: Chemical evolution of volatile organic compounds
B., Guenther, A., Jacob, D. J., Field, B. D., Fall, R., Riemer,
D., and Brand, L.: Atmospheric Methanol Budget and Ocean
Implications, Global Biogeochem. Cy., 16(80), 1–13, 2002.
Jacob, D. J., Crawford, J. H., Kleb, M. M., Connors, V. S., Bendura,
R. J., Raper, J. L., Sachse, G. W., Gille, J. C., Emmons, L., and
Heald, C. L.: The Transport and Chemical Evolution over the Pa-
cific (TRACE-P) aircraft mission: design, execution, and first re-
sults, J. Geophys. Res., 108, 9000, doi:10.1029/2002JD003276,
2003.
Junkermann W. and Burger, J. M.: A new portable instrument for
continuous measurement of formaldehyde in ambient air, J. At-
mos. Ocean. Technol., 23, 38–45, 2006.
Karl, T., Apel, E., Hodzic, A., Riemer, D. D., Blake, D. R.,
and Wiedinmyer, C.: Emissions of volatile organic compounds
inferred from airborne flux measurements over a megacity, At-
mos. Chem. Phys., 9, 271–285, 2009.
Lei, W., Zavala, M., de Foy, B., Volkamer, R., and Molina, L. T.:
Characterizing ozone production and response under different
meteorological conditions in Mexico City Atmos. Chem. Phys.,
8, 7571–7581, 2008,
/>Lei, W., de Foy, B., Zavala, M., Volkamer, R., and Molina, L. T.,
Characterizing ozone production in the Mexico City Metropoli-
tan Area: a case study using a chemical transport model, Atmos.
Chem. Phys., 7, 1347–1366, 2007,
/>Lei, W., Zavala, M., de Foy, B., Volkamer, R., Molina, M. J., and
Molina, L. T.:Impact of primary formaldehyde on air pollution
in the Mexico City Metropolitan Area, Atmos. Chem. Phys., 9,
2607–2618, 2009,
/>Lin, X., Trainer, M., and Liu, S. C.: On the nonlinearity of the tro-
pospheric ozone production, J. Geophys. Res., 93(D12), 15879–
15888, doi:10.1029/88JD03750, 1988.
Lindinger, W., Hansel, A., and Jordan, A.: Proton transfer reaction-
mass spectrometry (PTR-MS): on-line monitoring of volatile or-
ganic compounds at pptv levels, Chem. Soc. Rev., 27, 347–354,
1998.
Madronich, S. and Flocke, S.: The role of solar radiation in at-
mospheric chemistry, in Handbook of Environmental Chemistry,
edited by: Boule, P., Springer-Verlag, Heidelberg, Germany, 1–
26, 1999.
Madronich, S.: Chemical evolution of gaseous air pollutants down-
wind of tropical megacities: Mexico City case study, Atmos. En-
viron., 40, 6012–6018, 2006.
McKeen, S., Liu, S., Hsie, E Y., Lin, X., Bradshaw, J., Smyth,
S., Gregory, G., and Blake, D.: Hydrocarbon ratios during PEM
West A: a model perspective, J. Geophys. Res., 101D, 15, 2087–
2109, 1996.
Mena-Carrasco, M., Carmichael, G. R., Campbell, J. E., Zimmer-
man, D., Tang, Y., Adhikary, B., D’allura, A., Molina, L. T.,
Zavala, M., Garca, A., Flocke, F., Campos, T., Weinheimer, A. J.,
Shetter, R., Apel, E., Montzka, D. D., Knapp, D. J., and Zheng,
W.: Assessing the regional impacts of Mexico City emissions on
air quality and chemistry, Atmos. Chem. Phys., 9, 3731–3743,
2009, />Millet, D. B., Jacob, D. J., Custer, T. G., de Gouw, J. A., Gold-
stein, A. H., Karl, T., Singh, H. B., Sive, B. C., Talbot, R. W.,
Warneke, C., and Williams, J.: New constraints on terrestrial and
oceanic sources of atmospheric methanol, Atmos. Chem. Phys.,
8, 6887–6905, 2008,
/>Molina, L. and Molina, M. (Eds.): Air Quality in the Mexico
MegaCity: An Integrated Assessment, Kluwer Academic Pub-
lishers, Dordrecht, The Netherlands, 384 pp., 2002.
Molina, L., E., de Foy, B., Fast, J., et al.: An Overview of the
MILAGRO 2006 Campaign: Mexico City Emissions and their
Transport and Transformation, submitted, Atmos. Chem Phys.
Discuss., submitted, 2010.
Molina, L. T., Madronich, S., Gaffney, J. S., and Singh, H. B.:
Overview of MILAGRO/INTEX-B Campaign, IGAC Newslet-
ter, 38, 2–15, 2008.
Ortega, J., Karl, T., Kleinman, L., et al.: Intercomparison of in-
flight VOC concentrations using proton transfer mass spectrom-
etry (PTR-MS) during the MILAGRO Campaign (March 2006):
Battelle G-1 vs. NCAR C-130 coordinated flights, First MILA-
GRO Science Meeting, 2006.
Parrish, D. D., Trainer, M., Holloway, J. S., Yee, J. E., Warshawsky,
M. S., Fehsenfeld, F. C., Forbes, G. L., and Moody, J. L.: Re-
lationships between ozone and carbon monoxide at surface sites
in the North Atlantic region, J. Geophys. Res., 103, 20, 13357–
13376, 1998.
Parrish, D. D., Dunlea, E., Atlas, E., Schauffler, S., Donnelly, S.,
Stroud, V., Goldstein, A., Millet, D., McKay, M., Jaffe, D., Price,
H., Hess, P., Flocke, F., and Roberts, J.: Changes in the photo-
chemical environment of the temperate North Pacific troposphere
in response to increased Asian emissions, J. Geophys. Res. 109,
D23S18, doi:10.1029/2004JD004978, 2004.
Seila, R. L., Lonneman, W. A., and Meeks, S. A.: Determination
of C
2
to C
12
ambient air hydrocarbons in 39 U.S. cities, from
1984 through 1986, project summary, US Environ. Prot. Agency,
Washington DC, USA, 418 pp., 1989.
Singh, H. B., Kanakidou, M., Crutzen, P. J., and Jacob, D. J.: High
concentrations and photochemical fate of oxygenated hydrocar-
bons in the global troposphere, Nature, 378, 50–54, 1995.
Stroud, C. A., Morneau, G., Makar, P. A., Moran, M. D., Gong,
W., Pabla, B., Zhang, J., Bouchet, V. S., Fox, D., Venkatesh, S.,
Wang, D., and Dann, T.: OH-reactivity of volatile organic com-
pounds at urban and rural sites across Canada: Evaluation of air
quality model predictions using speciated VOC measurements,
Atmos. Env., 42, 7746–7756, 2008.
Roberts, J., Fehsenfeld, F., Liu, S., Bollinger, M., Hahn, C., Albrit-
ton, D., and Sievers, R.: Measurements of aromatic hydrocarbon
ratios and NO
x
concentrations in the rural troposphere: observa-
tion of air mass photochemical aging and NO
x
removal, Atmos.
Environ., 18, 2421–2432, 1984.
Rogers, T. M., Grimsrud, E. R., Herndon, S. C., Jayne, J. T., Kolb,
C. E., Allwine, E., Westberg, H., Lamb, B. K., Zavala, M.,
Molina, L. T., Molina, M. J., and Knighton, W. B.: On-road
measurements of volatile organic compounds in the Mexico City
Metropolitan Area using proton transfer reaction mass spectrom-
etry, Int. J. Mass Spectrom., 252, 26–37, 2006.
Sommariva, R., Osthoff, H. D., Brown, S. S., Bates, T. S., Baynard,
T., Coffman, D., de Gouw, J. A., Goldan, P. D., Kuster, W. C.,
Lerner, B. M., Stark, H., Warneke, C., Williams, E. J., Fehsen-
feld, F. C., Ravishankara, A. R., and Trainer, M.: Radicals in the
marine boundary layer during NEAQS 2004: a model study of
day-time and night-time sources and sinks, Atmos. Chem. Phys.,
Atmos. Chem. Phys., 10, 2353–2376, 2010 www.atmos-chem-phys.net/10/2353/2010/
E. C. Apel et al.: Chemical evolution of volatile organic compounds 2375
9, 3075–3093, 2009,
/>Tie, X., Madronich, S., Walters, S., Rasch, P., and Collins, W.: Ef-
fect of Clouds on photolysis and oxidants in the troposphere, J.
Geophys. Res., 108, 4642, doi:10.1029/2003JD003659, 2003.
Tie, X. X., Madronich, S., Li, G. H., Ying, Z. M., Zhang, R. Y.,
Garcia, A. R., Lee-Taylor, J., and Liu, Y. B.: Characterizations of
chemical oxidants in Mexico City: A regional chemical dynami-
cal model (WRF-Chem) study, Atmos. Environ., 41, 1989–2008,
2007.
Tie X., Madronich, S., Li, G., Ying, Z., Weinheimer, A., Apel, E.,
and Campos, T.: Simulation of Mexico City Plumes during the
MIRAGE-Mex Field Campaign using the WRF-Chem model,
Atmos. Chem. Phys., 9, 4621–4638, 2009,
/>Vega, E., Mugica, V., Carmona, R., and Valencia, E.: Hydrocarbon
source apportionment in Mexico City using the chemical mass
balance receptor model, Atmos. Environ., 34, 4121–4129, 2000.
Velasco, E., Lamb, B., Pressley, S., Allwine, E., Westberg,
H., Jobson, T., Alexander, M., Prazeller, P., Molina, L., and
Molina, M.: Flux measurements of volatile organic compounds
from an urban landscape, Geophys. Res. Lett., 32, L20802,
doi:10.1029/2005GL023356, 2005.
Velasco, E., B. Lamb, H. Westberg, E. Allwine, G. Sosa, J. L.
Arriaga-Colina, B. T. Jobson, M. L. Alexander, P. Prazeller, W.
B. Knighton, T. M. Rogers, M. Grutter, S. C. Herndon, C. E.
Kolb, M. Zavala, B. de Foy, R. Volkamer, L. T. Molina, and M. J.
Molina Distribution, magnitudes, reactivities, ratios and diurnal
patterns of volatile organic compounds in the Valley of Mexico
during the MCMA 2002 & 2003 field campaigns, Atmos. Chem.
Phys., 7, 329–353, 2007,
/>Volkamer, R., Molina, L. T., Molina, M. J., Shirley, T., and Brune,
W. H.: DOAS measurement of glyoxal as an indicator for fast
VOC chemistry in urban air, Geophys. Res. Lett., 32, L08806,
doi:10.1029/2005GL022616, 2005.
Volkamer, R., San Martini, F., Salcedo, D., Molina, L. T., Jimenez,
J. L., and Molina, M. J.: A Missing Sink for Gas-Phase Gly-
oxal in Mexico City: Formation of Secondary Organic Aerosol,
Geophys. Res. Lett., 34, L19807, doi:10.1029/2007GL030752,
2007.
Voss, P. B., Zaveri, R. A., Flocke, F. M., Mao, H., Hartley, T. P.,
DeAmicis, P., Deonandan, I., Contreras-Jim
´
enez, G., Martnez-
Antonio, O., Figueroa Estrada, M., Greenberg, D., Campos, T.
L., Weinheimer, A. J., Knapp, D. J., Montzka, D. D., Crounse,
J. D., Wennberg, P. O., Apel, E., Madronich, S., and de Foy,
B.: Long-range pollution transport during the MILAGRO-2006
campaign: a case study of a major Mexico City outflow event
using free-floating altitude-controlled balloons, Atmos. Chem.
Phys. Discuss., 10, 3347–3399, 2010,
/>Voss, P., Hartley, T. P., DeAmicis, P., et al.: Reconstruction of tra-
jectories, mixing, and dispersion of a Mexico City pollution out-
flow event using in-situ observations from free-floating altitude-
controlled balloons, Eos Trans. AGU, 88(52), Fall Meet. Suppl.,
Abstract A41F-07, 2007.
Warneke, C., McKeen, S. A., de Gouw, J. A., et al.: Determination
of urban volatile organic compound emission ratios and compar-
ison with an emissions database, J. Geophys. Res., 112, D10S47,
doi:10.1029/2006JD007930, 2007.
Warneke, C., de Gouw, J. A., Lovejoy, E. R., Murphy, P. C.,
Kuster, W. C., and Fall, R.: Development of Proton-Transfer Ion
Trap-Mass Spectrometry: on-line detection and identification of
volatile organic compounds in air, J. Amer Soc. M. Spectrom.
16, 1316–1324, 2005a.
Wert, B. P., Trainer, M., Fried, A., et al.: Signatures of ter-
minal alkene oxidation in airborne formaldehyde measure-
ments during TexAQS 2000, J. Geophys. Res., 108, 4104,
doi:10.1029/2002JD002502, 2003.
Wesely, M. L.: Parameterization of surface resistance to gaseous
dry deposition in regional-scale numerical models, Atmos. Env-
iron. 23, 1293–1304, 1989.
West, J. J., Zavala, M. A., Molina, L. T., Molina, M. J., Martini,
F. S., McRae, G. J., Iglesias, G. S., and Colina, J. L.: Model-
ing ozone photochemistry and evaluation of hydrocarbon emis-
sions in the Mexico City metropolitan area, J. Geophys. Res.,
109, D19312, doi:10.1029/2004JD004614, 2004.
Wiedinmyer, C., Quayle, B., Geron, C., Belote, A., McKenzie, D.,
Zhang, X., O’Neill, S., and Wynne, K.: Estimating emissions
from fires in North America for air quality modeling, Atmos.
Environ., 40, 3419–3432, 2006.
Wood, E. C., Herndon, S. C., Onasch, T. B., Kroll, J. H., Cana-
garatna, M. R., Kolb, C. E., Worsnop, D. R., Neuman, J. A.,
Seila, R., Zavala, M., and Knighton, W. B.: A case study of
ozone production, nitrogen oxides, and the radical budget in
Mexico City, Atmos. Chem. Phys., 9, 2499–2516, 2009,
/>Yokelson, R. B., Urbanski, S. P., Atlas, E. L., Toohey, D. W., Al-
varado, E. C., Crounse, J. D., Wennberg, P. O., Fisher, M. E.,
Wold, C. E., Campos, T. L. Adachi, K., Buseck, P. R., and Hao,
W. M., Emissions from forest fires near Mexico City, Atmos.
Chem. Phys., 7, 5569–5584, 2007,
/>Zavala, M., Herndon, S. C., Slott, R. S., Dunlea, E. J., Marr, L.
C., Shorter, J. H., Zahniser, M., Knighton, W. B., Rogers, T. M.,
Kolb, C. E., Molina, L. T., and Molina, M. J.: Characterization of
on-road vehicle emissions in the Mexico City Metropolitan Area
using a mobile laboratory in chase and fleet average measure-
ment modes during the MCMA-2003 field campaign, Atmos.
Chem. Phys., 6, 5129–5142, 2006,
/>Zhang, Q., Streets, D. G., Carmichael, G. R., He, K. B., Huo, H.,
Kannari, A., Klimont, Z., Park, I. S., Reddy, S., Fu, J. S., Chen,
D., Duan, L., Lei, Y., Wang, L. T., and Yao, Z. L.: Asian emis-
sions in 2006 for the NASA INTEX-B mission, Atmos. Chem.
Phys., 9, 5131–5153, 2009a,
/>Zhang, Y., Dubey, M. K., Olsen, S. C., Zheng, J., and Zhang,
R.: Comparisons of WRF/Chem simulations in Mexico City
with ground-based RAMA measurements during the 2006-
MILAGRO, Atmos. Chem. Phys., 9, 3777–3798, 2009,
/>Zhao, J. and Zhang, R. Y.: Proton transfer reaction rate constants
between hydronium ion (H
3
O
(+)
) and volatile organic com-
pounds, Atmos. Environ., 38, 2177–2185, 2004.
www.atmos-chem-phys.net/10/2353/2010/ Atmos. Chem. Phys., 10, 2353–2376, 2010