Human Biomonitoring of Environmental Chemicals pot
Bạn đang xem bản rút gọn của tài liệu. Xem và tải ngay bản đầy đủ của tài liệu tại đây (2.53 MB, 8 trang )
Human Biomonitoring
of
Environmental
Chemicals
Measuring
chemicals
in
human
tissues
is
the
"gold
standard"
for
assessing
people's
exposure
to
pollution
Ken Sexton, Larry L.
Needham
and
James L. Pirkle
W
hat
ch
emicals
in
yo
ur
daily rou-
tine should
yo
u be m
os
t con-
ce
rn ed abo
ut
? The
vo
latile or
ga
nic
co
mp
o
und
s
fr
om
yo
ur
ca
rp
et? The ex-
haust fumes on
th
e ro
ad
to work? The
pes
ti
ci
de residues
in
th
e apple
in
your
lund ,? Most of us are exposed to l
ow
l
eve
ls
of
thousa
nd
s of toxic chemicals
every day. H
ow
can a person
-o
r a na-
ti
on
-deci
de which s
ub
stances should
be co
ntr
olled most
ri
go
rousl
y?
One strategy is to go after the largest
so
ur
ces of pollution. This approach cer-
tainly mak
es
se
n
se
when
th
ose
pollu-
ta
nt
s h
ave
obvious a
nd
w
id
es
pr
ead
co
n
se
quen
ces,
such
as
war
min
g
th
e
globe, causing algal
bl
ooms, eroding the
ozo
ne l
aye
r or killing o
ff
wi
ldlife. But
fo
r p
ro
t
ec
tin
g human h
ea
lth
, this s
trat
e-
gy does not
se
rve so we
ll
, because the
link betw
ee
n a given compolUld and its
biol
og
ical effects c
an
be diffic
ult
to
gauge.
Fo
r epide
mi
ologists to correlate
env
ir
Oll
me
ntal pollutants with health
pro
bl
ems, they need to kn
ow
who has
been exposed a
nd
at what leve
l.
This kn
ow
l
edge
is exceptiona
ll
y dif-
fi
c
ult
to gain when there is a lag be-
t
wee
n
ex
po
sure and
th
e manif
es
tation
of illness.
In
such cases,
th
e data are
se
ldom- if
eve
r- sufficient to deter-
K
f?II
Se
xt
o
ll
is
n p
rofessor
of
e
ll
u
ir
O
llm
e
lltni
sc
i-
e
ll
ces
at
th
e
Ulli
vers
ity
Of
T
exas
Sc
/
wo
f of
Publ
ic
He
alth
,
Br
ow
l/
su
ifl
e R
eg
io
llal
C
ampl/
s,
alld
pa
st
pr
esi
de
llt
of
th
e illtematiollal
Soc
iety
of
Ex
pos
ur
e
Allalysis (lSEA) .
iJ1r
ry
L.
N
ee
dham
is
Chie
f
of
the
O
rgalli
c Allalytic
al
T
ox
ic
olo
gy
Bral/
ch
ill
th
e
Na
-
tiolla/
Cellter
fo
r
Ell
v
irolllll(?lltal
He
alth
of
th
e
Ce
llt
ers for
Di
se
a
se
COlltrol
alld
Pr
eve
lltioll
(C
D
C)
alld
the
CIIrr
e
llt
lS
EA
p
n'S
id
e
llt
.
Jam
es
L.
Pi
r
kl
e is
th
e Deputy
Dir
ec
tor
fo
r
Sci
e
ll
ee
at
th
e
CD
C's
Ell
ui
rO
llm(?llt
al He
alth
LAborat
o
ry
. Sex-
tO
l"
S addr
ess
is
Ull
ive
rs
it
y
of
Te
xa
s Sch
oo
l
of
Pub-
li
c
Hmlt/I
,
Bro
w
l/
su
ill
e
Re
gio
llal
Campu
s,
RA
HC
Bllildill
g,
80
Fort
Bro
W
lI
,
Br
ow
l/
su
ill
e,
TX
78520 .
Illfe
r/
wt:
kse
xf
Ol'
@
ll
fb
.e
dll
mine
th
e preci
se
age
nt,
th
e deta
il
s of
co
nt
act a
nd
the full exte
nt
of the a
ff
ect-
ed po
pul
a
ti
o
n.
Co
mplicating matters,
th
e scie
ntif
ic
und
ersta
ndin
g
of
the
m
ec
hanisms of exp
os
ur
e,
sud1 as h
ow
v
ari
ous compoWlds are
ca
rried
through
the air a
nd
chang
ed
along the way, is
o
ft
en
in
co
mplete.
As
a result, epidemi-
ol
og
ists o
ft
en find it diffic
ult
to
es
tab-
li
sh cause-
and
-e
ff
ect rela
ti
ons
hip
s for
env
ir
onmentally indu
ce
d sic
kn
ess
es.
With
out relia
bl
e info
rm
a
ti
on
so
me pol-
lutants may be
wlf
airly blamed, where-
as others exe
rt
their dire e
ff
ects without
cha
ll
enge. Fo
rtun
atel
y,
there is hope: a
method of accurately measuring not
only
co
ntact with, but al
so
ab
so
rption
of toxic chemicals
fr
om,
th
e environ-
ment-
human
biomonito
rin
g.
Is
It
in Me?
Each person's risk
of
d
eve
loping an en-
v
ir
onme
nt
a
ll
y related disease, such as
cancer, results
fr
om a unique combina-
ti
on of
expos
ur
e
ge
nes, age, sex, nutri-
ti
on a
nd
lifestyle.
Sc
ience doesn't fully
understa
nd
ho
w
th
ese
varia
bl
es inter-
act,
but
exp
os
ur
e is
cl
ea
rl
y a key fac-
tor. Thus, a fundamental
go
al
of envi-
ronmental health policy is to
pr
ev
ent
(or at least
redu
ce) p
eo
ple ta
king
in
chemicals
that
le
ad
to any of the
fi
ve
D
s-d
iscomfort, dysfunc
ti
on,
dis
abili-
t
y,
di
se
a
se
or de
ath
.
Exp
os
ure to
an
env
ir
o
nm
e
ntal
chemi
ca
l is minimally defined as con-
tact with
th
e skin, mouth or n
os
tril
s-a
meanjng that includes breathing, eat-
ing and drinking. For the
purpo
ses of
a
ssess
in
g
ri
sk,
th
e m
os
t
im
po
rtant at-
tribut
es
of
ex
p
os
ure are m
ag
nitud
e
(w
hat is
th
e c
on
centra
ti
on?), dura
ti
on
(h
ow
long does co
nt
act last?),
fr
e
qu
en-
cy (h
ow
o
ft
en do exp
os
ur
es
occ
ur
?)
and
tim.in
g (at
what
age
do ex
po
sures
occur
?).
The calculation of actual ex
po
-
sure al
so
requir
es
co
mpl
ex
detecti
ve
wo
rk to
di
scover all kinds of details,
in
cl
udin
g the chemical identity (f
or
ex-
ampl
e,
th
e p
es
ticid
e chl o
rp
y
rif
os
),
source (nea
rb
y agricultural use), medi-
um
o f transport (ground water) and
ro
ute (drinking contaminated
we
ll
wa-
ter
).
Sc
ientists must cons
id
er this info
r-
ma
ti
on on
ex
po
sure aga
in
st the b
ac
k-
gro
und
of p
eo
pl
e's
activity
patt
erns,
eating a
nd
drink
in
g habits, a
nd
lifestyl
e,
and they
mu
st also evaluate the influ-
ence
of
o
th
er
d1
emicals
in
the a
ir
, water,
beverages, food,
du
st
and
so
il
. Ove
raU
,
this is a daunting challenge.
Histor
ica
ll
y,
th
ose
scientists who un-
de
rt
oo
k such a
co
mpl
ex
task h
ave
re-
li
ed on indir
ec
t me
th
od
s:
qu
es
t
io
n-
na
ir
es, dia
ri
es, intervi
ews,
central
iz
ed
monitoring of
co
mn1ul
uty
a
ir
or
wa
ter,
and a reco
rd
of
br
oad activity pa
tt
e
rn
s
among the population.
But
th
e results
were
o
ft
en
di
s
app
ointing. Although
th
ese
ci
rc
um
stantial approach
es
ha
ve
the adva
nt
ages of
pr
acticality and fru-
ga
li
ty,
th
ey
can also intr
od
uce substan-
ti
al unce
rt
a
in
ty into r
es
ulting exposure
estimates. Tltis sho
rt
co
ming muJtipli
es
th
e potential
for
a fundamental e
rror
-
cla
ss
ify
in
g a person as "not ex
po
se
d"
wh
en he or she has b
ee
n or vice
ve
rsa.
A seco
nd
a
ppr
oach, the direct mea-
surement of an individual's environ-
me
nt
, is
so
metimes a possibili
ty-
for ex-
ampl
e,
a person might
ca
rry a porta
bl
e
monitor to reco
rd
co
nta
ct wi
th
a
ir
bo
rn
e
che
mi
ca
l
s.
Al
though this technique of-
fers an unequivoc
al
record of chelnic
al
contact, it is tec
hn
ol
og
i
ca
ll
y infeasible
or p
ro
hibiti
ve
ly
ex
pensive to measure
most
po
llutants this wa
y.
Also, although
sud, monitors do
cum
ent exposure, they
te
ll
nothing about the
pe
rson's
upt
ake
o f th
ese
airbo
rn
e chemicals- h
ow
mu
ch truly gets i
nt
o his or her bod
y,
which is, of co
ur
se,
th
e m
os
t relevant
© 2004 Sigma
Xi,
Th
e Scienti
fic
Research Societ
y.
Reproduction
38
Ame
rican Scientist,
Vol
ume 92
wi
th
pe
nn
ission only. Contact pe
nn
s@
amsci.org.
•
':::
\ .
.
, ,
•
Bettmann
/
Co
r
bis
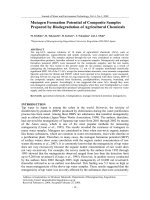
Figure
1.
In
Jul
y 1945,
DDT
was
widel
y (and mistakenly) hailed as a progressive measure
to
eradicate
di
sease-bearing mosquitoes
without
po
s-
ing a
ri
sk
to
human health.
In
this photo from a be
ac
h on Long Island,
New
York
, a
new
insecticide-s
pra
yi
ng machine
is
tested as beachgoers
play in
th
e mist. Although this chemical contact is obvious, many other sources
of
environmental chemical exposure
are
more difficult to iden-
tify.
Human
biomonitoring
exami
n
es
people's
blood
and urine to evaJuate actual l
ev
els
of
more than a hundred substances.
information
fo
r
assessing
health risk.
Fortwlate
l
y,
technologic
al
ad vances in
biomedicine and analytical chemistry
now
make
it possible to
ge
t exac
tl
y tills
info
rm
a
ti
on. Biolllonitoring
meaSUTes
the actual l
eve
ls
of
suspected
environ-
mental chemicals in
hwnan
ti
ss
ues and
fluids.
This
third
approac
h has come to
be ilie
"go
ld s
tanda
rd"
for assessing ex-
posure
to
chemicals.
Blood
(and
Urine)
Will Tell
Bio
monito
rin
g is not new. It has its roots
in ilie analysis
of
biological
sanlp
les for
markers for various pharmaceutical
compounds
and occupational che
mi
-
cal
s,
efforts
that
so
u
gh
t to
preve
nt
the
harmful accu
mul
a
ti
on
of
dangerous
substances. A1tllOugh it h
ad
a differe
nt
name at the time, the
ge
neral idea was
www.americanscientis
t.
org
first applied a
bout
130 years ago when
doctors
mo
n itor
ed the amount of sa
li
-
cy
luri
c acid
in
the urine of rhe
unl
atics
who
we
re being treated with lar
ge
dos
-
es of salicy
li
c acid (ilie precursor of as-
pir
in
).
And
as
ear
ly
as
t
he
1890s,
fa
ctory
wo
rkers who
were
exposed
to l
ea
d h
ad
the
ir
bl
ood
and
urine
screened to fore-
stall ilie elevated levels
that
pr
oduced
acute lead
poisoni
ng.
The
se
in
ves
ti
gators
soo
n lea
rn
ed
that the degree of contact
wi
th a sub-
st
ance
d
oes
n't necessarily determine
the biol
og
ically relevant
expos
ure to
th
at
ch
emical.
As
a result,
th.i
s measure
didn
't
help
mu
ch in
pr
ed
icting
th
e
risks
of
l
ead
poiso
nin
g.
However,
they
did
f
ind
that
the amo
unt
of a
co
m-
pound
tl,
at
crosses
th
e bod
y's
bound-
a
ri
es
{ca
ll
ed the
i.nt
ernal or absorbed
dose
,
or
so
metimes ilie
body
b
urd
en)
has
con
siderab
le val
ue
for estinl
ating
the risk to h
ea
lth
. Today, it
is
relati
ve
ly
aff
or
d
able
to
m
easure
the
absorbed
do
ses
for
hu
n
dreds
of
che
mi
cals
by
l
ook
ing for
biomarkers
of
exposure
in
access
ibl
e human
ti
ss
ues a
nd
flui
ds, in-
cluding saliva,
seme
n, urine,
sp
utum,
h
air,
feces, breast
milk.
and fingernails
(all
of
which can
be
co
ll
ected r
ead
il
y),
a
nd
blood, lung tissue, bone marrow,
f
ollic
ul
ar
fluid,
ad
ip
ose
tissue
and
blood vessels (which require incursion
into
th
e body). Alth
oug
h
pro
cedures
to
co
ll
ect
any
of the first
se
t
wo
uld
, tech-
ni
caU
y,
be
considered "noninvasive,"
in
fa
ct, that categoriza
ti
on rests on cul-
tural, psychological
an
d social factor
s.
So
obtai
nin
g the
ri
ght
material can
some
t
imes
be
aw
kward. Fortunately
2004 January-February 39
•
•
•
••
oXlcan toxicant 2
exposure assessment
emission
source
l
•
•
.
•
•
pathway
~
•
1
•
potential
dose
~
I
absorption barrier
internal
dose
adverse
effect
•
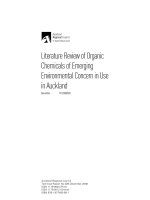
Figure 2. Which toxicant is morc dangerous? Because
of
th
e
mu
ltiple st
ep
s through which an en-
vironmental chemical
mu
st pass before
it
become
s a
po
tential health threat,
th
e
answe
r is not
al-
way
s clear. Here, toxicant 1 is more abundant
in
the e
nviron
m
en
t, but
th
e specific properti
es
of
the
chemical
may
mean
th
at
it
pos
es
less medical risk than ano
th
er
compound.
Different
methods
of
exposure assessment can
eva
luate each
of
these steps, but biomarker analysis,
which
measur
es
in-
ternal
do
ses
of
specific s
ub
stances, provides the m
os
t relevant information for
human
health.
for
th
ose
of us in
th
e biomonitoring for the
pr
esence of
bi
ological markers
fie
ld, it's never necessary to collect all
of
exposure-genera
ll
y the targeted
of those samples- blood a
nd
urine are chemical,
it
s primary me
tab
olites or
typica
ll
y sufficient. These are analyzed the
pr
oducts
of
it
s reac
ti
on wi
th
certain
40 Ameri
ca
n Scie
nt
ist,
Volume
92
natural co
mpound
s in the bod
y,
such
as
pro
tei ns.
Choosing the
appropriat
e
ti
ssue or
fluid
fo
r biological monitoring
is
based
pr
imarily on the chemical and physic
al
pr
operties
of
the chemical of interest
and,
in
so
me cases,
th
e time interval
s
in
ce
th
e last ex
po
s
ur
e.
For
exampl
e,
so
me chemicals including diox
in
s,
polychlorinated biphenyls a
nd
organ
o-
chlorine pes
ti
ci
des have long biological
res
id
ence times in the body (months
or
years) becau
se
they are sequestered in
fatty
ti
ssu
es.
They are
thu
s sa
id
to be
fat-loving
or
, to use the
pr
oper term,
lipophili
c.
By
co
ntr
ast,
ot
h
er
chemicals
such
as
orga
no
pho
s
phat
e pesticides
and volatile organic
co
mpound
s, which
don't acc
umulate
in fats (being
li
po-
phobi
c),
have relatively short biologi
cal
residence times (ho
ur
s or days) and
tend to be metabolized rapidly and ex-
cre
ted
in
the
urin
e.
Th
e
tim
e s
in
ce
th
e l
as
t exposure
can
also pl
aya
key role in detemlining the
best biological spec
im
en for analysis.
For example, a persistent chemical, such
as a dioxin,
re
mains present
in
blood
for
a much longer period (years)
th
an
do
es
a nonpersiste
nt
compound such as ben-
zene (hours), but dioxin does not form
Signifi
ca
nt urinary metabolit
es,
whereas
benzene does. For these reasons, persis-
tent chemicals are typically measured in
blood, and nonpersistent che
mi
ca
ls are
measured
in
urine (as soon a
ft
er expo-
sure as poss
ibl
e),
although
th
ey can
also
be detected
in
blood soon after
ex
po-
su
re
if
th
e analy
ti
ca
l methods are s
uffi
-
ciently sens
iti
ve-
and
they usually are.
Specia
li
sts
ca
n n
ow
detect ex
tr
emely
l
ow
levels parts-per-billion, parts-per-
trillion, even parts-per-quadrillion
-<lf
multi
ple
markers us
in
g a rela
ti
vely
sma
ll
sample, say,
10
milliliters or less.
Clea
rl
y,
the sensitivity of the analysis
is important
in
chOOSi
ng what to mea-
sur
e-
but
it's not everythin
g.
Other
is-
sues must be conside
red
before
th
e
re-
s
ult
s can be consider
ed
meanin
gf
ul.
We
ll
before attempting to discern trace
amounts of target chemicals,
an
inves-
ti
gator should be
ab
le to
answer
three
br
oad questio
ns:
How
is the meas
ur
e-
ment related to the magnitud
e,
dura
-
tion, frequency and timing of expo-
s
ur
e?
H
ow
do
sub
se
que
nt
processes
within the
body-;;uch
as absorption,
distribution, metabo
li
sm and excre-
ti
on- influence
th
e targeted biomark-
er? And is this particular marker spe-
cific
for
a ce
rt
a
in
che
mi
ca
l or d
oes
it
ind
ka
te
an
enti
re
cla
ss of subs
tan
ces?
Because the science underpinning
human biomonitoring has improved
significantly in rece
nt
years, these
qu
es-
tions are n
ow
easier to answer. The
rap
id
adva
nc
ernent in knowledge of
wh
at
the
body
does
to chemicals that
are
inhaled
,
ingested
or
absorbed
through the skin has led to better inter-
pretation of the range of concentrations
for
various biomarkers. And the num-
b
er
of
t
estable
compounds
h
as
in-
creased dramatically: Sensitive
and
spe-
cific
bi
oma
rk
ers are
ava
ilab
le f
or
man
y
envi
ro
nmental che
mi
cals, including
metals, dioxins, furans,
po
lychlorinated
bip
henyls, pesticides, volatile organic
co
mpounds
, phthalates,
ph
ytoestrogens
and environmental tobacco smoke. As
research continues, the
li
st will surely
continue to grow.
Exposure
mId
Uptake
Bi
omo
nito
rin
g has many advantages
over traditional methods.
For
example,
biological
s.unp
les reveal the integrated
effects of
repeated
co
nt
act. Also, this
approach
documents
a
ll
routes of expo-
s
ur
e-
inhalation,
ab
so
rption
thr
ough
the
sk
in
a
nd
ingestion, including
hand-
to-mouth
tra nsfer
by
c
hildr
en. Such
spec
imens also re
fl
ect the modifying in-
fluences of physiology, bioavailability
and bioaccumulation, which
can
mag-
nify the concentrations of
so
me envi-
ronmental chemicals enough to raise
them
above
the
detection
threshold
.
Perh
aps
most
importantly
, these tests
can help
es
tablish correla
ti
ons b
etwee
n
expos
ur
e and subseque
nt
illness
in
in
-
dividua
l
s-w
hich is o
ft
en
the key ob-
servation in proving whether or not a
link exists.
A great strength of biomonitoring
is
th
at
it
pro
vides Wlequivocal evidence
that both exposure a
nd
uptake have tak-
en place.
In
some cases these da
ta
can
confinn the findin
gs
of traditional expo-
su
re
estirnates.
For
exam
pl
e,
in
1
979,
res-
idents of
Triana
, Alabama, were noti-
fied
that
fish from a nearby creek had
forty times
more
DDT
than
the allow-
able limit, even though the local DDT
manufacturing plant had been inactive
since 1971. The announcement was es-
pecially conce
rnin
g because many peo-
ple in that area cau
gh
t
and
ate the
fi
sh
regularly.
In
response to this discovery,
th
e
Centers
for
Di
sease
Control
and
Prevention (CDC) constructed
an
eval-
uation based on DDT concentrations in
fish a
nd
the
amoun
t of fish eaten
per
week. This estimate indeed correlated
with levels of DDT
and
its metabolites,
www.ame
ri
canscientist.org
food
soi
V
dust
water
levels levels levels air
nu:;~:~~al
levelS
j/
heallh
h
leslyle
~mathematlcal
predicted
level
of
toxicant
personal •
modeling
+
in
people
hag::etic
~t
~
predisposition
/~
lung
, intestine
and'
i
excretion
skin
absorption rates
metabolism accumulation
j
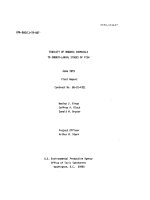
Figure
3.
Traditional esti
mat
es
of
human exposure have to account
for
many variables, in·
eluding
so
me
that
demand assumptions about factors
that
are
poorly understood.
Th
e resu
lt
is
often uncertain.
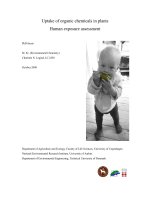
human tissues
or fluids
personal
environment or
microenvironment
~
emission
~
accuracy
Figure 4. Exposure
to
environmental chemi
ca
ls c
an
be assessed in several ways. Generall
y,
th
e
accuracy and cost vary togeth
er.
Monitoring emission sources is the least expensive and least
accurate means
of
determining human exposure, whereas biomarker meas
ur
eme
nt
is mo
re
costly but also highly informative for that person.
2004
January-February
41
Figure
5.
At
its Environmental Health Laboratory, CDC scientists use several types
of
high-
resolution mass spectrometry to analyze human tissue and fluid samples. The equipment
shown here is being used
to
measure dioxin levels in a sample
of
blood se
rum.
(Photograph
courtesy
of
James
L.
Pirkle.)
DOE and DOD, in the blood of Triana
res
id
ents.
In
a similar story that un-
folded in
U,
e late 1980s, chemical-plant
workers in
New
Jersey and Missouri
discovened that they had been exposed
to dioxin-contaminated compou
nd
s up
to
U,
e
ear
ly 1970s. They h
ad
come into
contact wi
th th
e di
ox
in in
various
ways-
breathing
it
, swa
ll
ow
ing
it
and
taking it
in
through the skin. Despite
the
comp
lexi
ti
es
of
th
e
ir
interaction
w ith this dangerous sub
stance-a
nd
the time interval s
in
ce
expos
ur
e-a
scheme that used occupational records
to calculate the
duration
of potential
expos
ur
e
was
able to acc
ur
ately es
ti
-
mate inte
rnal
doses. This finding was
confirmed by the correlation of these
results with
th
e conce
ntr
ation of djo
x-
ins in
th
eir blood.
Hav
in
g information abo
ut
expos
ur
e
alld
uptak
e is
more
than a
pro
forma
de-
tail:
There
are
many cases
in
which
tra
-
ditional estimates of exposure
(q
ues-
tionnaires,
proximity
to
so
urces,
environmental concen
tr
ations, con-
structed scenarios) are not correlated
with measured biomarkers. For exam-
ple, from 1962 to
1971
,
the
U.s. Air
Force sprayed the defoliant
known
as
"Agent Orange" in Vietnam. Many ser-
vice members
who
participated in that
operat
ion touched or breathed the her-
bicide, potentially exposing themselves
42 Ameri
ca
n
Sc
ientist, Volume
92
to
hi
gh levels of dioxin. The Air Force
fir
st estinlated
th
e
risk
to soldiers using
a sce
na
rio approach, which included
the average dioxin concentra
ti
on in
Agent Orange, the
number
of ga
ll
ons
used
during
a
so
ldi
er's
tour
of
duty
,
and
the frequency
and
duration
of
p0-
tential con
ta
ct based on job descriptiOll.
Despite a
co
nsiderable
sc
ientific effort
that
went
into these
pr
edic
ti
ons, CDC
studies in the late 1980s proved
that
none of
th
e exposure estimates were
corre
lated
with
the
measured
blood
levels of dioxin in at-risk troops. A sub-
sequent
investigation
of
personnel
with
th
e
hi
ghest dioxin levels did iden-
tify
so
me patterns that explained their
in
creased con
tact
-
for
exam
pl
e, small-
statu red enlisted men o
ft
en climbed
into the chenlical tanks
to
clean out
residual Agent Orange.
A more
st
riking
examp
le of the val-
ue of biomonitoring came
in
the mid-
1970s when the United States elected
to start phasing o
ut
l
eaded
gasolin
e.
Prior to this decision, traditional mod-
els had suggest
ed
that eliminating lead
in
gaso
lin
e would have only a s
li
ght ef-
fect on people
's
uptak
e of th
at
metal.
However, biomonitoring data from the
CDC's
Second
atio
nal Health
and
Nutrition Examination
Survey
re-
vealed
th
at from 1976 to 1980 (as un-
l
eade
d
fu
el
was
first introduced
and
gasoline
lead
decreased
by
approxi-
mately
55
percent) there was a parallel
decline
in
the amolmt of lead coursing
thr
ough
th
e veins
of
the
U.S.
popula-
ti
on. Overall, average blood concentr
a-
ti
ons decreased from abo
ut
16 to less
th
an 10
micrograms
of
lead
per
deciliter of blood. These data demon-
s
tr
ated the effectiveness
of
removing
lead from gasoline, and
th
ey were a
dominant factor
in
the decision by the
Environmental Protection
Agency
(EPA) to remove l
ead
from gasoline
m
ore
rapidly
-a
ta
sk
th
at
was
effec-
tively complete by 1
991.
Today, the av-
erage blood-lead level in the
U.S.
pop-
ulation
is
less than 2 micrograms per
deciliter
Exposure Disclosure
The
st
ud
y
th
at
revealed the tight
co
n-
nection between
U,
e lead
in
people's gas
tanks and the lead in
th
eir blood was
mounted by the CDC, which conducts
the Na
ti
onal Health and Nutrition
Ex-
amination
Surveys
(NHANES
for
short).
A
lth
ough
no
environmental
chemicals were measured as part
of
NHANES I (1971-1975), starting with
NHANES
II
(1976-
19
80),
the CDC be-
gan measuring
bl
ood lead levels
in
the
U.s. population, ironically enough, af-
t
er
the Food and Drug Administration
voiced concerns about possible expo-
sures from eating food stored in lead-
soldered callS, which turned
out
to
be a
very minor risk com paned with leaded
gasolin
e.
As part of NHANES
II
, the
EPA
tested
for
certain persistent pesti-
cides
in
people's blood and nonpersis-
tent pesticides
or
their metabolites in
urine. After
an
eight-year hiatus,
NHANES
III
was
conducted
in
two
three-year phases from
1988
to
1994.
Tn
th
at iteration,
th
e COC measured lead
and
cadmium
and
began testing
for
co-
tinine,
th
e
major
metabolite of nicotine,
in
blood. Additionall
y,
U
,e
CDC began a
separate pilot program
to
measure new
compolmds, testing
for
trace
amounts
of
32
volatile organic chemicals in blood
and
12
pesticides or their metabolites in
urine from approximately 1,000 of the
NHANES
III participants.
Then came ano
th
er
long gap
in
cov-
e
ra
ge.
But thankfully, in
1999
, NHANES
became a continuous
survey
of
the
non institutiona
li
zed U.s.
popu
lation.
(It is thought that excluding members
of isolated organizations, such as mili-
tary personnel, college
students
and
prisoners, provides a better cross-sec-
ti
on of America.)
In
th
e
cu
rr
e
nt
design,
Identifying priority
exposures.
Out of thousands
of chemicals, whi
ch
are the most
dangerous? Biomarkers can help set
priorities for
public health
and regulatory C
fo
ll
ow-up.
1
Identifying at-risk
populations.
Large biomarker studies
can distinguish exposure differences among
racial, geographic or socioeconomic groups.
Providing integrated
dose measurements.
Biomarker analysis provides a
direct assay of body burden that
integrates exposure from a
ll
sources,
even ones that are hard
Recognizing time trends
in
exposure. Periodic measurement of
biomarkers
in
the population shows how body
burdens of chemicals vary from season
to
season, year to year and decade to decade.
•
Establishing reference
ranges for comparison.
A blood test shows that you'
ve
been
exposed to some chemical. Should you
be worried? Your
doctor can't
tell without data
from people
with little or no
exposure.
Evaluating exposure
prevention efforts.
Our government
is
entrusted with reducing
people's exposure to environmental
chemical
s.
Do
th
ey
succeed? Before-and-after
biomarker tests can tell.
1
to measure.
Fig
ur
e
6.
Wh
en used to establish levels
of
human chemical exposure, biomonitoring has six major u
ses
that
ca
n help to
pr
otect public hea lth.
www.americanscientist.org
2004 January-February 43
110
"'
c
Jl
100
'0
"0
'"
90
c
'"
0
~
'"
80
E-
w
70
:a
C
'"
60
0>
'"
.
~
50
"0
w
'"
~
40
"0
.!!!
'"
30
Predicted
blood
lead
::::r
70
17
:g,
16
"t;;
60
c
15
::;
"0
50
1
14
:9
o;
'"
j 40 -
13
>
.!!!
g>
12
"0
~
30
8
:0
~
11
c
'"
]
'"
20
"
E
10
"0
10
9
.!!!
'"
~
0
-
I
,
I
1975 1976 1977 1978
1979
1980
1981 1965 1970 1975 1980 1985 1990 1995
y
ear
year
Figure 7. Leaded gasol
in
e began
to
be
phased out in the 1970s. Although the predicted effect
on
blood lead was minimal, actual lead exposure
in
the U.S. population (measured in micrograms
of
lead
perdedlitcr
of
blood) sharply declined
between
1976 and 1980, paralleling
th
e changes
in gasoline
(left). Blood le
ad
and gas lead continued
to
fo
ll
ow
nearly identical decreases up to 1990. At the same time, a series
of
studies
on
le
ad
toxicity
showed
that lower
doses
could still cause adverse effects, prompting a steady decline in the level defining lead
poisoning
(right).
a new national s
ampl
e is
coll
ected
every two years. Although
so
me other
studies have locused on sp
ec
ifi
c
popu
-
la
ti
ons or
on
more r
es
tricted
dat
a,
NHANES is the only na
ti
onal s
ur
vey
that includes both a medical examina-
ti
on
and
collection of biological sam-
ples from participant
s.
In
dividuals se-
lected for NHANES are representati
ve
of the
U.
S. population, me
aning
that
th
ey
do not necessa
ril
y have high or
unu
sual exposures. About 5,
000
parti
c-
ipants are examined annually
fr
om 15
loca
ti
ons
thr
oughout the co
untr
y.
Reporting
For
Duty
In
March 2001, the CDC released the
National Report on Human Exposure
to Environmental Chemicals, which in-
cl
uded
data from 1
999
on 27 chemicals.
A seco
nd
report
wa
s published in Jan-
ua ry 2003 that examined
11
6 chemicals
in sa
mpl
es
fr
om 19
99-
2000. Both
stud
-
ies used biomonitoring to provide
an
on
go
ing assessme
nt
of exposure to a
variety
01
sub
stances. Although vari-
ous studies of workplace
ex
po
s
ur
e, lor
example, had
rai
se
d concerns about
the he
alth
e
ff
ects of such chemicals,
most of
them
had
n
eve
r before been
measured in a re
pr
esentative slice of
the
U.s.
population.
The inventory of tested substances
in
th
e second CDC report includes lead,
mercur
y,
cadmium and other metals;
persiste
nt
(organoc
hl
orine-based)
and
no
np
ersiste
nt
(o
rg
an
ophos
phat
e-
and
ca
rbamat
e-ba
se
d) insec
ti
cides, herbi-
cides
and
other pesticides; pest repel-
lents
and
disinfectan
ts;
cotinin
e;
phtha-
lates; polycyclic aromatic hydrocarbons;
di
ox
in
s,
furans and pol
yc
hlorinated
bipheny
ls
;
and
phytoestro
ge
ns. Results
fr
om the general population are subdi-
vided by
ag
e, gender
and
etluticity.
An important
fe
a
tur
e of the CDC re-
port is that it provides reference ranges
for ex
po
s
ure
amon
g the general U.S.
population.
If
peopl
e
ar
e c
on
c
erned
that
they may
ha
ve
be
en
exce
ss
ively
exposed to
an
environnlental chemical,
th
ey
ca
n compare their
bi
oma
rk
er lev-
els to those
standard
s.
These reference
ran
ges
a
re
immen
se
ly beneficial to
publi
c-
health s
ci
entists who
mu
st de-
cide il c
ertain
high-expos
ur
e g
roup
s
need
foU
ow-
up
action.
If
average levels
among the cohort
are
similar to those
of
th
e general publi
c,
then the
group
's
exp
os
ur
e is unlikely to cau
se
unique
problems.
On
the other ha
nd
,
if
levels
are s
ub
stantiaUy
hi
gher than na
ti
onal
Figure
8.
One
important function
of
biomon·
itoring is that
it
can identify specific
subpop-
ul
ations that may be more vulnerable
to
ex·
posure
from a
particular
chemical.
For
example, p,p'-DDE, a long-lasting metabolite
of
DOT
, is more than twice as high in Mexi·
can-Americans compared with the general
population.
By
contrast, cotinine
levels
are
the l
owest
among
this group, indicating that
they have
th
e least exposure to environmen-
tal
tobacco smoke.
For
both cotinine and lead,
non-hispanic blacks s
how
ed the highest lev-
els. DOE (in na
no
grams per gram
of
lipid)
and l
ead
(in
micrograms
per
deciliter
of
blood serum) data are from
th
e CDC's Sec-
ond National Report
on
Human Exposure to
Environmental Chemicals, published in 2003.
Information
on
cotinine (in nanograms per
milliliter
of
blood) is from the third National
Health and Nutrition Examination
Survey
(NHANES
III), 1988-1991.
no
rm
s, epidemiologists can confirm
th
e
unu
s
ual
ex
po
s
ure
, ide
ntif
y
th
e
so
urces
and
provide continuing health
care as appropriate. The reference
ran
ges
pr
ov
ide indirect
fin
ancial ad-
700
ai
:g:
600
We
~
u:;
500
.
;::
CI
Cii
CI
400
EE
g 2 300
0>
:Jl
2
00
1
00
.L
-' '
' '-
-=
~_
0.5
0.4
0.3
0.2
0.1
-' ' '
' '
-'-
-
3.0
44
Ameri
can
Scie
ntist,
Vo
lume
92
5
4
nonsmokers smokers
0.1 1.0 10 100
serum cotinine (ng/mL)
1000
vantages too, bec
au
se
distinguishing
common from
unu
sual chem
ic
al con-
tact helps
dir
ect reso
ur
ces to the most-
pertinent ex
po
s
ur
e situations.
The overarching
purp
ose of these re-
p
or
ts is to
help
scientists,
ph
ysicians
and health o
ffi
cials to prevent, reduce
and treat envir
Ol
IDl
enta
ll
y induced
ill
-
nesses. However, some caution must
be
exercised
in
interp
re
ting the finding
s:
It
is important to remember that detect-
in
g a chemi
ca
l in a per
so
n's
bl
ood or
urine does not by itse
lf
mean
th
at the
ex
posure c
au
ses disease. Se
par
ate s
ci-
entific studies
in
animals and hum
an
s
are required to determine w
h.i
ch levels
are likely to do h
ar
m. For most che
nu
-
cals, tox icol
og
ists simply don't ha
ve
this info
rm
a
ti
on.
But even
if
scientists are not s
ur
e of
the overa
ll
level of
ri
sk, they can make
co
ncrete statements about whether sit-
ua
ti
ons are getting better or wors
e.
The
la
test CDC report,
in
addition to listing
c
urr
ent biomarker levels in the popula-
tion, al
so
hi
g
hl
ights
so
me interesting
expos
ur
e
tr
e
nd
s gleaned
fr
om earlier
N
HA
NES findings. For example, from
1
99
1 to 1
99
4,4.4 percent of children be-
tween the ages of one and
fi
ve had lev-
els of
bl
ood le
ad
gre
at
er than or equaJ
to 10 micrograms per deciliter, the Fed-
eral ac
ti
on leve
l.
By the second
co
ll
ec-
tion period (1999 and 2000), o
nl
y 2.2
pe
rcent of this age gro
up
exceeded this
t
hr
eshold .
Ti
m decrease suggests that
eff
or
ts to reduce lead expos
ur
e for chil-
d
re
n have b
ee
n successful.
It
also serves
as a reminder that
so
me children,
in
-
cl
ud ing th
ose
li
ving in homes
with
lead-based paint or lea
d-
contaminated
du
st, remain at
un
acceptably
hi
gh risk.
The last r
epo
rt al
so
indicates a hope-
ful trend in the expos
ur
e to environ-
mental tobacco smoke, as sh
ow
n by
tests for
th
e
bi
omarker cotinine
in
the
bl
ood of nonsmoker
s.
Median lev
eJs
of
cotinine fell more than 70
pe
rce
nt
in
roug
hl
y a decad
e-
that is, between
th
e
second
(1988
to 1991) and third
(1
999
and 2000) periods of
dat
a co
ll
ec
ti
on.
T
hi
s
dr
op provides o
bj
ec
ti
ve
ev
idence
of reduced exposure to environmental
tobacco smoke f
or
th
e general U.s. pop-
ul
a
ti
on. Nevertheless,
th
e fact that more
than half of American youth continue
to
be
exposed to environmental tobacco
smoke
re
mains a publi
c-
health
co
ncern.
The CDC plans to release future re-
ports that document their biomonitor-
ing e
ff
orts every t
wo
year
s.
In
the next
edition, they w
ill
also a
dd
the findings
from separate studies of special
popu
-
www
.
ame
ricanscientist.org
Figure
9.
U.S
. population
cl
early segregates into smokers and nonsmokers based on the level
of
c
otinine
in blood.
The
working
th.reshold for
distingui
s
hing
the two
groups
is
]O
nanograms
per
milliliter
of
blood
serum
.
Among
nonsmok
ers, the highest values
of
cotinine were found
in children
under
12
,
and
they were strongly reflective
of
the
number
of smokers in the home.
Th
e data are from
NHANES
JII
, 1988-199].
lations, such as the laborers who apply
pes
ti
cides to crop
s,
people
li
ving near
hazardous-waste sites and workers in
le
ad
smelters, all of which a
re
likely to
have
hi
gher-than-average
ex
pos
ur
es to
certain enviro
nm
ental chemical
s.
Annual
Check-Up With Biomarkers?
As
th
e 21st ce
ntur
y
unf
olds, the C
DC
s
ur
veys and other
we
ll
-designed bi
o-
monito
ring
s
tudi
es will co
ntinu
e to
build an
under
standing of peopl
e's
e
x-
posure to tox
ic
environmental chemi-
cals. Nonetheless, these
dat
a will not
obviate the need to co
ll
ec
t o
th
er kinds
of rel
eva
nt informa
ti
on- to monitor
so
ur
ces of pollution, to co
ndu
ct s
ur
-
veys of tox
ic
s
ub
stances
in
the environ-
me
nt
and
to s
tud
y
human
ac
ti
vities
and behaviors that contribute to expo-
sure. Moreov
er
, further research in to
x-
i
co
logy and epidenuology is necessary
before specialists ca n
int
e
rpr
et
th
e
h
ea
lth Signific
an
ce
of ex p
os
ur
e bio-
markers for most environmental chem-
i
ca
ls. Particularly as detec
ti
on methods
impr
ove-
en
abling inves
ti
g
ator
s to
rn
easure lower concentrations of more
chem
ic
al
s from sma
ll
er s
amp
les at less
cost
-scie
ntific
und
erstanding of w
hat
th
e body does to
th
e chenu
ca
l (
and
vice
versa)
mu
st keep pace.
If
this e
ff
ort is
successful, a full scr
ee
n of expos
ure
biomarkers may be a
part
of
eve
ry
ro
utine
ph
ys
ical ex
am
in the not-
too-distant futur
e.
Bibliography
DeCaprio, A.
P.
1997. Biomarkers: coming of
age for environmental healt h
and
risk as-
sessmen
t.
Ell
v
irolllll
e
lltal
Sc
ie
ll
ce
& Te
e/molo-
gy
31
:1837-1848.
Mendelsohn, M.
L.
, j. P. Peeters and
M.
J. Nor-
mand
y,
eds. 1995.
Bi
omar
ke
rs
alld
Occ
upa-
tio
ll
al
Healtll:
P
rogress
an
d P
erspec
ti
ves.
Was
h-
ington,
IX
: joseph
He
n
ry
Press.
Me
nd
e
lsohn
, M.
L.
,
L.
C.
Mohr
and
j. P.
Peeters, eds.
1
99
8. B
io
mark
er
s:
Med
ic
al
and
Work
pla
ce
Applicatio
ll
s.
Wa
shington, DC:
joseph Henry Press.
Needh
am
, L.
L.
, and
K.
Sexton.
20C10
. Assessing
ch
il
dren
's
exposure to hazardous environ-
mental chemicals: An overview of select
ed
research cha
ll
enges and c
omp
lexities. /our-
lIal
of
Expos
ure Analysis
alld
Etf
v
iroll1"
elltal
Epid
emiol
og
y 10 (Pa
rt
2)
:6
11-629.
Ne
edham
,
L.
L.
,
D.
C. Patter
so
n, Jr.,
V.
W.
Burse, D.
C.
Paschal, W. E. T
urner
and
R.
H.
Hill, Jr. 1996. Reference range data for as-
sessing exposure to selected environmental
toxicants.
To
xicology
alld
Illdus
tria
l Heaflll
12
:507-
513.
Pirkl
e,
J.
L.
, E. J. Sampson, L.
L.
Need h
am
, D. G.
Patterson, Jr
.,
and O.
L.
Ashle
y.
1
995
. Using
biological
mon itoring
to assess human expo-
sure to priority toxicants.
Ell
v
irollm
elltal
H
ea
ltll
P
erspec
ti
ves
103 (supplement
3):
45-48.
For relevant Web links, consult this
issue of
America"
Sc
ie
llt
is
t O
l/Iill
e:
http
·//w
ww
ametican
SC
ientjs!
m:g
I
I
SS
u
eTOC/
i
ss
ye
/
S21
2004
janu
ary-
February 45