Nutrition Education in Public Elementary and Secondary Schools doc
Bạn đang xem bản rút gọn của tài liệu. Xem và tải ngay bản đầy đủ của tài liệu tại đây (189.68 KB, 64 trang )
NATIONAL CENTER FOR EDUCATION STATISTICS
Survey Report July 1996
Nutrition Education in
Public Elementary and
Secondary Schools
Carin Celebuski
Elizabeth Farris
Westat, Inc.
Judi Carpenter
Project Officer
National Center for Education Statistics
U.S. Department of Education
Office of Educational Research and Improvement NCES 96-852
U.S. Department of Education U.S. Department of Agriculture
Richard W. Riley Dan Glickman
Secretary Secretary
Office of Educational Research and Improvement Ellen Haas
Sharon P. Robinson Under Secretary for Food, Nutrition, and
Assistant Secretary Consumer Services
National Center for Education Statistics Food and Consumer Service
Pascal D. Forgione, Jr. William E. Ludwig
Commissioner Administrator
Jeanne E. Griffith Office of Analysis and Evaluation
Associate Commissioner Michael E. Fishman
Acting Director
National Center for Education Statistics
"The purpose of the Center shall be to collect, and analyze,
and disseminate statistics and other data related to
education in the United States and in other nations."—
Section 406(b) of the General Education Provisions Act, as
amended (20 U.S. C. 1221e-1).
July 1996
Contact:
Judi Carpenter
(202) 219-1333
This report was prepared by Westat, Inc., under contract with the National Center for Education
Statistics and under a cooperative agreement with the Food and Consumer Service, U.S.
Department of Agriculture.
iii
Highlights
• Practically all public schools (99 percent) offer nutrition
education somewhere within the curriculum, and many integrate it
within the total curriculum (70 percent). Nutrition education is
concentrated within the health curriculum (84 percent), science
classes (72 percent), and school health program (68 percent)
(table 1). Although nutrition education is an active area, the
intensity and quality of the nutrition messages students are
receiving is not known.
• For each grade from kindergarten through eighth, 50 percent or
more of all schools have district or state requirements for students
to receive nutrition education. However, only 40 percent have
these requirements for ninth and tenth grades; and about 20
percent for eleventh and twelfth grades (figure 1).
• Topics in nutrition covered by more than 90 percent of all schools
are: the relationship between diet and health, finding and choosing
healthy foods, nutrients and their food sources, the Food Guide
Pyramid, and the Dietary Guidelines and goals (table 4).
However, with the exception of the Food Guide Pyramid, less than
half of schools cover these topics thoroughly.
• Overall, schools focus on increasing students’ knowledge about
what is meant by good nutrition, with less emphasis on influencing
students’ motivation, attitudes, and eating behaviors. Four of the
five topics covered by more than 90 percent of all schools are
related to knowledge. With the exception of finding and choosing
healthy foods, less than one-third of schools provide thorough
coverage of topics related to motivation, attitudes, and eating
behaviors (table 4).
• Research has shown that schools or districts where the nutrition
education efforts are coordinated by a person or group have an
opportunity to present a more focused message to students about
the importance of healthy eating. However, the majority of
schools (61 percent) have no nutrition education coordination,
meaning each teacher is responsible for his or her own lessons
(table 6).
• Most schools use materials developed by teachers in their schools
(90 percent), health or science textbooks (89 percent), and
materials developed for a specific grade level (83 percent) (table
10).
• Ninety-seven percent of schools report receiving nutrition lesson
materials from at least one source outside the school, most often
from professional or trade associations (87 percent), and the food
industry (86 percent). However, for any given outside source,
only 37 percent or less of schools used all or
iv
most of the materials received. Of the materials from sources
outside the school, schools reported the highest classroom usage
for those received from the food industry or commodities groups,
professional or trade associations, the USDA Food and Nutrition
Information Center, and state education agencies (table 8).
• Over 90 percent of all schools offer nutrition education through
the school meals program. Most information is offered through
bulletin boards with nutrition displays (65 percent) or during
school lunch week (51 percent). Less than half of school meals
programs offer nutrient information, serve meals to correspond
with classroom activities, give tours or provide nutrition input to
newsletters. Less than one quarter of school meals programs
provide nutrition education in the classroom or conduct tasting
parties (table 11).
• Most respondents (84 percent) are of the opinion that the meals
programs in their schools follow generally healthy eating practices
(figure 5). Schools reporting that their meals programs follow
healthy eating practices are substantially more likely to be
involved in nutrition education activities than those that do not
report following them (table 14).
v
Table of Contents
Page
Highlights iii
Introduction 1
Nutrition Education in the School Curriculum 4
Nutrition Education Topics 7
Coordination of Nutrition Education 10
Resources for Nutrition Education 13
Materials Used to Teach Nutrition 13
Sources of Materials 13
School Meals Program 15
Other Resources 19
Summary and Conclusions 20
List of Appendices
Appendix
A Survey Methodology and Data Reliability 23
B Tables of Standard Errors 31
C Survey Form 51
D U.S. Public Law 103-448. 103d Cong. 2 Nov. 1994. Child Nutrition
Act of 1966. Section 19(a) 57
vi
List of Figures
Figure Page
1 Percent of public schools where nutrition is taught and where nutrition education
is required, by grade: 1995 5
2 Percent of public schools where nutrition is taught and where nutrition education
is required in at least one grade, by instructional level: 1995 7
3 Percent of coordinators with various highest levels of training in nutrition or a
nutrition-related area: 1995 12
4 Percent of public schools that report student and parent input into the meals
program, by geographic region: 1995 17
5 Percent of respondents who are of the opinion that their school meals program
follows generally healthy eating practices, by instructional level: 1995 18
6 Percent of public schools that use special events for nutrition education: 1995 19
vii
List of Tables
Table Page
1 Percent of public schools offering nutrition education within the school curriculum,
by school characteristics: 1995 4
2 Percent of public schools where nutrition is taught, by grade and geographic
region: 1995 6
3 Percent of public schools where nutrition education is required, by grade and
geographic region: 1995 6
4 Percent of public schools that cover various topics in nutrition education, the
percent that cover them thoroughly, and the percent for whom the topic
represents a main focus of nutrition education at their school: 1995 8
5 Percent of public schools that cover various topics in nutrition education, by
instructional level: 1995 9
6 Percent of public schools with various types of nutrition education coordination,
by school characteristics: 1995 11
7 Percent of public schools offering nutrition education within the school curriculum,
by person or group responsible for coordinating nutrition education: 1995 12
8 Percent of public schools that use various types of materials to teach nutrition
education, by instructional level: 1995 13
9 Percent of public schools that receive and use materials for nutrition education
from various sources: 1995 14
10 Percent of public schools that receive and use materials for nutrition education
from the Cooperative Extension Service, by school characteristics: 1995 15
11 Percent of public schools where the school meals program provides nutrition
education or coordinates with classroom efforts, by instructional level: 1995 16
12 Percent of public schools where the school meals program provides nutrition
education or coordinates with classroom efforts, by geographic region: 1995 16
13 Percent of public schools where the school meals program solicits input through
a student advisory group or pretesting new foods, by instructional level: 1995 17
14 Percent of public schools that report various meals program efforts, by
whether the respondent is of the opinion that their school meals program follows
generally healthy eating practices: 1995 19
viii
1
Introduction The link between food and health has been well documented by
numerous studies and reports describing the impact of dietary intake
on disease prevention and health promotion. Dietary
recommendations and long-term health objectives, including the
Dietary Guidelines for Americans
1
and the Year 2000 Health
Objectives for the Nation,
2
call for Americans to reduce intake of total
fat, saturated fat, and cholesterol; increase intake of fruits, vegetables,
grain products, and foods rich in calcium; and moderate intake of
sugars, salt, and alcohol.
Many Americans consume excess calories for their level of activity,
and have diets inconsistent with the Dietary Guidelines for Americans-
-too high in fat, sodium, and sugar, with not enough grains, fruits, and
vegetables. These unhealthy eating patterns may contribute to illness
and premature death in the long term.
Dietary factors are associated with 5 of the 10 leading causes
of death: coronary heart disease, some types of cancer,
stroke, noninsulin-dependent diabetes mellitus, and
atherosclerosis.
3
Because eating habits developed during childhood have the potential to
last a lifetime, it is important for children to learn about the benefits of
good nutrition. Therefore, the Child Nutrition Act of 1966 views
nutrition education as “a matter of highest priority.”
4
Its importance
is further addressed in Healthy People 2000, the list of health
objectives developed by the U.S. Public Health Service, in which the
public health community seeks, by the year 2000, to increase to at
least 75 percent the proportion of the Nation’s schools that provide
nutrition education from preschool through 12th grade, preferably as a
part of quality school health education. Education to establish healthy
eating habits early in life can “assure that individuals have the
information and skills they need to protect and enhance their own
health and the health of their families.”
5
1
Dietary Guidelines for Americans. U.S. Department of Agriculture and U.S. Department of Health and Human
Services. Home and Garden Bulletin No. 232. Fourth Edition. 1995.
2
Healthy People 2000: National Health Promotion and Disease Prevention Objectives. 1991. U.S. Department
of Health and Human Services. Public Health Service. (PHS) 91-50212.
3
Healthy People 2000, p. 112.
4
See Appendix D, Child Nutrition Act: P.L. 103-448, Sec. 19(a).
5
Healthy People 2000, p. 251.
2
The education community is also supportive of nutrition education
goals. A guide for the education community, the National Education
Goals in the Goals 2000: Educate America Act states that, by the
year 2000, “all students will have access to physical education and
health education to ensure they are healthy and fit.”
The U.S. Department of Agriculture (USDA) actively supports these
Year 2000 Goals through its School Meals Initiative for Healthy
Children,
6
which promotes proper nutrition and nutrition education
for children based on the Dietary Guidelines for Americans and the
Food Guide Pyramid. This initiative requires schools to serve meals
that meet Federal Dietary Guidelines and to teach children about
nutrition so they will choose foods that are good for them. The USDA
established Team Nutrition to help schools implement the new
requirements in the School Meals Initiative. The mission of Team
Nutrition is to improve the health and education of young people by
creating innovative public and private partnerships that promote food
choices for a healthful diet through media, schools, families, and the
community. Team Nutrition is working toward its goals through two
initiatives which include training and technical assistance to school
food service personnel and adequate nutrition education for children.
7
In-school efforts emphasize the importance of nutrition education to
the success of nutrition policy changes in school meals.
It is not enough to change the food on the plate. We must also
provide the knowledge and the skills that enable children to
make choices that lead to a nutritious diet and improved
health. It also is vital that local meal providers receive
training on how to improve meal quality. This dual initiative
to educate children and assist meal providers offers many
opportunities to influence both what foods are offered by
schools and what foods are eaten by children.
8
These efforts are supplemented with materials developed and
distributed through partner networks and directly by USDA’s Food
and Consumer Service and its Cooperative State Research, Education,
and Extension Service, as well as other government agencies such as
the Department of Education and the Department of Health and
Human Services.
6
Part of the implementation of the National School Lunch Program. 7CFR Parts 210 and 220.
7
Team Nutrition. 1995. U.S. Department of Agriculture.
8
Federal Register, June 13, 1995.
3
This report presents the findings from the survey Nutrition Education
in Public Schools, K-12 that was requested by the Food and
Consumer Service of the USDA. It was designed to provide data on
the status of nutrition education in U.S. public schools in order to help
track current and future initiatives. The survey was conducted during
the spring of 1995 through the Fast Response Survey System (FRSS)
of the National Center for Education Statistics (NCES) by Westat,
Inc., a research firm in Rockville, Maryland.
The questionnaires were sent to 1,000 school principals of a nationally
representative sample of U.S. public elementary, middle, and high
schools (see Appendix A for survey methodology). The principals
were asked to assign the completion of the survey to the person most
knowledgeable about nutrition education at the school. Respondents
were encouraged to consult with others if they were unsure of the
answer to a question. The survey requested information about the
following issues:
• The placement of nutrition education in the curriculum,
• The content of nutrition instruction,
• The coordination of nutrition education, and
• Resources for nutrition education.
Survey findings are presented for all schools and frequently by the
following school characteristics:
• School instructional level: elementary school; middle school;
and high school.
• School enrollment size: small (less than 300); moderate (300-
499); and large (500 or more).
• Metropolitan status of school: city; urban fringe; town; and
rural.
• Geographic region: Northeast; Southeast; Central; and West.
Data have been weighted to national estimates of public schools. All
comparative statements made in this report have been tested for
statistical significance though chi-square tests or t-tests adjusted for
multiple comparisons using the Bonferroni adjustment and are
4
significant at the .05 level or better. However, not all statistically
significant comparisons have been presented.
Nutrition
Education in
the School
Curriculum
Practically all public schools (99 percent) offer nutrition education
somewhere within the curriculum and many integrate it within the
total curriculum (70 percent ) (table 1). The most common placement
is within the health curriculum (84 percent), but many schools also
teach nutrition through science classes (72 percent), or through a
school health program (68 percent). While this does not provide
information about the intensity or quality of the nutrition messages
students are receiving, it shows that the messages are being conveyed
in a variety of ways within the schools.
Table 1.—Percent of public schools offering nutrition education
within the school curriculum, by school characteristics:
1995
School characteristic
Some-
where
within
curric-
ulum
Integrated
within the
total
curricu-
lum
Health
curric-
ulum
Science
curric-
ulum
School
health
program
Home
econom-
ics curric-
ulum
All public schools 99 70 84 72 68 41
Instructional level
Elementary school 100 80 81 73 67 16
Middle school 99 55 85 71 66 72
High school 99 50 93 71 73 92
Size of enrollment
Small 99 71 82 69 66 44
Moderate 99 72 83 74 68 27
Large 99 68 86 74 69 49
Metropolitan status
City 99 78 83 73 66 29
Urban fringe 99 68 82 70 69 36
Town 99 69 85 70 69 44
Rural 100 65 85 76 68 53
Geographic region
Northeast 100 72 79 75 71 40
Southeast 100 71 78 71 70 38
Central 100 68 88 69 69 45
West 98 69 88 75 65 41
NOTE: Respondents could report nutrition education in more than one place.
SOURCE: U.S. Department of Education, National Center for Education Statistics, Fast Response
Survey System, “Nutrition Education in U.S. Public Schools, K-12,” FRSS 52, 1995.
5
Given their classroom organization, elementary schools (80 percent)
tend more than schools at other instructional levels to offer nutrition
education integrated within the total school curriculum, although half
or more of middle and high schools also reported this. High schools
are most likely to place nutrition education within the health
curriculum (93 percent) and the home economics curriculum (92
percent). The health curriculum is also the most common placement
for nutrition education in middle schools (85 percent). Fifty-three
percent of rural schools offer nutrition education through the home
economics curriculum, compared with 29 percent of city schools.
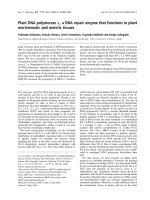
Nutrition is taught in each and every grade from kindergarten through
tenth grade in over 90 percent of all public schools; it is taught in
eleventh and twelfth grades in over 80 percent of schools (figure 1 and
table 2). These statistics do not reflect the proportion of students
participating at each grade level, but give a broad overview of
nutrition education offerings. The percent of schools with nutrition
education requirements is substantially lower at each grade level than
the percent of schools that teach nutrition. For each grade from
kindergarten through eighth, at least 50 percent of all schools have
district or state requirements for students to receive nutrition
education; 40 percent have these requirements for ninth and tenth
grades; about 20 percent for eleventh and twelfth grades (figure 1 and
table 3).
Figure 1.—Percent of public schools where nutrition is taught and
where nutrition education is required, by grade: 1995
0
20
40
60
80
100
K 1 2 3 4 5 6 7 8 9 10 11 12
Grade
Percent
Taught
Required
SOURCE: U.S. Department of Education, National Center for Education Statistics, Fast Response
Survey System, “Nutrition Education in U.S. Public Schools, K-12,” FRSS 52, 1995.
6
Table 2.—Percent of public schools where nutrition is taught, by
grade and geographic region: 1995
Grade
All public
schools
Northeast Southeast Central West
Kindergarten 92 90 93 92 91
1st grade 94 89 94 95 96
2nd grade 96 92 97 97 96
3rd grade 94 92 97 93 95
4th grade 96 93 100 95 95
5th grade 93 90 98 91 94
6th grade 93 94 97 91 92
7th grade 95 92 99 96 91
8th grade 91 89 95 94 88
9th grade 91 84 91 93 93
10th grade 92 88 95 89 95
11th grade 84 86 90 81 82
12th grade 84 83 89 82 82
SOURCE: U.S. Department of Education, National Center for Education Statistics, Fast Response
Survey System, “Nutrition Education in U.S. Public Schools, K-12,” FRSS 52, 1995.
Table 3.—Percent of public schools where nutrition education is
required, by grade and geographic region: 1995
Grade
All public
schools
Northeast Southeast Central West
Kindergarten 58 58 65 58 53
1st grade 61 62 66 61 55
2nd grade 62 62 70 64 55
3rd grade 60 60 68 61 54
4th grade 62 60 75 68 51
5th grade 60 59 72 59 54
6th grade 58 58 66 56 54
7th grade 58 62 64 57 51
8th grade 50 51 58 48 46
9th grade 40 37 49 37 39
10th grade 40 39 39 36 45
11th grade 23 36 21 21 20
12th grade 20 28 21 20 16
SOURCE: U.S. Department of Education, National Center for Education Statistics, Fast Response
Survey System, “Nutrition Education in U.S. Public Schools, K-12,” FRSS 52, 1995.
Among all schools, 99 percent teach nutrition in at least one of their
grades, and 64 percent require nutrition education in at least one of
their grades (figure 2). Substantially more elementary schools than
high schools require nutrition education in at least one of their grades
(68 versus 54 percent).
7
Figure 2.—Percent of public schools where nutrition is taught and
where nutrition education is required in at least one
grade, by instructional level: 1995
99 99
98
97
64
68
6
1
54
0
20
40
60
80
10
All public
schools
Elementary
school
Middle
school
High
school
Instructional level
Percent
Nutrition taught
Nutrition education
required
SOURCE: U.S. Department of Education, National Center for Education Statistics, Fast Response
Survey System, “Nutrition Education in U.S. Public Schools, K-12,” FRSS 52, 1995.
Nutrition
Education
Topics
Nutrition education in the classroom is intended to accomplish three
important objectives.
9
The first is to convey needed information, or
the facts about nutrition, so students are knowledgeable about healthy
eating practices. The second is to change unhealthy attitudes so
students have the motivation to establish healthy eating practices. The
third is to teach positive skills so students have all the tools to
accomplish their nutritional goals. The challenge is to further these
objectives in ways that are age-appropriate and that respect personal
and cultural preferences. The survey included a list of 17 nutrition
topics that were divided into the following 3 categories: knowledge,
motivation and attitudes, and behavior.
10
Respondents reported which
of the topics are covered in any grade in the school, the extent of
coverage (for those topics covered), and which topics represent a main
focus of nutrition education at the school.
Schools reported covering a wide range of topics. Each of the 17
topics are covered in the nutrition curricula of at least 60 percent of
schools (table 4). Topics covered by more than 90 percent of schools,
and covered thoroughly by the greatest percent, are the following:
9
Collins, Janet L., Leavy Small, M., Kann, L., Collins Pateman, B., Gold, R., and Kolbe, L., “School Health
Education.” Journal of School Health, 65(8) (October 1995):302.
10
See Appendix C, Survey Form, Question 2.
8
• The relationship between diet and health,
• Finding and choosing healthy foods,
• Nutrients and their food sources,
• The Food Guide Pyramid, and
• Dietary guidelines and goals.
Table 4.—Percent of public schools that cover various topics in
nutrition education, the percent that cover them
thoroughly, and the percent for whom the topic
represents a main focus of nutrition education at their
school: 1995
Topic Covered
Covered
thoroughly
Represents
a main
focus*
Relationship between diet and
health 97 45 47
Finding and choosing healthy
foods 97 40 34
Nutrients and their food sources 96 43 42
Food Guide Pyramid 94 53 47
Dietary guidelines and goals 92 38 35
Reading food labels 90 32 8
Influences on food choices, such as
habits, advertising, beliefs, and
cultural preferences 87 21 15
Changing eating habits
(e.g., willingness to try new
foods) 85 20 9
Link between diet and diseases
such as hypertension, heart
disease, and cancer 83 29 13
Interpreting nutritional information
from food labels 83 31 9
Healthy weight control 82 23 5
Preparing healthy food 78 32 8
Developing a personal nutrition
plan 74 22 4
Body image 72 18 4
Signs and symptoms of eating
disorders and health risks of
diets, pills, binging, and purging 71 28 8
Keeping a food diary 61 22 1
Association between eating and
stress 60 17 4
*Schools were asked to report up to three.
SOURCE: U.S. Department of Education, National Center for Education Statistics, Fast Response
Survey System, “Nutrition Education in U.S. Public Schools, K-12,” FRSS 52, 1995.
9
Many topics are covered at all instructional levels. However, high
schools are more likely to cover such age-appropriate topics as
healthy weight control, body image, eating disorders, and the
association between eating and stress; middle schools are next most
likely; and elementary schools are least likely to cover these topics
(table 5).
Table 5.—Percent of public schools that cover various topics in
nutrition education, by instructional level: 1995
Topic
All public
schools
Elementary
school
Middle
school
High
school
Relationship between diet and
health 97 96 97 99
Finding and choosing healthy
foods 97 96 96 99
Nutrients and their food
sources 96 95 96 99
Food Guide Pyramid 94 93 94 96
Dietary guidelines and goals 92 90 93 97
Reading food labels 90 86 94 98
Influences on food choices,
such as habits, advertising,
beliefs, and cultural
preferences 87 83 90 96
Changing eating habits
(e.g., willingness to try new
foods) 85 82 84 96
Link between diet and diseases
such as hypertension, heart
disease, and cancer 83 76 93 96
Interpreting nutritional
information from food labels 83 77 91 97
Healthy weight control 82 74 91 98
Preparing healthy food 78 69 89 95
Developing a personal nutrition
plan 74 66 81 90
Body image 72 62 82 93
Signs and symptoms of eating
disorders and health risks of
diets, pills, binging, and
purging 71 57 89 98
Keeping a food diary 61 51 71 82
Association between eating and
stress 60 46 75 92
SOURCE: U.S. Department of Education, National Center for Education Statistics, Fast Response
Survey System, “Nutrition Education in U.S. Public Schools, K-12,” FRSS 52, 1995.
10
Schools were asked to select the three topics that represent a main
focus of nutrition education at their schools. The Food Guide
Pyramid and the relationship between diet and health were each
selected by 47 percent of all schools surveyed. Nutrients and their
food sources were selected by 42 percent of schools, and 35 percent
selected dietary guidelines and goals as part of the school’s main focus
(table 4).
Coordination
of Nutrition
Education
Research has shown that schools or districts where the nutrition
education efforts are coordinated by a person or group have an
opportunity to present a more focused message to students about the
importance of healthy eating. Coordination can integrate the
curriculum across grades so the nutrition lessons at each grade level
build on the previous year’s lessons, can integrate the nutrition
messages across subjects within a grade, and can integrate classroom
nutrition lessons with related nonclassroom activities. In addition,
coordinators can act as repositories and resources for materials
received by the school or district.
Schools reported the manner in which their nutrition education efforts
are coordinated by a person or group. The majority of public schools
(61 percent) have no nutrition education coordination, meaning each
teacher is responsible for his or her nutrition lessons (table 6). About
9 percent of the schools have one person within the school
coordinating nutrition education; 24 percent coordinate using a group
or committee; and about 6 percent have someone outside the school,
for example from the district, coordinate nutrition education.
Coordination from outside the school is more likely for elementary
schools (8 percent) compared with middle schools (3 percent), and for
city schools (13 percent) compared with town (3 percent) or rural
schools (3 percent). A school’s type of nutrition education
coordination does not affect the curriculum placement of nutrition
education within the school (table 7).
11
11
Because of the smaller sample sizes for each type of coordination, the standard errors for these percents were
large (see Table 7a in Appendix B). Therefore, the differences shown in table 7 are not statistically significant.
11
Table 6.—Percent of public schools with various types of nutrition
education coordination, by school characteristics: 1995
School characteristic
One person
for the whole
school
Several
teachers, a
group or
committee
Someone
outside the
school*
No
coordination
effort
All public schools 9 24 6 61
Instructional level
Elementary school 7 19 8 66
Middle school 14 40 3 44
High school 12 25 4 59
Size of enrollment
Small 10 19 6 66
Moderate 10 21 6 62
Large 9 28 6 57
Metropolitan status
City 8 20 13 59
Urban fringe 9 24 7 60
Town 13 28 3 56
Rural 8 23 3 67
Geographic region
Northeast 13 21 7 59
Southeast 6 25 9 60
Central 11 28 5 56
West 8 19 6 67
*For example, from the district.
SOURCE: U.S. Department of Education, National Center for Education Statistics, Fast Response
Survey System, “Nutrition Education in U.S. Public Schools, K-12,” FRSS 52, 1995.
12
Table 7.—Percent of public schools offering nutrition education
within the school curriculum, by person or group
responsible for coordinating nutrition education: 1995
Placement of nutrition
education
One person
for the whole
school
Several
teachers, a
group or
committee
Someone
outside the
school*
No
coordination
effort
Integrated within the
total curriculum 60 68 83 70
Health curriculum 79 88 90 82
Science curriculum 65 72 70 74
School health program 68 81 74 62
Home economics
curriculum 47 52 17 39
*For example, from the district.
SOURCE: U.S. Department of Education, National Center for Education Statistics, Fast Response
Survey System, “Nutrition Education in U.S. Public Schools, K-12,” FRSS 52, 1995.
The educational background and training of the people responsible for
coordination of nutrition education varies among the small number of
schools that have a single coordinator on staff (figure 3). Seventy-two
percent have a coordinator with a bachelor’s degree or higher in
nutrition or a nutrition-related area. About 61 percent have a
coordinator, regardless of education level, who has completed some
inservice or other training in nutrition or a nutrition-related area (not
shown in a table).
Figure 3.—Percent of coordinators with various highest levels of
training in nutrition or a nutrition-related area: 1995
1%
5%
20%
38%
34%
2%
Graduate degree
Bachelor's degree
Associate's degree
College coursework
Inservice training
None
Highest training
NOTE: Based on the estimated number of public schools with a single nutrition education
coordinator: 7,290 (9 percent).
SOURCE: U.S. Department of Education, National Center for Education Statistics, Fast Response
Survey System, “Nutrition Education in U.S. Public Schools, K-12,” FRSS 52, 1995.
13
Resources for
Nutrition
Education
Nutrition education resources available to schools include not only
curriculum and other lesson materials but also the school meals
program, guest speakers, and assemblies and other events. All of
these can be coordinated to enhance positive nutrition messages. The
FRSS survey asked schools about receiving these resources and the
extent to which resources received are used at their schools.
Materials Used to
Teach Nutrition
Various types of materials are commonly used by schools to teach
nutrition in the classroom. Most schools use materials developed by
teachers in their schools (90 percent), health or science textbooks (89
percent), and materials developed for a specific grade level (83
percent) (table 8). High schools are more likely than schools at other
instructional levels to use state-recommended (79 percent) or state-
mandated (58 percent) materials for nutrition instruction, and
elementary schools (44 percent) are more likely than middle schools
(33 percent) to use materials developed by a district-level curriculum
coordinator (table 8).
Table 8.—Percent of public schools that use various types of
materials to teach nutrition education, by instructional
level: 1995
Type of material used
All public
schools
Elementary
school
Middle
school
High school
From external sources 92 93 90 94
Developed by teachers in the
school 90 90 87 93
Health or science textbooks 89 87 90 93
Developed for a specific
grade level 83 87 81 74
State-recommended 65 61 64 79
State-mandated 44 40 43 58
Developed by district-level
curriculum coordinator 40 44 33 35
SOURCE: U.S. Department of Education, National Center for Education Statistics, Fast Response
Survey System, “Nutrition Education in U.S. Public Schools, K-12,” FRSS 52, 1995.
Sources of
Materials
Many schools use packaged materials and lesson plans for nutrition
instruction. Given a list of 10 outside sources, schools were asked to
identify those from which they received nutrition education resources
for teaching, and the extent to which the resources were used at their
school. Ninety-seven percent of schools report receiving nutrition
lesson materials from at least one source outside of the school, most
often from professional or trade
14
associations (87 percent) and the food industry or commodities
groups, such as the Dairy Council or the Potato Board (86 percent)
(table 9).
Table 9.—Percent of public schools that receive and use materials
for nutrition education from various sources: 1995
Source
Materials
received
All or most
materials used*
All sources 97 -
Professional or trade association 87 32
Food industry or commodities
group 86 37
School library 71 33
Cooperative Extension Service 65 22
USDA Food and Nutrition
Information Center 64 32
State education agency 58 31
State Nutrition Education Training
(NET) Program 42 29
American School Food Service
Association 40 26
Colleges or universities 35 18
National Food Service Management
Institute 26 24
*Of schools that received the materials.
SOURCE: U.S. Department of Education, National Center for Education Statistics, Fast Response
Survey System, “Nutrition Education in U.S. Public Schools, K-12,” FRSS 52, 1995.
The two Federal government sources, the Cooperative Extension
Service (also known as the USDA Extension Service) and the USDA
Food and Nutrition Information Center, were identified by over 60
percent of schools as sources for lesson materials and other resources.
The Cooperative Extension Service has as its mission to diffuse
practical information about agriculture, home economics, and rural
energy. Rural schools (78 percent) and small schools (75 percent) are
most likely to receive materials from this source (table 10). Because
of the sample size for this survey, the effects of school size cannot be
distinguished from the effects of metropolitan status through a
multivariate analysis, but among all public schools in the U.S., small
schools tend to be rural and rural schools tend to be small.
15
Table 10.—Percent of public schools that receive and use
materials for nutrition education from the Cooperative
Extension Service, by school characteristics: 1995
School characteristic
Materials
received
All or most
materials used*
All public schools 65 22
Size of enrollment
Small 75 24
Moderate 67 18
Large 57 23
Metropolitan status
City 57 24
Urban fringe 45 19
Town 72 25
Rural 78 20
*Of schools that received the materials.
SOURCE: U.S. Department of Education, National Center for Education Statistics, Fast Response
Survey System, “Nutrition Education in U.S. Public Schools, K-12,” FRSS 52, 1995.
Of the materials from sources outside the school, schools reported the
highest classroom usage for those received from the food industry or
commodities groups, professional or trade associations, the USDA
Food and Nutrition Information Service, and state education agencies
(table 9).
School Meals
Program
Healthy People 2000 states that “optimally, school nutrition
education should include educational cafeteria experiences as well as
classroom work.”
12
It appears that most schools are taking some steps
toward achieving this goal. Ninety-one percent of all schools offer
nutrition education for students in some way through the school meals
program: 93 percent of elementary, 88 percent of middle, and 86
percent of high schools (table 11). More than half of elementary
schools reported displaying nutrition information on the cafeteria
bulletin board and sponsoring a “school lunch week” where parents
eat with students and participate in other activities. Meals programs in
elementary schools are more likely than those at other instructional
levels to provide kitchen tours.
12
Healthy People 2000, p. 127.
16
Table 11.—Percent of public schools where the school meals
program provides nutrition education or coordinates
with classroom efforts, by instructional level: 1995
Meals program effort
All public
schools
Elementary
school
Middle
school
High
school
Any effort 91 93 88 86
Bulletin board with nutrition
displays 65 68 63 57
School lunch week 51 57 45 37
Nutrient information 48 49 46 47
Serves meals to correspond
with classroom activities 46 49 44 37
Tours 35 39 27 28
Nutrition input to newsletter 32 36 29 20
Education in classroom 22 25 16 18
Tasting parties 21 24 19 15
SOURCE: U.S. Department of Education, National Center for Education Statistics, Fast Response
Survey System, “Nutrition Education in U.S. Public Schools, K-12,” FRSS 52, 1995.
Table 12.—Percent of public schools where the school meals
program provides nutrition education or coordinates
with classroom efforts, by geographic region: 1995
Meals program effort
All public
schools
Northeast Southeast Central West
Any effort 91 91 96 89 88
Bulletin board with nutrition
displays 65 57 85 60 60
School lunch week 51 40 69 49 46
Nutrient information 48 49 61 41 44
Serves meals to correspond
with classroom activities 46 51 60 37 41
Tours 35 28 51 28 34
Nutrition input to newsletter . 32 34 41 29 26
Education in classroom 22 16 38 18 19
Tasting parties 21 17 39 15 18
SOURCE: U.S. Department of Education, National Center for Education Statistics, Fast Response
Survey System, “Nutrition Education in U.S. Public Schools, K-12,” FRSS 52, 1995.
17
In addition to actively providing education, the meals program can
support nutrition education by involving students in school menu
planning and making healthy foods available at school for students to
choose. About a third of all school meals programs solicit input from
student advisory groups, and about 1 in 5 ask parents and students to
pretest new foods (table 13 and figure 4).
Table 13.—Percent of public schools where the school meals
program solicits input through a student advisory
group or pretesting new foods, by instructional level:
1995
Type of input
All public
schools
Elementary
school
Middle
School
High
school
Student advisory group
provides input to the meal
service 34 34 37 34
School food service director has
parents and students pretest
new foods for the cafeteria
20 20 24 17
SOURCE: U.S. Department of Education, National Center for Education Statistics, Fast Response
Survey System, “Nutrition Education in U.S. Public Schools, K-12,” FRSS 52, 1995.
Figure 4.—Percent of public schools that report student and
parent input into the meals program, by geographic
region: 1995
34
20
34
18
46
26
29
19
31
18
0
20
40
60
80
100
Percent All public schools
Northeast
Southeast
Central
West
Input from student advisory group to
the meal service
Parents and students pretest new
foods for the cafeteria
SOURCE: U.S. Department of Education, National Center for Education Statistics, Fast Response
Survey System, “Nutrition Education in U.S. Public Schools, K-12,” FRSS 52, 1995.